Advanced Quantitative Methods for Managers: Data Analysis and Findings

Verified

Added on  2020/05/28

|15
|2303
|54
Homework Assignment
AI Summary
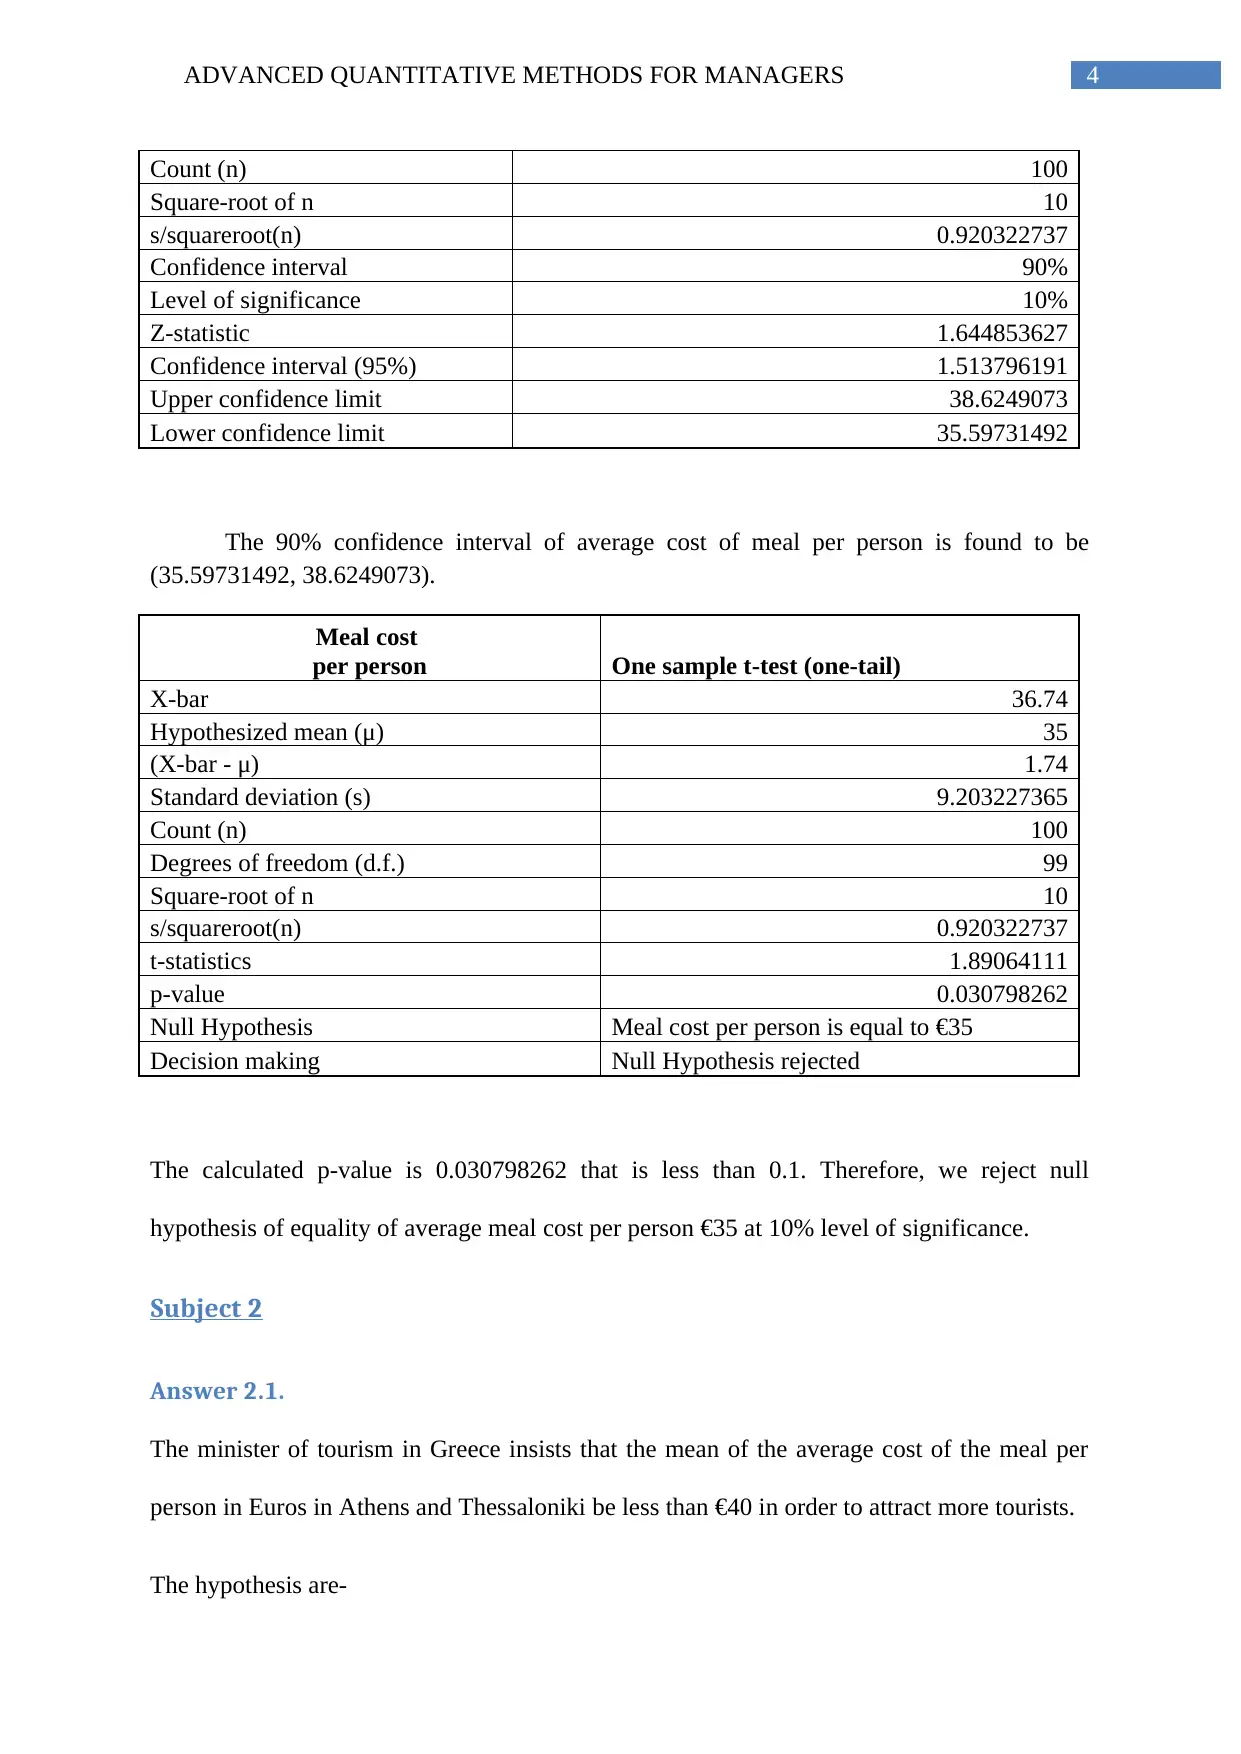
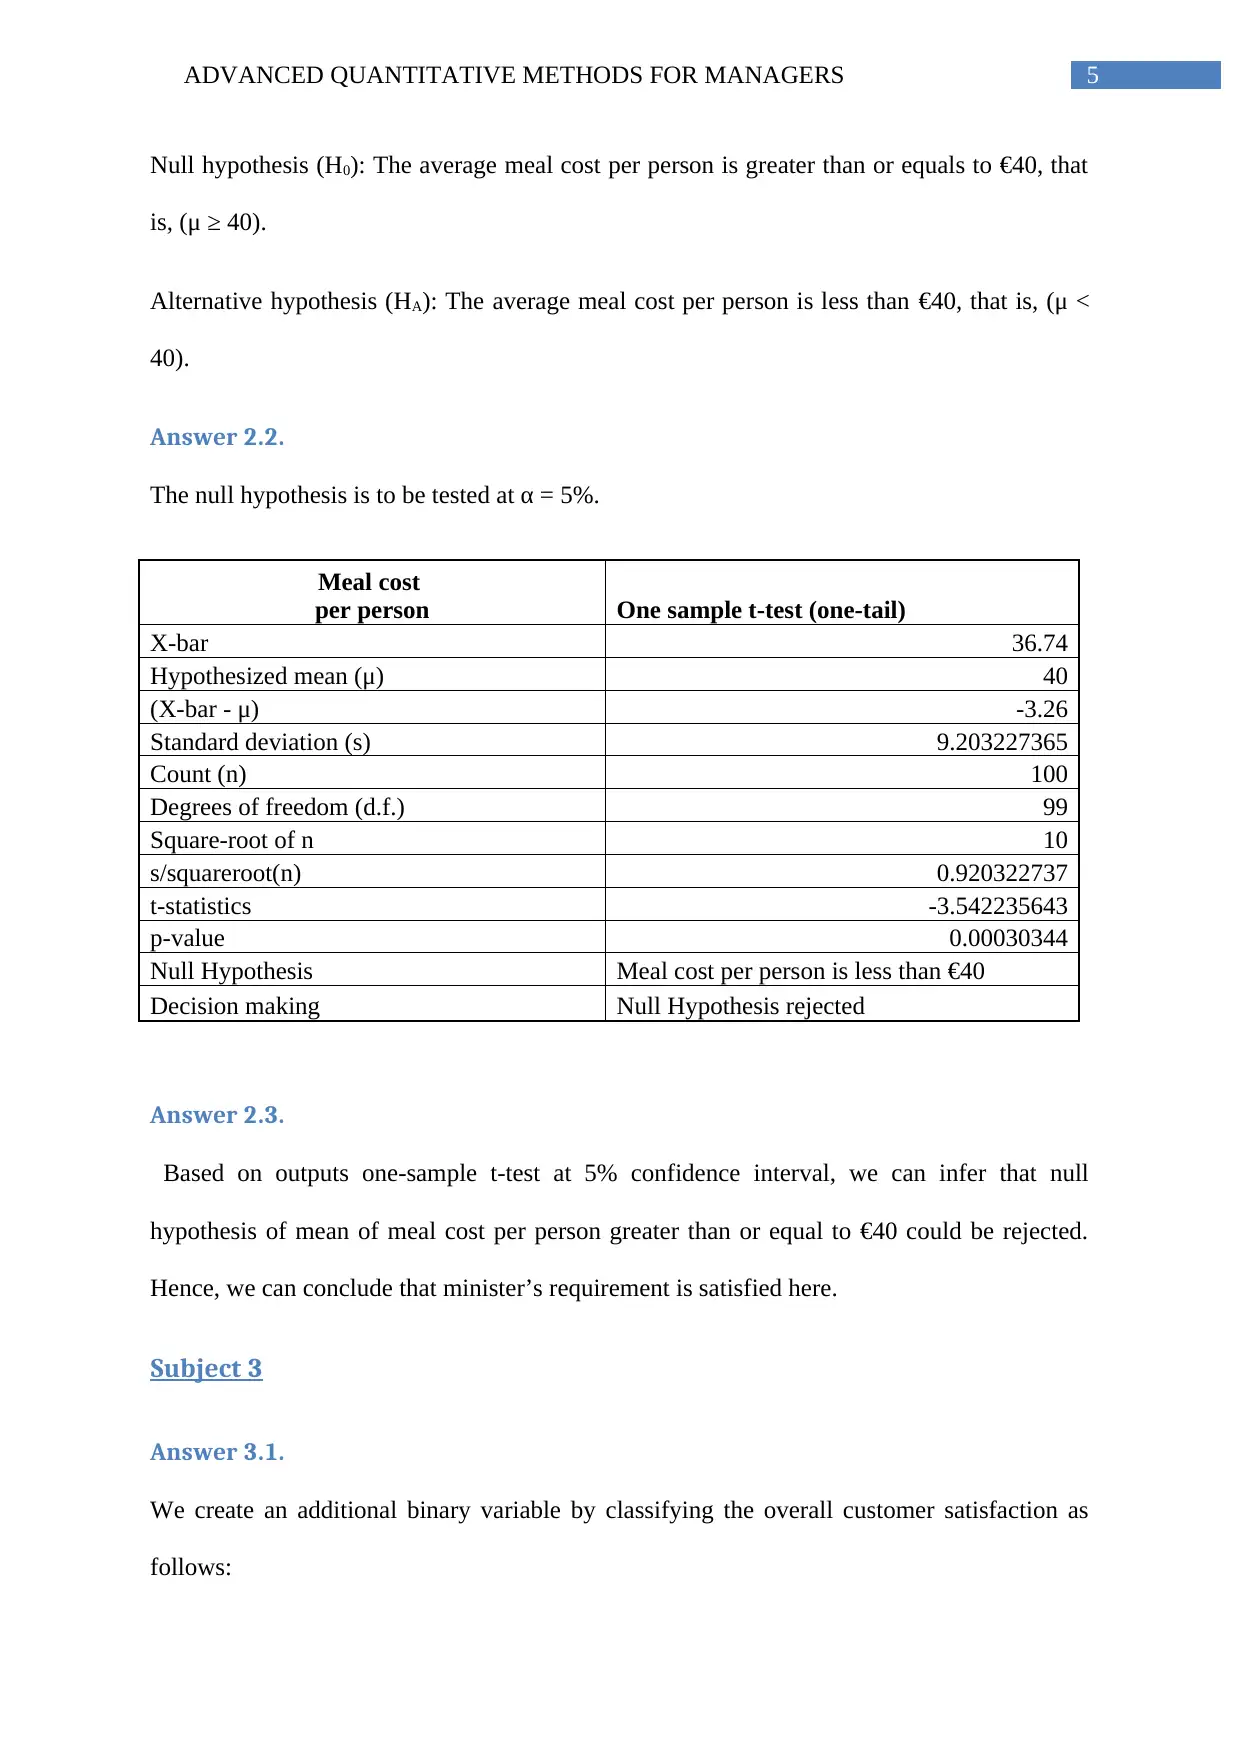
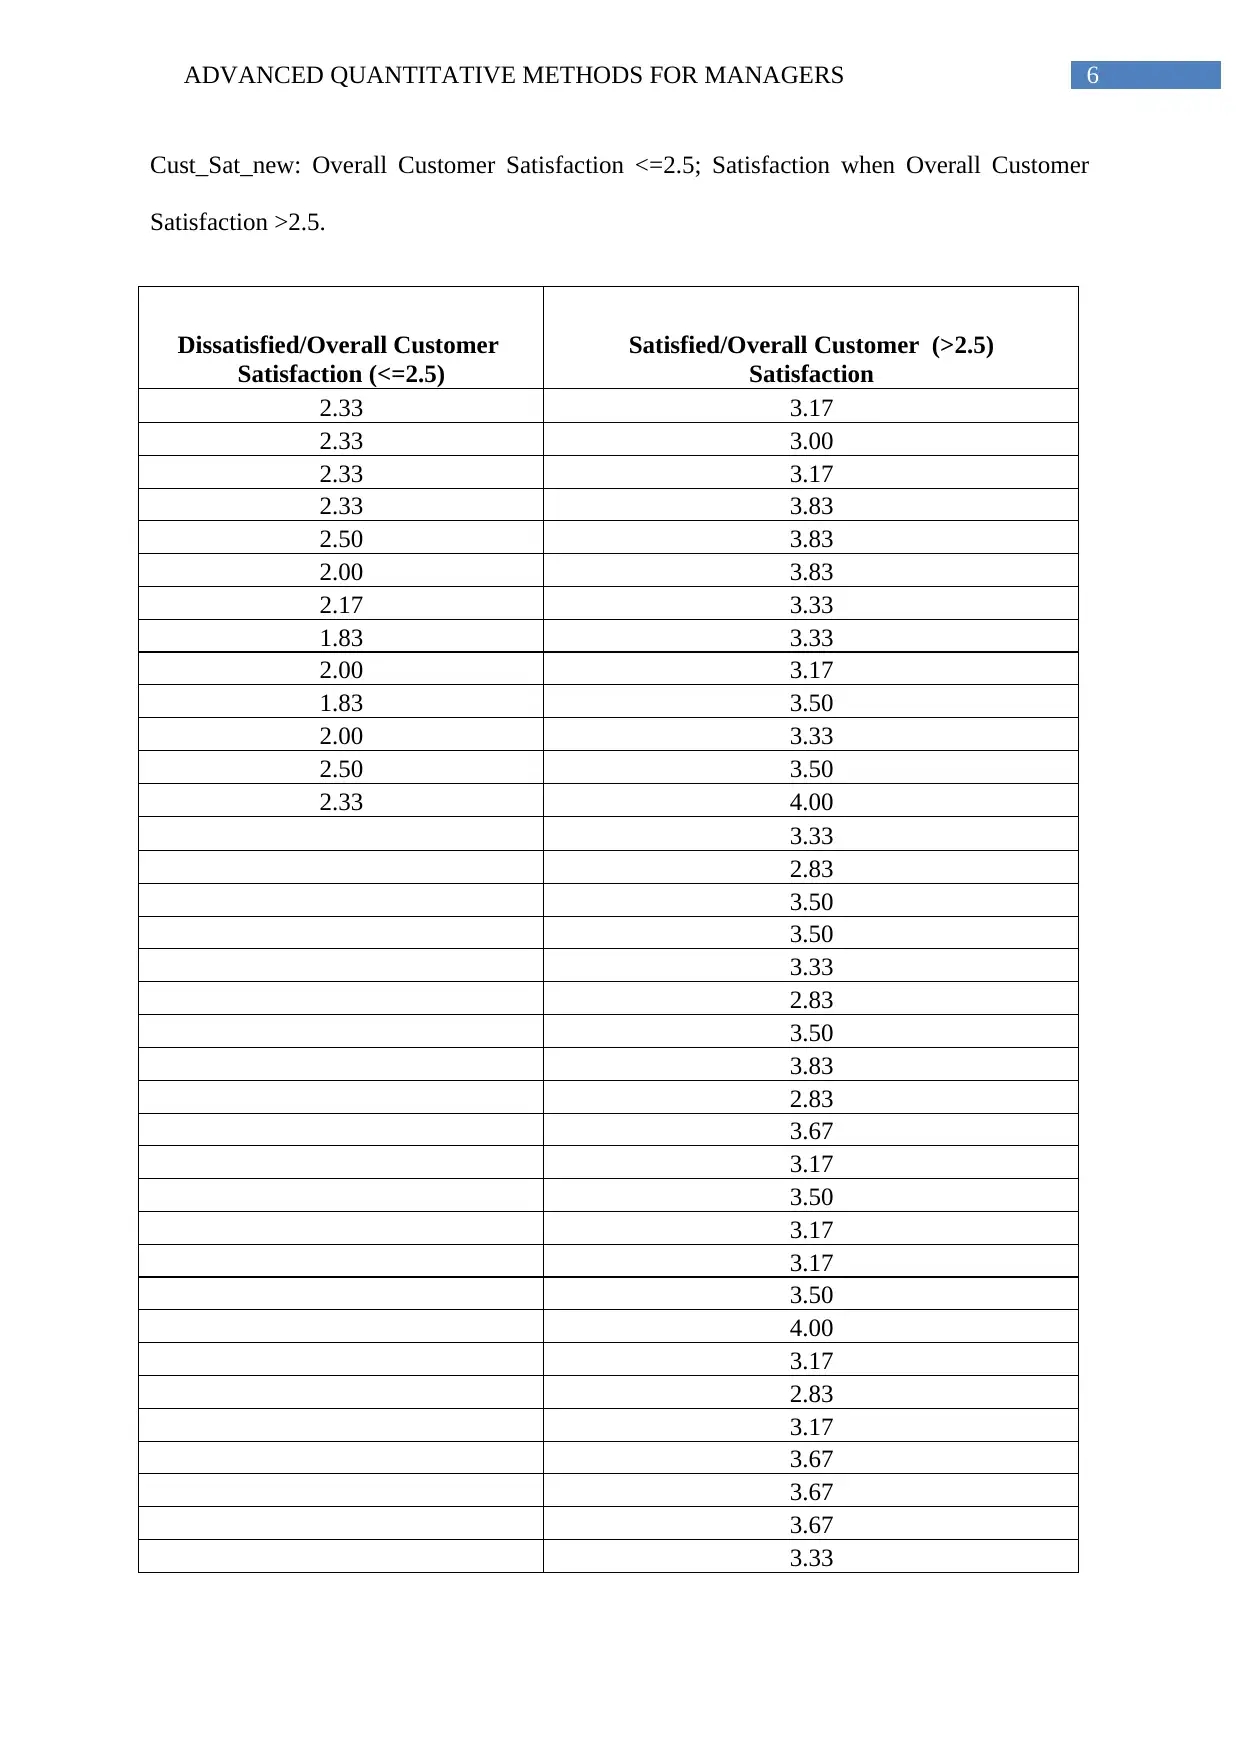
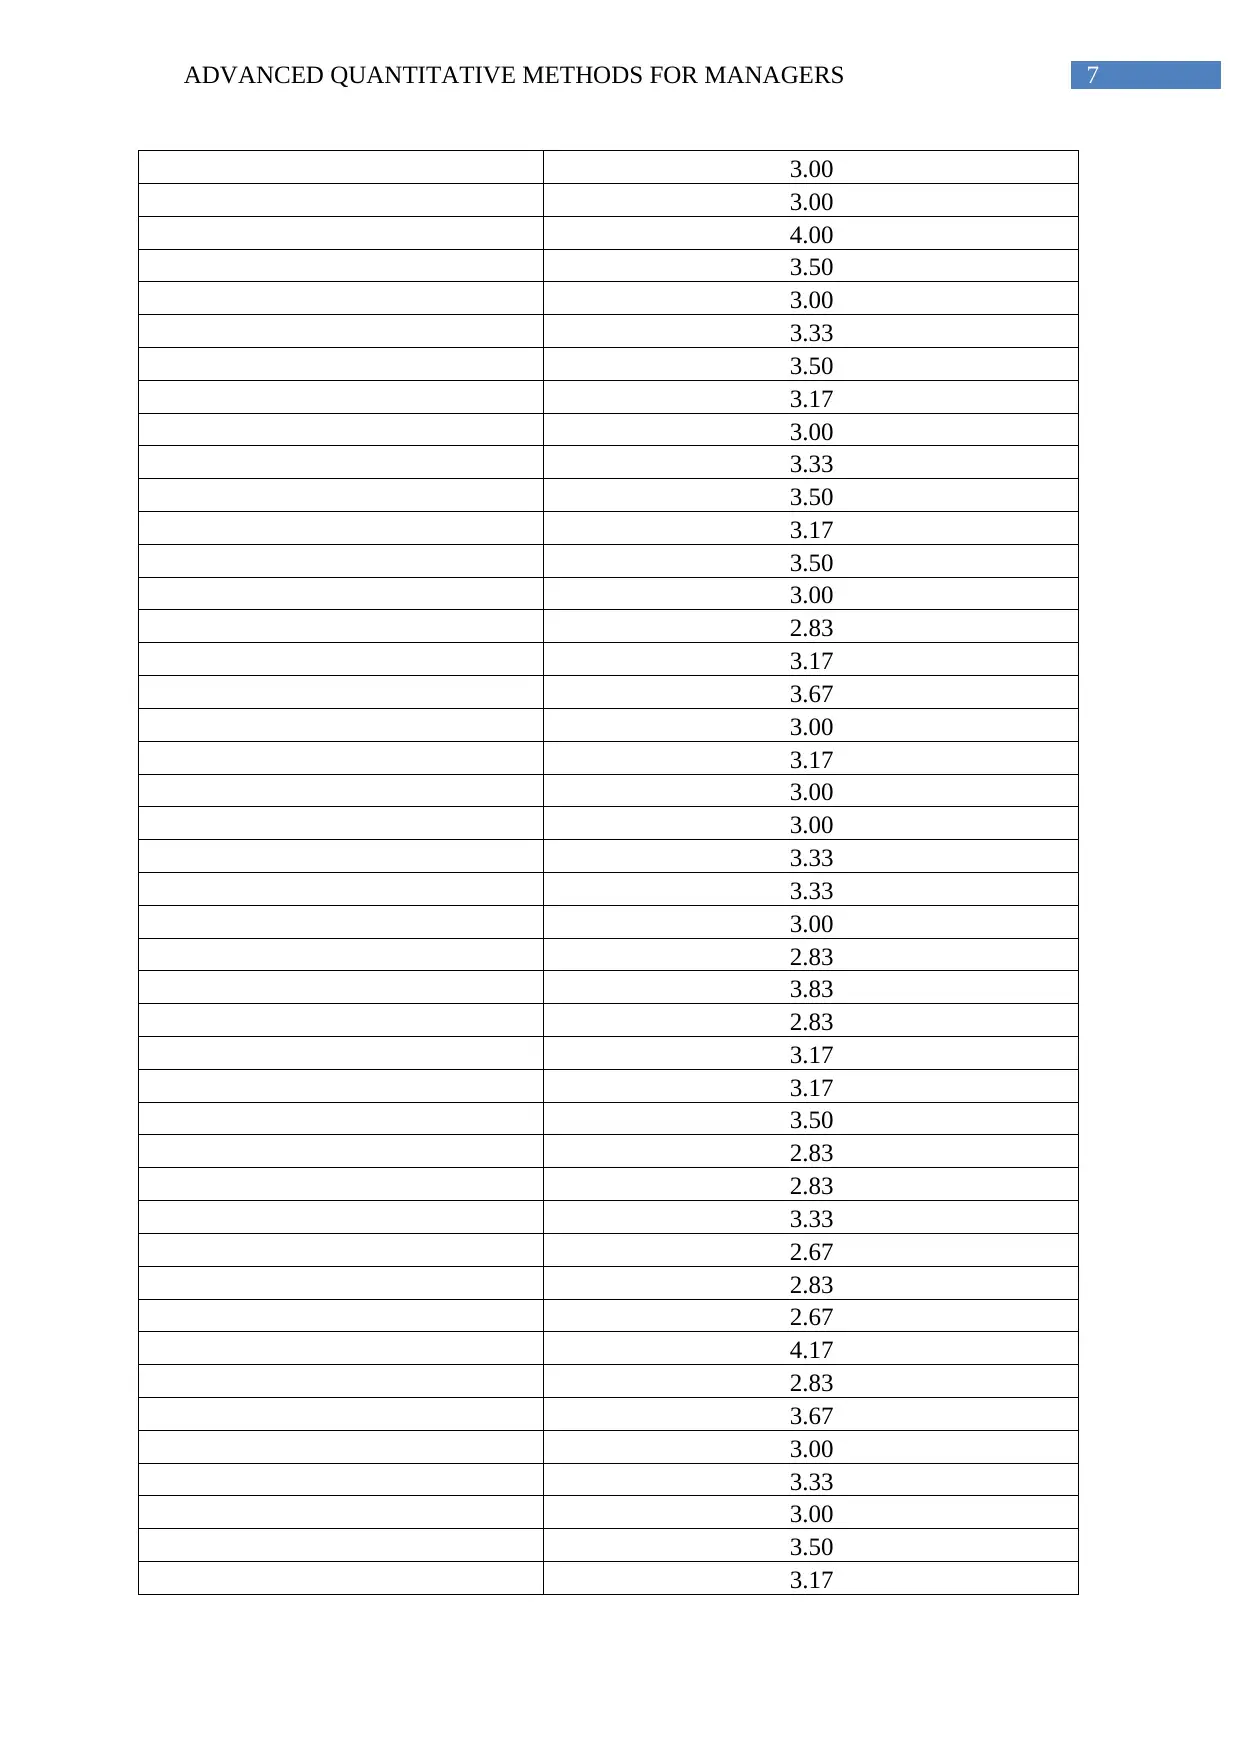
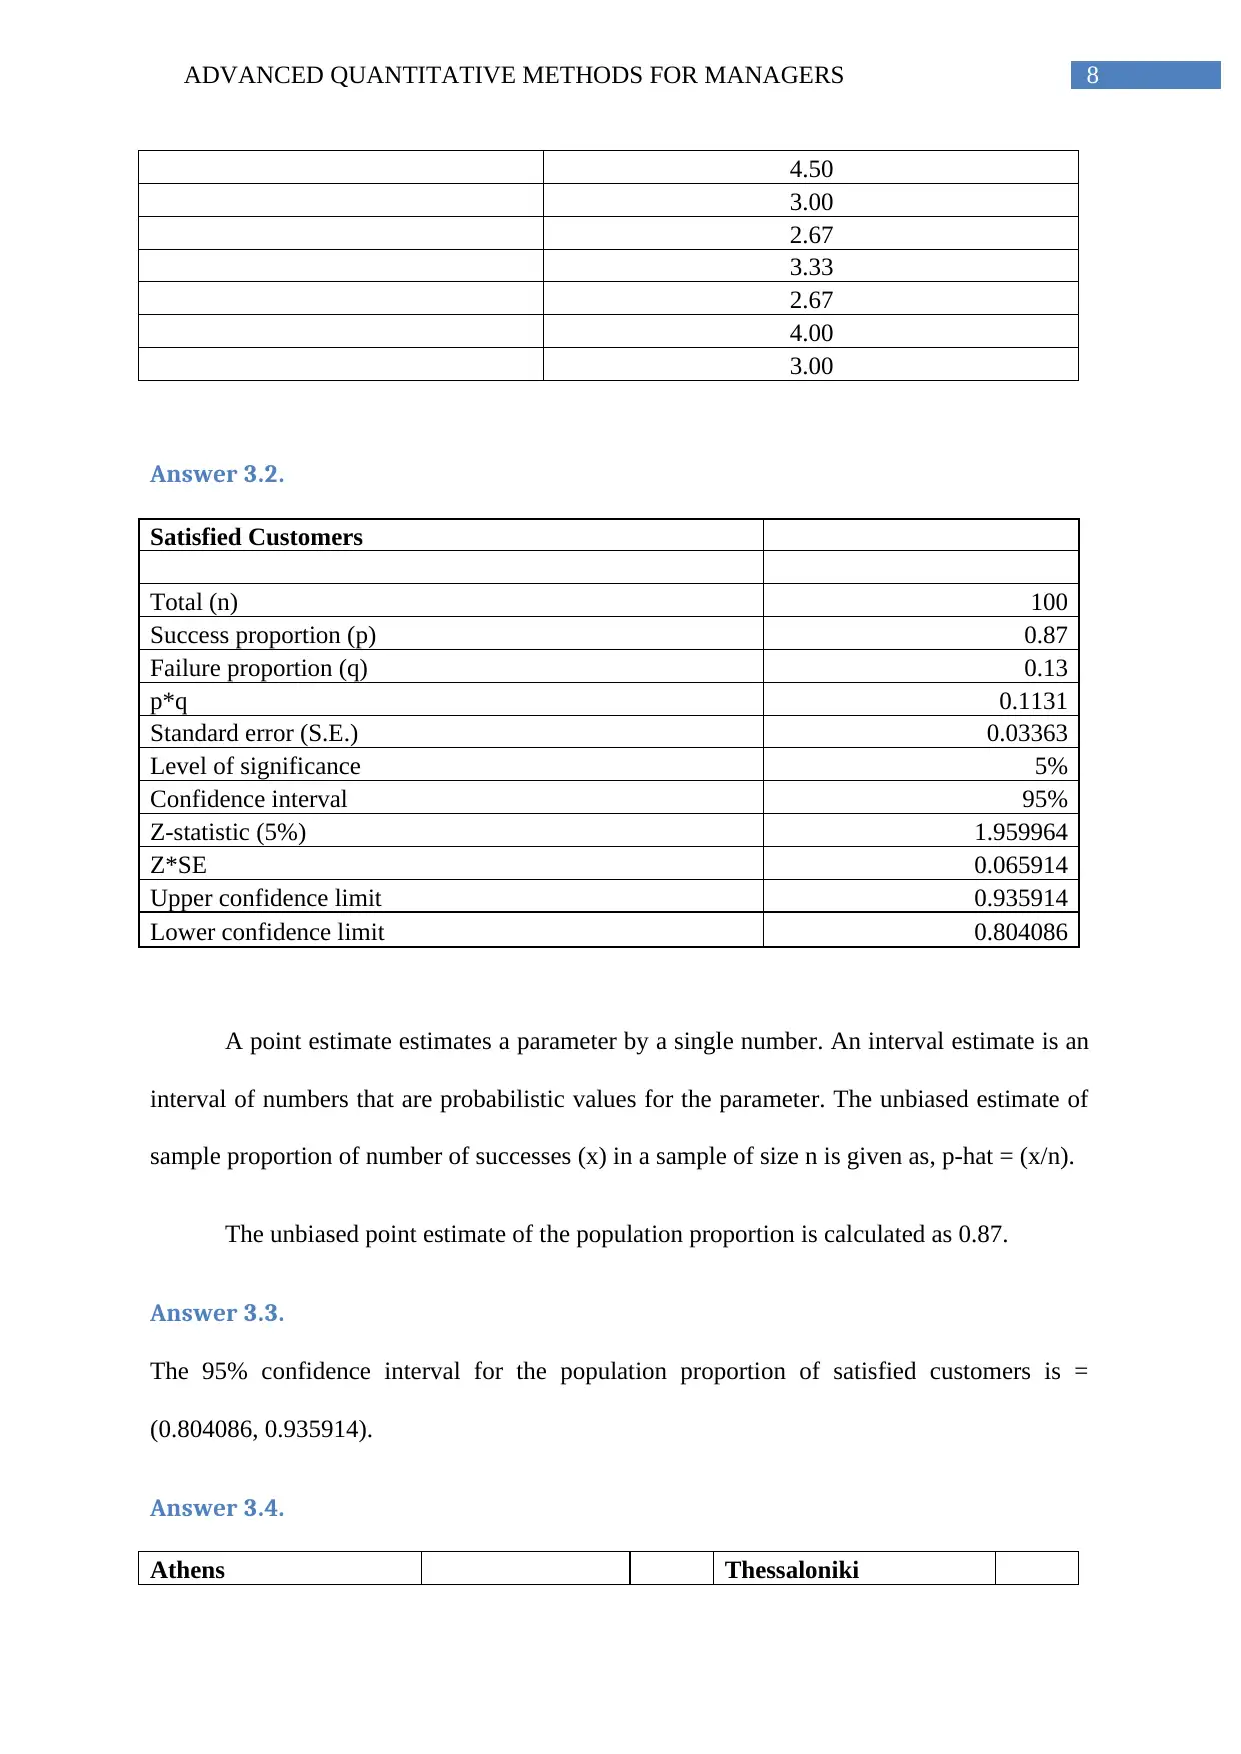
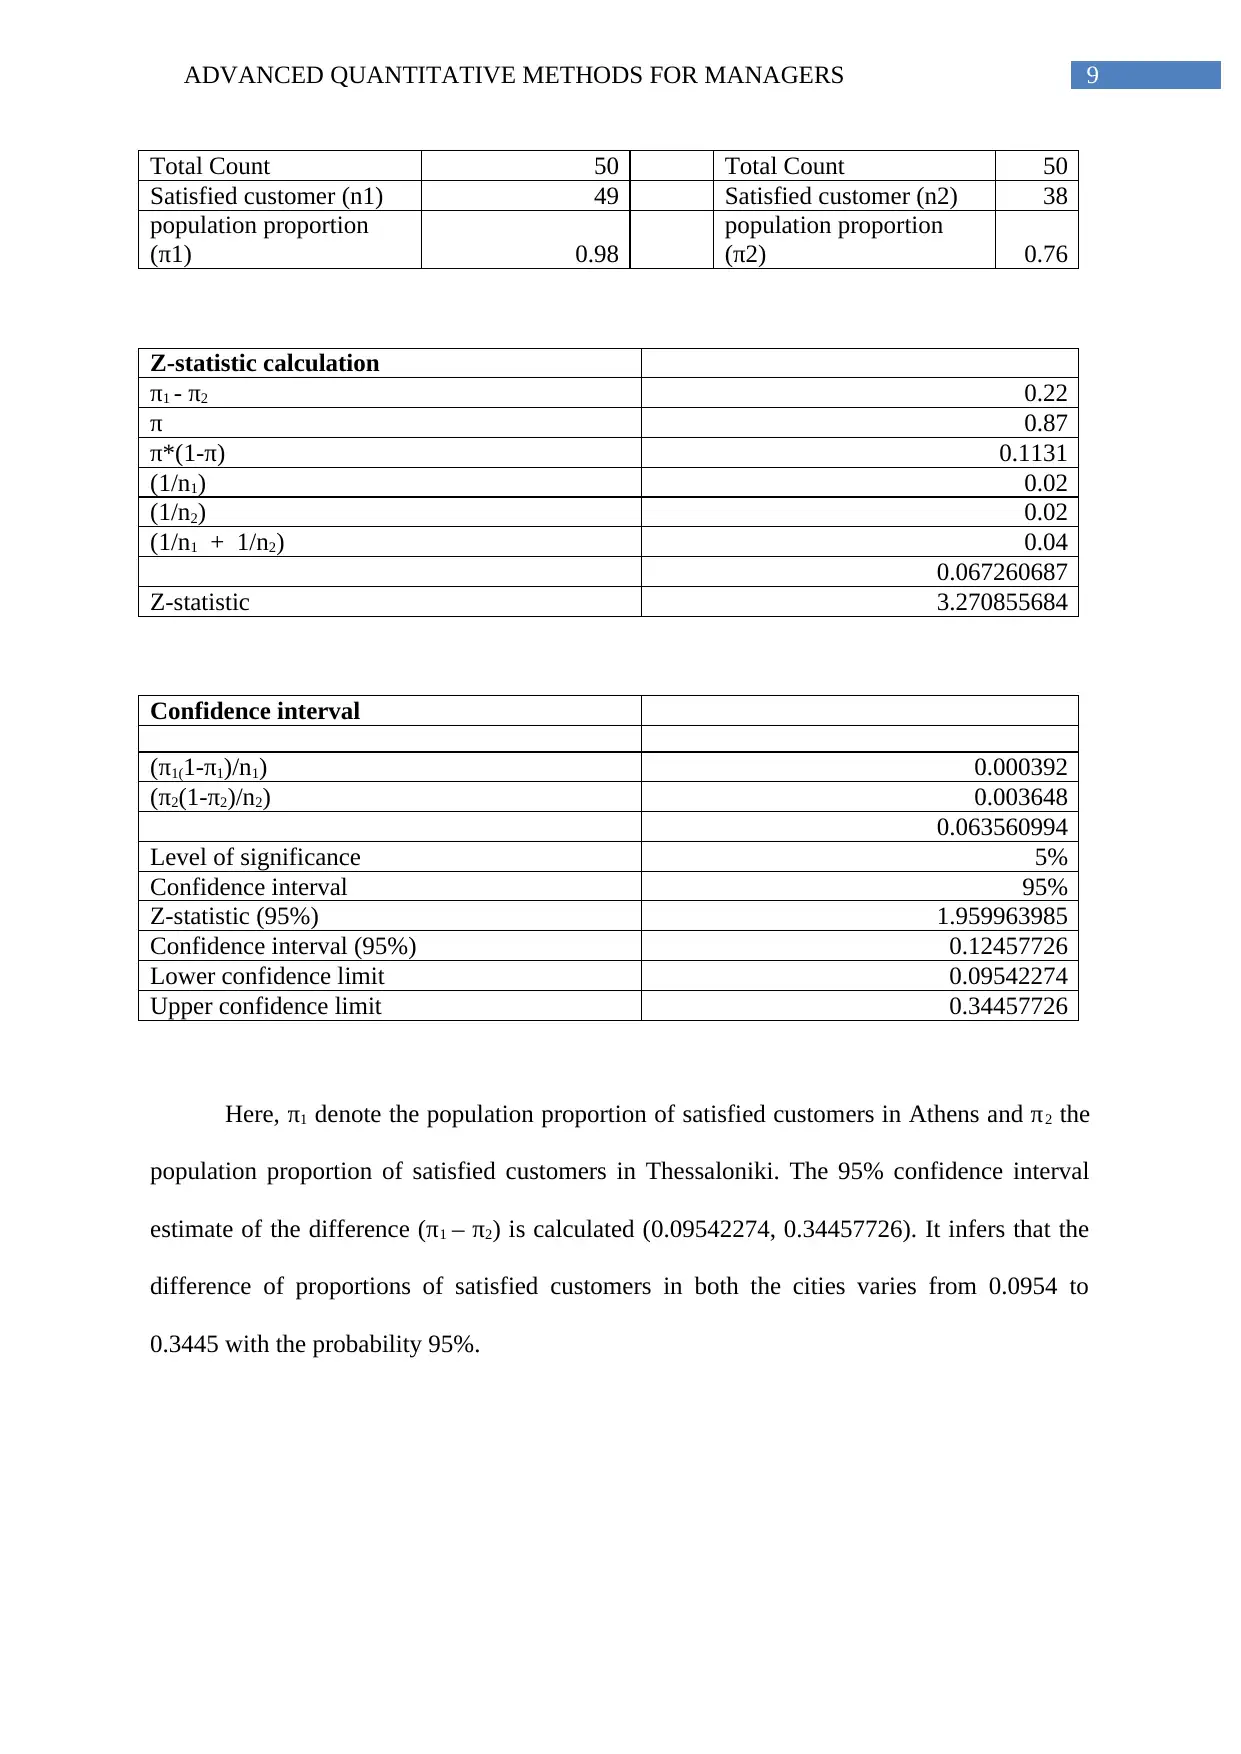
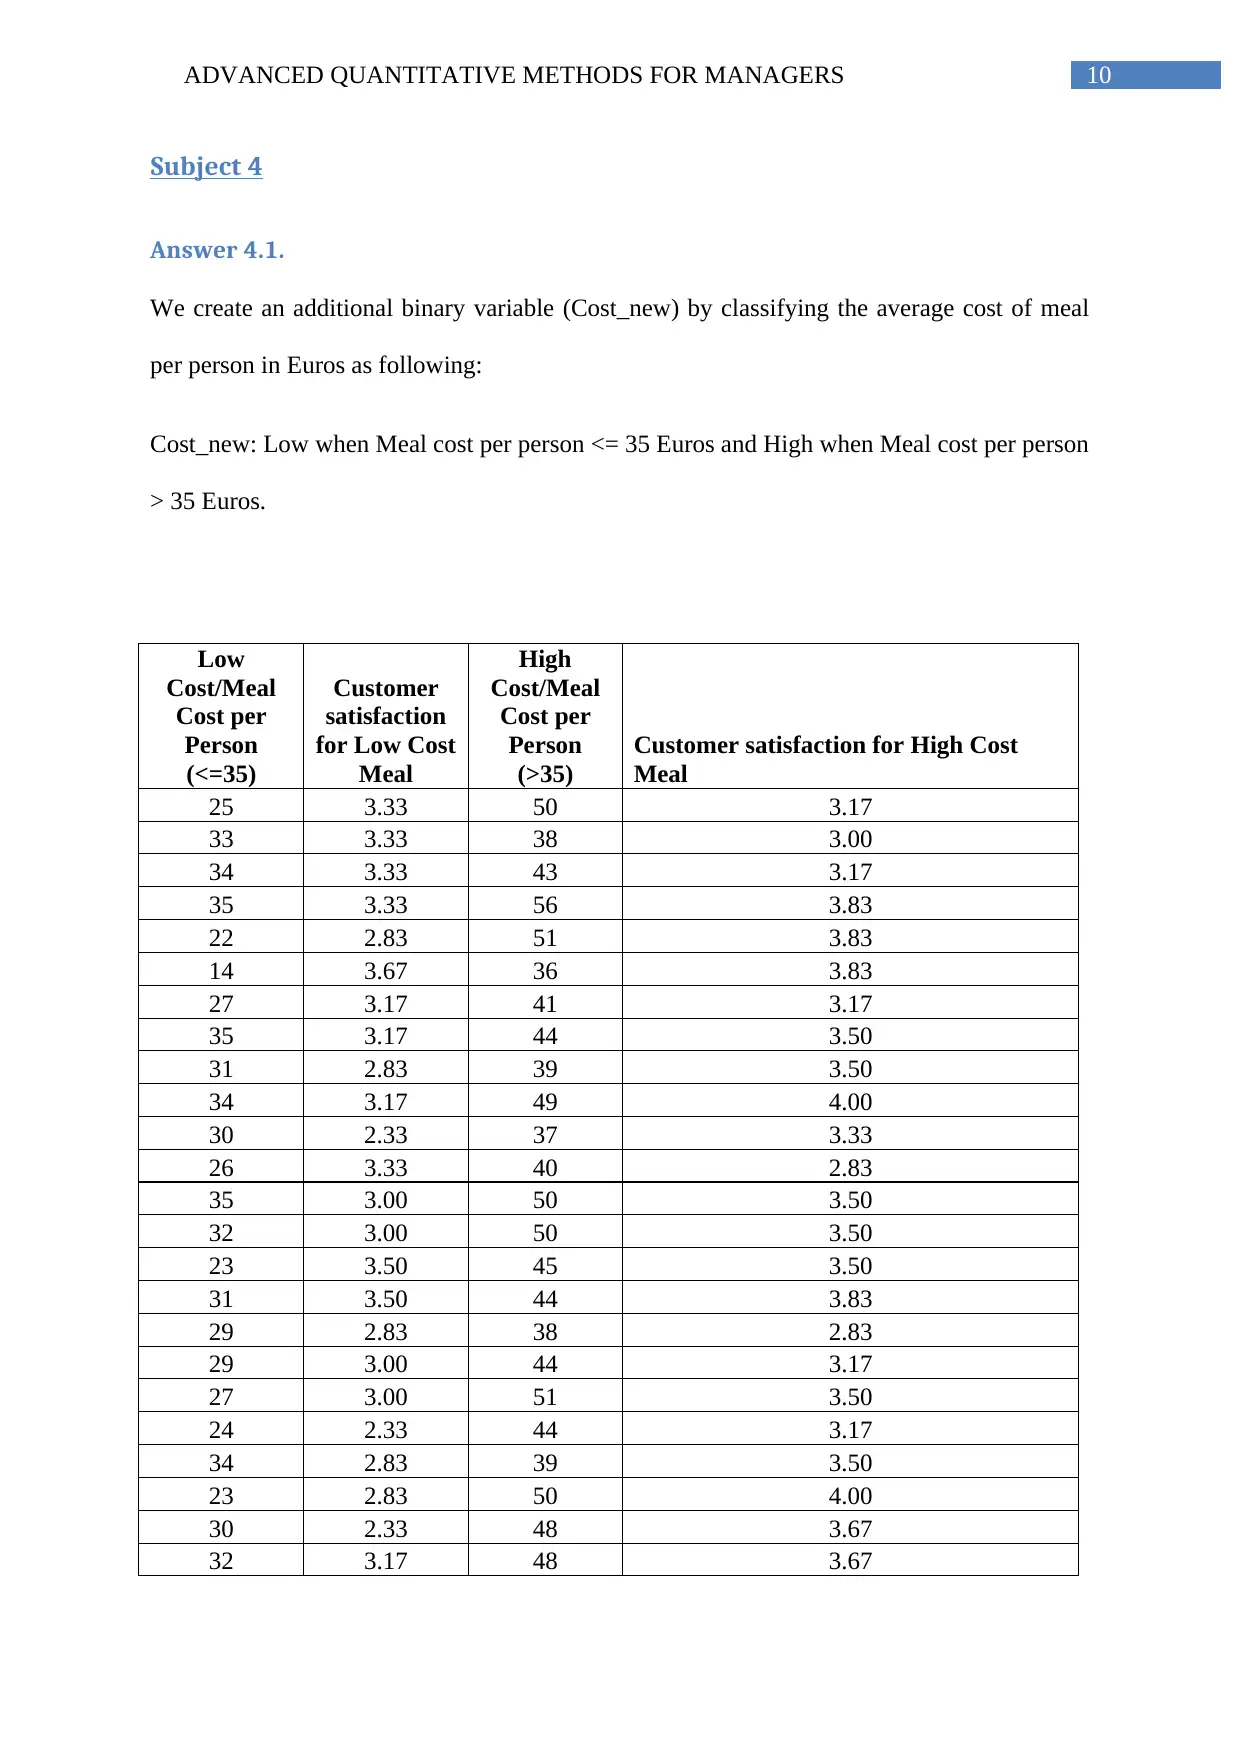
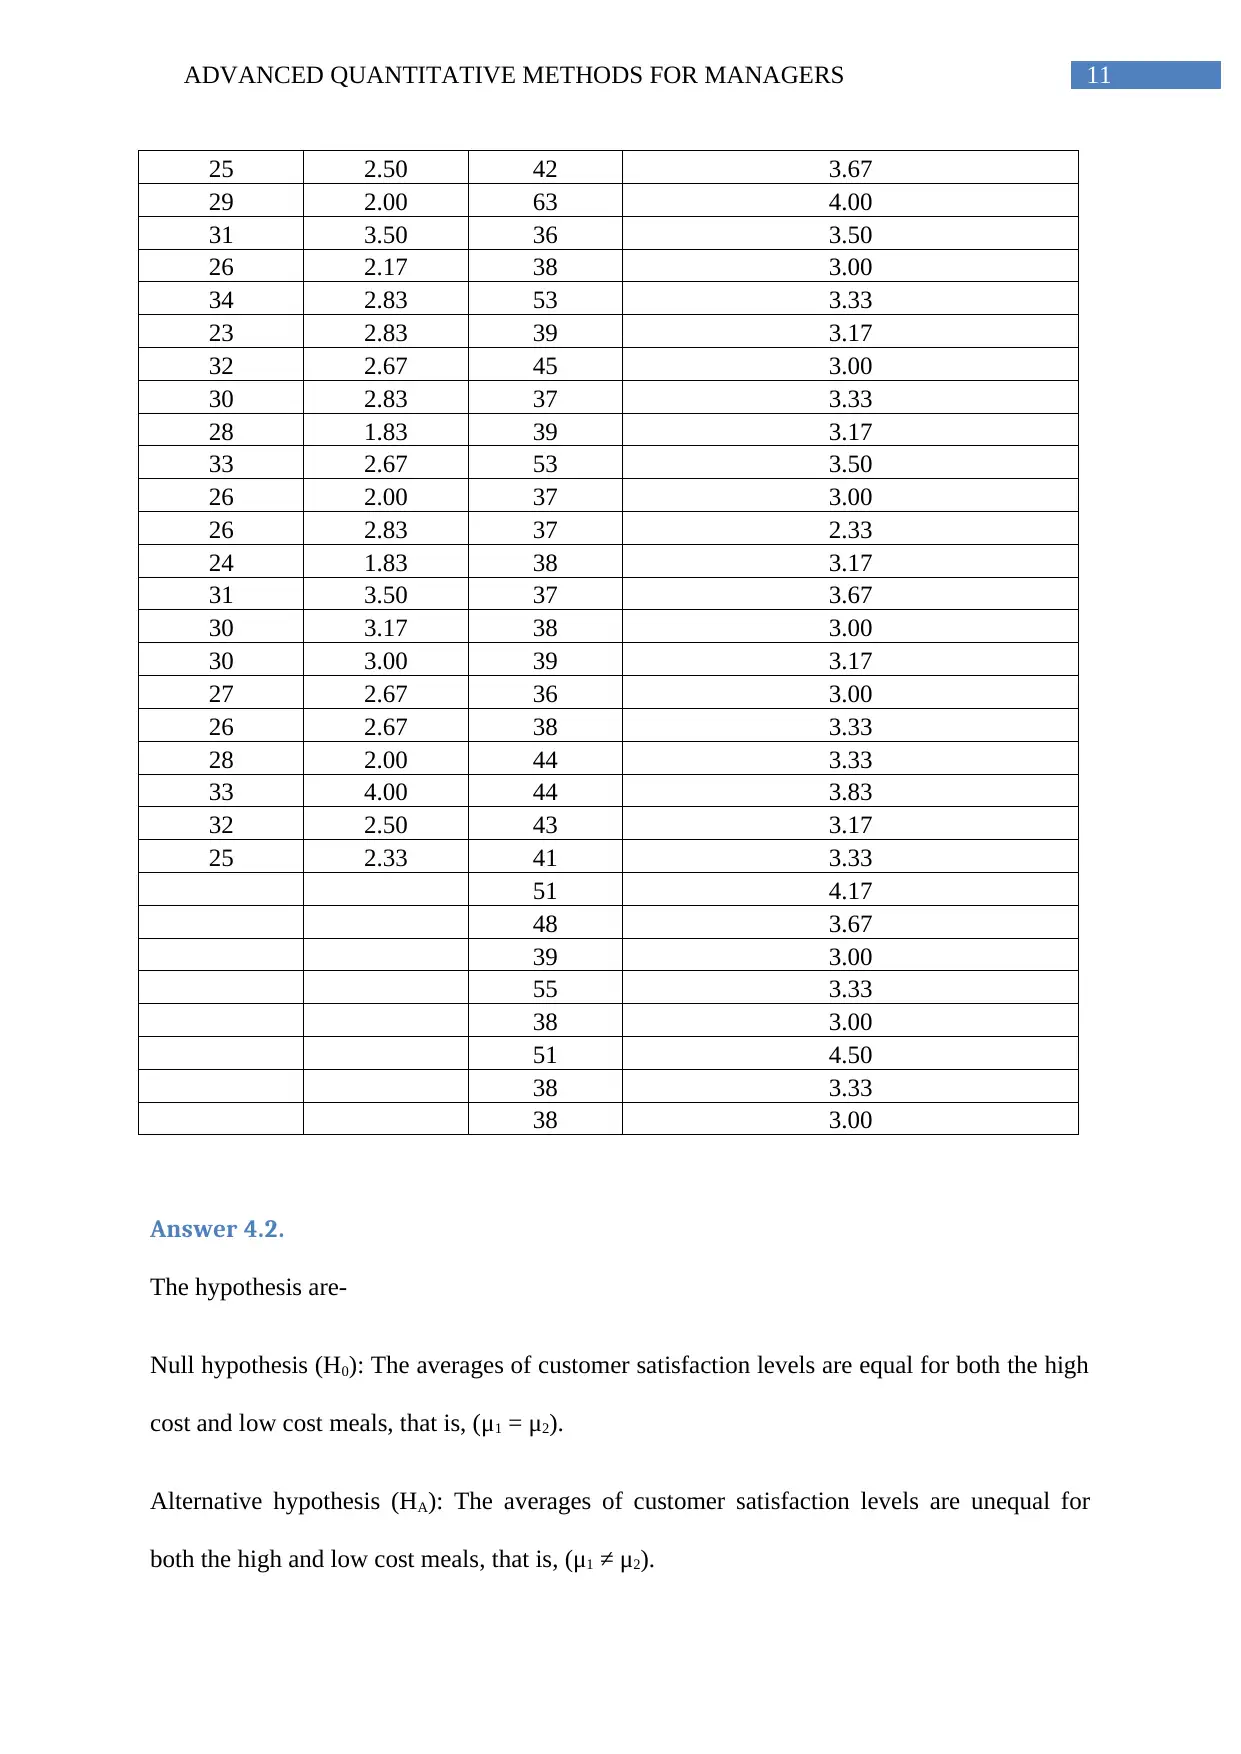
This homework assignment focuses on applying advanced quantitative methods for managerial decision-making. The assignment covers various statistical techniques, including calculating confidence intervals, conducting one-sample t-tests and z-tests, and interpreting p-values. It explores hypothesis testing to assess the average cost of meals and customer satisfaction levels. Furthermore, the assignment analyzes the difference in customer satisfaction between low-cost and high-cost meals using two-sample Z-tests. It also involves creating and interpreting confidence intervals for population proportions and comparing customer satisfaction levels between different locations. The assignment concludes with an analysis of the average meal cost per person in different cities and the implications for tourism, providing detailed calculations, interpretations, and conclusions based on the statistical analyses conducted.
tabler-icon-diamond-filled.svg

Contribute Materials

Your contribution can guide someone’s learning journey. Share your documents today.
Document Page
Running head: ADVANCED QUANTITATIVE METHODS FOR MANAGERS
Advanced Quantitative Methods for Managers
Name of the Student:
Name of the University:
Author’s note:
tabler-icon-diamond-filled.svg

Secure Best Marks with AI Grader

Need help grading? Try our AI Grader for instant feedback on your assignments.
Document Page
1ADVANCED QUANTITATIVE METHODS FOR MANAGERS
Table of Contents
Question and Answers:..............................................................................................................3
Subject 1.................................................................................................................................3
Answer 1.1.........................................................................................................................3
Answer 1.2.........................................................................................................................3
Answer 1.3.........................................................................................................................3
Answer 1.4.........................................................................................................................4
Answer 1.5.........................................................................................................................4
Subject 2.................................................................................................................................5
Answer 2.1.........................................................................................................................5
Answer 2.2.........................................................................................................................6
Answer 2.3.........................................................................................................................6
Subject 3.................................................................................................................................6
Answer 3.1.........................................................................................................................6
Answer 3.2.........................................................................................................................9
Answer 3.3.........................................................................................................................9
Answer 3.4.......................................................................................................................10
Subject 4...............................................................................................................................11
Answer 4.1.......................................................................................................................11
Answer 4.2.......................................................................................................................12
Answer 4.3.......................................................................................................................13
Answer 4.4.......................................................................................................................13
Subject 5...............................................................................................................................13
Conclusion:..............................................................................................................................14
Annotated Bibliography:..........................................................................................................15
Document Page
2ADVANCED QUANTITATIVE METHODS FOR MANAGERS
Question and Answers:
Subject 1
Answer 1.1.
The mean of the average cost of the meal per person is €36.74. The unbiased estimator of
mean of the average cost of the meal per person is €37.1111.
Answer 1.2.
Meal cost
per person
One Sample Z-test for estimating confidence
interval
Sum 3674
Mean (μ) 36.74
Unbiased estimator of mean (X-
bar) 37.11111111
Standard deviation (s) 9.203227365
(X-bar - μ) 0.371111111
Count (n) 100
Square-root of n 10
s/squareroot(n) 0.920322737
Confidence interval 95%
Level of significance 5%
Z-statistic 1.959963985
Confidence interval (95%) 1.803799418
Upper confidence limit 38.91491053
Lower confidence limit 35.30731169
The 95% confidence interval of average cost of meal per person is found to be
(35.30731169, 38.91491053).
Answer 1.3.
Meal cost
per person One sample t-test (one-tail)
X-bar 36.74
Hypothesized mean (μ) 35
(X-bar - μ) 1.74
Standard deviation (s) 9.203227365
Count (n) 100
Degrees of freedom (d.f.) 99
Document Page
3ADVANCED QUANTITATIVE METHODS FOR MANAGERS
Square-root of n 10
s/squareroot(n) 0.920322737
t-statistics 1.89064111
p-value 0.030798262
Null Hypothesis Meal cost per person is equal to €35
Decision making Null Hypothesis rejected
The assumed hypothesis is-
Null Hypothesis (H0): Average Meal cost per person is equal to €35, that is, (μ = 35).
Alternative Hypothesis (HA): Average Meal cost per person is unequal to €35, that is, (μ ≠
35).
The t-statistic (1.89064111) is calculated as:
t = (sample mean – hypothesized mean)/ SE mean.
The calculated p-value is 0.030798262 that is less than 0.05. Therefore, we reject null
hypothesis of equality of average meal cost per person €35 at 5% level of significance.
Answer 1.4.
The population of the average cost of the mean per person in Euros is not normally
distributed. We use a normality test for determining the validity of assumption of normality.
The p-value less than 0.05 indicate that mean cost per person in Euros is not normally
distributed.
Answer 1.5.
Meal cost
per person
One sample Z-test for estimating confidence
interval
Sum 3674
Mean (μ) 36.74
Unbiased estimator of mean (X-
bar) 37.11111111
Standard deviation (s) 9.203227365
tabler-icon-diamond-filled.svg

Secure Best Marks with AI Grader

Need help grading? Try our AI Grader for instant feedback on your assignments.
Document Page
4ADVANCED QUANTITATIVE METHODS FOR MANAGERS
Count (n) 100
Square-root of n 10
s/squareroot(n) 0.920322737
Confidence interval 90%
Level of significance 10%
Z-statistic 1.644853627
Confidence interval (95%) 1.513796191
Upper confidence limit 38.6249073
Lower confidence limit 35.59731492
The 90% confidence interval of average cost of meal per person is found to be
(35.59731492, 38.6249073).
Meal cost
per person One sample t-test (one-tail)
X-bar 36.74
Hypothesized mean (μ) 35
(X-bar - μ) 1.74
Standard deviation (s) 9.203227365
Count (n) 100
Degrees of freedom (d.f.) 99
Square-root of n 10
s/squareroot(n) 0.920322737
t-statistics 1.89064111
p-value 0.030798262
Null Hypothesis Meal cost per person is equal to €35
Decision making Null Hypothesis rejected
The calculated p-value is 0.030798262 that is less than 0.1. Therefore, we reject null
hypothesis of equality of average meal cost per person €35 at 10% level of significance.
Subject 2
Answer 2.1.
The minister of tourism in Greece insists that the mean of the average cost of the meal per
person in Euros in Athens and Thessaloniki be less than €40 in order to attract more tourists.
The hypothesis are-
Document Page
5ADVANCED QUANTITATIVE METHODS FOR MANAGERS
Null hypothesis (H0): The average meal cost per person is greater than or equals to €40, that
is, (μ ≥ 40).
Alternative hypothesis (HA): The average meal cost per person is less than €40, that is, (μ <
40).
Answer 2.2.
The null hypothesis is to be tested at α = 5%.
Meal cost
per person One sample t-test (one-tail)
X-bar 36.74
Hypothesized mean (μ) 40
(X-bar - μ) -3.26
Standard deviation (s) 9.203227365
Count (n) 100
Degrees of freedom (d.f.) 99
Square-root of n 10
s/squareroot(n) 0.920322737
t-statistics -3.542235643
p-value 0.00030344
Null Hypothesis Meal cost per person is less than €40
Decision making Null Hypothesis rejected
Answer 2.3.
Based on outputs one-sample t-test at 5% confidence interval, we can infer that null
hypothesis of mean of meal cost per person greater than or equal to €40 could be rejected.
Hence, we can conclude that minister’s requirement is satisfied here.
Subject 3
Answer 3.1.
We create an additional binary variable by classifying the overall customer satisfaction as
follows:
Document Page
6ADVANCED QUANTITATIVE METHODS FOR MANAGERS
Cust_Sat_new: Overall Customer Satisfaction <=2.5; Satisfaction when Overall Customer
Satisfaction >2.5.
Dissatisfied/Overall Customer
Satisfaction (<=2.5)
Satisfied/Overall Customer (>2.5)
Satisfaction
2.33 3.17
2.33 3.00
2.33 3.17
2.33 3.83
2.50 3.83
2.00 3.83
2.17 3.33
1.83 3.33
2.00 3.17
1.83 3.50
2.00 3.33
2.50 3.50
2.33 4.00
3.33
2.83
3.50
3.50
3.33
2.83
3.50
3.83
2.83
3.67
3.17
3.50
3.17
3.17
3.50
4.00
3.17
2.83
3.17
3.67
3.67
3.67
3.33
tabler-icon-diamond-filled.svg

Paraphrase This Document

Need a fresh take? Get an instant paraphrase of this document with our AI Paraphraser
Document Page
7ADVANCED QUANTITATIVE METHODS FOR MANAGERS
3.00
3.00
4.00
3.50
3.00
3.33
3.50
3.17
3.00
3.33
3.50
3.17
3.50
3.00
2.83
3.17
3.67
3.00
3.17
3.00
3.00
3.33
3.33
3.00
2.83
3.83
2.83
3.17
3.17
3.50
2.83
2.83
3.33
2.67
2.83
2.67
4.17
2.83
3.67
3.00
3.33
3.00
3.50
3.17
Document Page
8ADVANCED QUANTITATIVE METHODS FOR MANAGERS
4.50
3.00
2.67
3.33
2.67
4.00
3.00
Answer 3.2.
Satisfied Customers
Total (n) 100
Success proportion (p) 0.87
Failure proportion (q) 0.13
p*q 0.1131
Standard error (S.E.) 0.03363
Level of significance 5%
Confidence interval 95%
Z-statistic (5%) 1.959964
Z*SE 0.065914
Upper confidence limit 0.935914
Lower confidence limit 0.804086
A point estimate estimates a parameter by a single number. An interval estimate is an
interval of numbers that are probabilistic values for the parameter. The unbiased estimate of
sample proportion of number of successes (x) in a sample of size n is given as, p-hat = (x/n).
The unbiased point estimate of the population proportion is calculated as 0.87.
Answer 3.3.
The 95% confidence interval for the population proportion of satisfied customers is =
(0.804086, 0.935914).
Answer 3.4.
Athens Thessaloniki
Document Page
9ADVANCED QUANTITATIVE METHODS FOR MANAGERS
Total Count 50 Total Count 50
Satisfied customer (n1) 49 Satisfied customer (n2) 38
population proportion
(π1) 0.98
population proportion
(π2) 0.76
Z-statistic calculation
π1 - π2 0.22
π 0.87
π*(1-π) 0.1131
(1/n1) 0.02
(1/n2) 0.02
(1/n1 + 1/n2) 0.04
0.067260687
Z-statistic 3.270855684
Confidence interval
1(1-π1)/n1) 0.000392
2(1-π2)/n2) 0.003648
0.063560994
Level of significance 5%
Confidence interval 95%
Z-statistic (95%) 1.959963985
Confidence interval (95%) 0.12457726
Lower confidence limit 0.09542274
Upper confidence limit 0.34457726
Here, π1 denote the population proportion of satisfied customers in Athens and π2 the
population proportion of satisfied customers in Thessaloniki. The 95% confidence interval
estimate of the difference (π1 – π2) is calculated (0.09542274, 0.34457726). It infers that the
difference of proportions of satisfied customers in both the cities varies from 0.0954 to
0.3445 with the probability 95%.
tabler-icon-diamond-filled.svg

Secure Best Marks with AI Grader

Need help grading? Try our AI Grader for instant feedback on your assignments.
Document Page
10ADVANCED QUANTITATIVE METHODS FOR MANAGERS
Subject 4
Answer 4.1.
We create an additional binary variable (Cost_new) by classifying the average cost of meal
per person in Euros as following:
Cost_new: Low when Meal cost per person <= 35 Euros and High when Meal cost per person
> 35 Euros.
Low
Cost/Meal
Cost per
Person
(<=35)
Customer
satisfaction
for Low Cost
Meal
High
Cost/Meal
Cost per
Person
(>35)
Customer satisfaction for High Cost
Meal
25 3.33 50 3.17
33 3.33 38 3.00
34 3.33 43 3.17
35 3.33 56 3.83
22 2.83 51 3.83
14 3.67 36 3.83
27 3.17 41 3.17
35 3.17 44 3.50
31 2.83 39 3.50
34 3.17 49 4.00
30 2.33 37 3.33
26 3.33 40 2.83
35 3.00 50 3.50
32 3.00 50 3.50
23 3.50 45 3.50
31 3.50 44 3.83
29 2.83 38 2.83
29 3.00 44 3.17
27 3.00 51 3.50
24 2.33 44 3.17
34 2.83 39 3.50
23 2.83 50 4.00
30 2.33 48 3.67
32 3.17 48 3.67
Document Page
11ADVANCED QUANTITATIVE METHODS FOR MANAGERS
25 2.50 42 3.67
29 2.00 63 4.00
31 3.50 36 3.50
26 2.17 38 3.00
34 2.83 53 3.33
23 2.83 39 3.17
32 2.67 45 3.00
30 2.83 37 3.33
28 1.83 39 3.17
33 2.67 53 3.50
26 2.00 37 3.00
26 2.83 37 2.33
24 1.83 38 3.17
31 3.50 37 3.67
30 3.17 38 3.00
30 3.00 39 3.17
27 2.67 36 3.00
26 2.67 38 3.33
28 2.00 44 3.33
33 4.00 44 3.83
32 2.50 43 3.17
25 2.33 41 3.33
51 4.17
48 3.67
39 3.00
55 3.33
38 3.00
51 4.50
38 3.33
38 3.00
Answer 4.2.
The hypothesis are-
Null hypothesis (H0): The averages of customer satisfaction levels are equal for both the high
cost and low cost meals, that is, (μ1 = μ2).
Alternative hypothesis (HA): The averages of customer satisfaction levels are unequal for
both the high and low cost meals, that is, (μ1 ≠ μ2).
Document Page
12ADVANCED QUANTITATIVE METHODS FOR MANAGERS
Answer 4.3.
Z-Test: Two Sample for Means
Customer satisfaction for Low
Cost Meal
Customer satisfaction for High
Cost Meal
Mean 2.858405797 3.388950617
Known Variance 0.26 0.15
Observations 46 54
Hypothesized Mean
Difference 0
z -5.778425733
P(Z<=z) one-tail 3.77014E-09
z Critical one-tail 2.326347874
P(Z<=z) two-tail 7.54028E-09
z Critical two-tail 2.575829304
Answer 4.4.
We executed two samples Z-test for equality of means of customer satisfaction levels at 1%
level of significance. The sample sizes are not equal for satisfaction levels of both types of
cost prices of meals. Here, variances are also known for both data columns. Therefore, we
applied two samples Z-test rather than two samples paired t-test.
Our calculated Z-statistic is (-5.778425733). For one tail z-test, the calculated p-value
is 3.77014E-09 (0.0). It is less than 0.01 (α=1%). Therefore, the null hypothesis is rejected at
1% level of significance.
Hence, it could be concluded that the assertion of equality of averages of satisfaction
levels for both types of meals (low cost and high cost) is false in the 99% confidence interval.
Subject 5
μ1 3.35
μ2 2.94
μ1 - μ2 0.41
(s12)/n1 0.002411387
(s22)/n2 0.006751927
tabler-icon-diamond-filled.svg

Paraphrase This Document

Need a fresh take? Get an instant paraphrase of this document with our AI Paraphraser
Document Page
13ADVANCED QUANTITATIVE METHODS FOR MANAGERS
0.009163314
standard error 0.095725202
Z-statistic 4.281004267
Confidence interval 95%
Upper confidence limit 0.597421397
Lower confidence limit 0.222178603
p-value 9.30259E-06
The means of average cost of the meal per person in Euros (variable Meal cost per
Person) in Athens and in Thessaloniki. The 95% confidence interval of the difference of two
means of the average cost of meals in Euros is (0.222178603, 0.597421397). Hence, there is
95% probability of being the difference of average cost of meals in Euros in the interval
(0.222178603, 0.597421397).
Conclusion:
From the previous five tasks, it could be concluded that average cost of the meal per
person is not equal to €35. The insistence of minister of tourism in Greece about average
meal cost per person in Euros is found to be true. The equality of satisfaction level for high
and low costs of meals is absent.
Document Page
14ADVANCED QUANTITATIVE METHODS FOR MANAGERS
Annotated Bibliography:
Chen, Zhongxue, and Saralees Nadarajah. "On the optimally weighted z-test for combining
probabilities from independent studies." Computational Statistics & Data Analysis 70 (2014):
387-394.
De Winter, Joost CF. "Using the Student's t-test with extremely small sample
sizes." Practical Assessment, Research & Evaluation 18, no. 10 (2013).
Jin, Fulai, Yan Li, Jesse R. Dixon, Siddarth Selvaraj, Zhen Ye, Ah Young Lee, Chia-An Yen,
Anthony D. Schmitt, Celso A. Espinoza, and Bing Ren. "A high-resolution map of the three-
dimensional chromatin interactome in human cells." Nature 503, no. 7475 (2013): 290-294.
chevron_up_icon
1 out of 15
circle_padding
hide_on_mobile
zoom_out_icon
logo.png

Your All-in-One AI-Powered Toolkit for Academic Success.

Available 24*7 on WhatsApp / Email

[object Object]