CS5308 Magnetic Island Water Recycling Plant Training Manual
VerifiedAdded on 2022/10/04
|14
|3250
|26
Report
AI Summary
This report presents a comprehensive training manual for new operators of a Magnetic Island Water Recycling (MIWR) membrane bioreactor (MBR) plant. The manual includes a detailed process description, a process flow diagram (PFD), and an analysis of potential causes and recommended actions for various effluent analysis scenarios, such as increasing nitrogen, phosphorus, and ammonia levels. The report also addresses plant performance parameters, and discusses scum removal system upgrades. It covers wastewater collection, odor control, screening, primary, secondary, and tertiary treatments, biosolid handling, disinfection, and sludge treatment processes, and provides an overview of the plant's operation, performance, and potential areas for improvement, providing a solid foundation for new operators.
A TRAINING MANUAL FOR NEW TREATMENT PLANT 1
A Training Manual for New Treatment Plant
Student Name
Institution
A Training Manual for New Treatment Plant
Student Name
Institution
Paraphrase This Document
Need a fresh take? Get an instant paraphrase of this document with our AI Paraphraser
A TRAINING MANUAL FOR NEW TREATMENT PLANT 2 A process description
Following the citi water specification contractor, a modification of both the SCADA, control,
and plc is to be conducted. An Allen Bradley plc is located at the MCC room, and it is
purposefully used to control the membrane plant, the main plant, on the other hand, is situated at
the adjacent control room. Additionally, two modems are present the first used for alarm paging
up to the duty operator, while the other one utilized for enabling dialing into the plant SCADA;
using a notebook computer. The design of the system allows the provision of explicit automatic
control in the plant. Nonetheless, the operator will also be in a position to control the items
present in both the SCADA plant and the MCC (Drinan & Spellman, 2012). In this mode
though, it is meant for the purposes of emergency as well as maintenance purposes and due
caution needs to be applied when using the mode.
Some of the major plant items would include; grit and scum collection facility, 1off integrated
screenings, 1 off pre-treatment odorcollection and control unit, 1 off aerobic zone and 3 off
aeration blowers, caustic soda dosing system, hypo dosing system, plc, and SCADA system,
reclaimed effluent pressure system, 1 off treated effluent storage system, pumping and
monitoring facility, alum storage facility and dosing stem among others. This plant will be
situated at picnic bay on the magnetic island (Kuokkanen & Kuokkanen, 2013). By extension, it
will serve both the existing as well as the current projects which are present in the island. Other
detailed information concerning the membrane bioreactor wastewater treatment plant is detailed
in the below sections.
A process description.
1. Wastewater Collection
A TRAINING MANUAL FOR NEW TREATMENT PLANT 3
This acts as the main water collection process. The legal frameworks are ordinated such that all
the wastewater is ensued at a central point. By the use of underground frameworks, this water is
then coordinated to a treatment plant by the frameworks available for underground water
treatment. The transportation of wastewater ought to be that as it may be done beneath sterile
conditions. The channels ought to be leak proof (yang et al., 2014).
2. Odor Control
The process of odor control begins just at the first process of the water treatment. Usually, the
waste water contains all sorts of effluents which needs to be eliminated possibly. Over time, this
water causes a foul scent and thus the odor has to be eliminated. There are chemicals contained
at various stages such as chlorine which are responsible for the elimination of the wastewater
odor. This process is absolutely critical for the whole of the treatment process.
3. Screening
This also is another crucial step within the treatment of wastewater process. Generally, it entails
the process of removing all the waste and plastic water materials which in many ways can cause
harm into the general hardware system of the wastewater treatment plant. Usually, there are
outlined extraordinary hardware machines which are utilized to induce freed coarseness which
ensures all the harmful substances are washed down the sewer line. These materials are then
eliminated and taken into the landfills.
4. Primary Treatment
In the primary treatment, the macrobiotic solid substances are eliminated from the wastewater.
Essentially, the treatment is conducted through allowing the waste water run through big tanks
which allows the solid substances to settle at the surface of the components such as the solids
and the slurry materials. These settle material at the surface will then be extracted using huge
scrappers and then damped after being treated. The residual water thus is pumped for the process
of secondary treatments.
⊘ This is a preview!⊘
Do you want full access?
Subscribe today to unlock all pages.
Trusted by 1+ million students worldwide
A TRAINING MANUAL FOR NEW TREATMENT PLANT 4
5. Secondary Treatment
This is the activated sludge process; the treatment includes seed slurry to the wastewater to
guarantee that it’s furtherly broken down. To begin with, air is pumped into gigantic air
circulation tanks which blend the wastewater with the seed slurry which is essentially little sum
of sludge, which leads to the development of microbes that utilizes oxygen and the development
of other little microorganisms that expend the remaining organic matter. This leads to the
generation of huge particles that settle down in the huge tanks. the wastewater is then allowed
into the big tanks for a duration between 3 to 6 hours.
6. Bio-solids handling
There exist digesters which are responsible for handling the solid substances which settles out
after the secondary and primary treatment stages. These digesters are warmed to a temperature of
37 degrees celsius. Further, they are equipped with anaerobic respirators which coordinates the
strong squanders experienced in the process for a period of a month. During this process, there is
the production of methane gas as well as rich bio solids that are then re utilized and dewatered
into domestic firms located in the vicinity. However, the methane gas which is generated is
utilized a s a source of energy for the treatment plants. For instance, it can be used in the
powering of motor as well as essentially driving the plants engines and equipment. Further, the
gas can be utilized in boilers to produce fire the digesters (yang et al., 2014).
7. Tertiary treatment
comparatively, this stage the usually process of treating water for safe drinking. it generally
entails the removal of 90 percent of the effluents within the water and generates almost the water
quality. Unfortunately, the process seems to be costly because it requires exceptional apparatus,
qualified and profoundly talented operators, chemicals and a consistent energy supply.
Paraphrase This Document
Need a fresh take? Get an instant paraphrase of this document with our AI Paraphraser
A TRAINING MANUAL FOR NEW TREATMENT PLANT 5
8. Disinfection
After the essential treatment processes, there are still a few maladies causing bacteria within the
remaining treated wastewater. In order to eliminate the maladies resulting into bacteria, the
wastewater has to be cleaned for not less than 25 minutes in chlorinated tanks that contain
chlorine and sodium hypochlorite. Further, the cleansing includes the treatment procedure as it
needs to remove al the pollutants to ensure the wastewater is safety for consumption
9. Sludge Treatment
The slurry collected within the primary and secondary treatment procedures necessitates
concentration and solidifying to allow advanced processing. It is deposited into thickening tanks
that permit it to cool down and afterward isolated from the water. This process can take the
whole day and the remaining water is collected and taken back to the colossal air circulation
tanks for further treatment. The slurry is at that point treated and taken back into the environment
and can be utilized agriculturally.
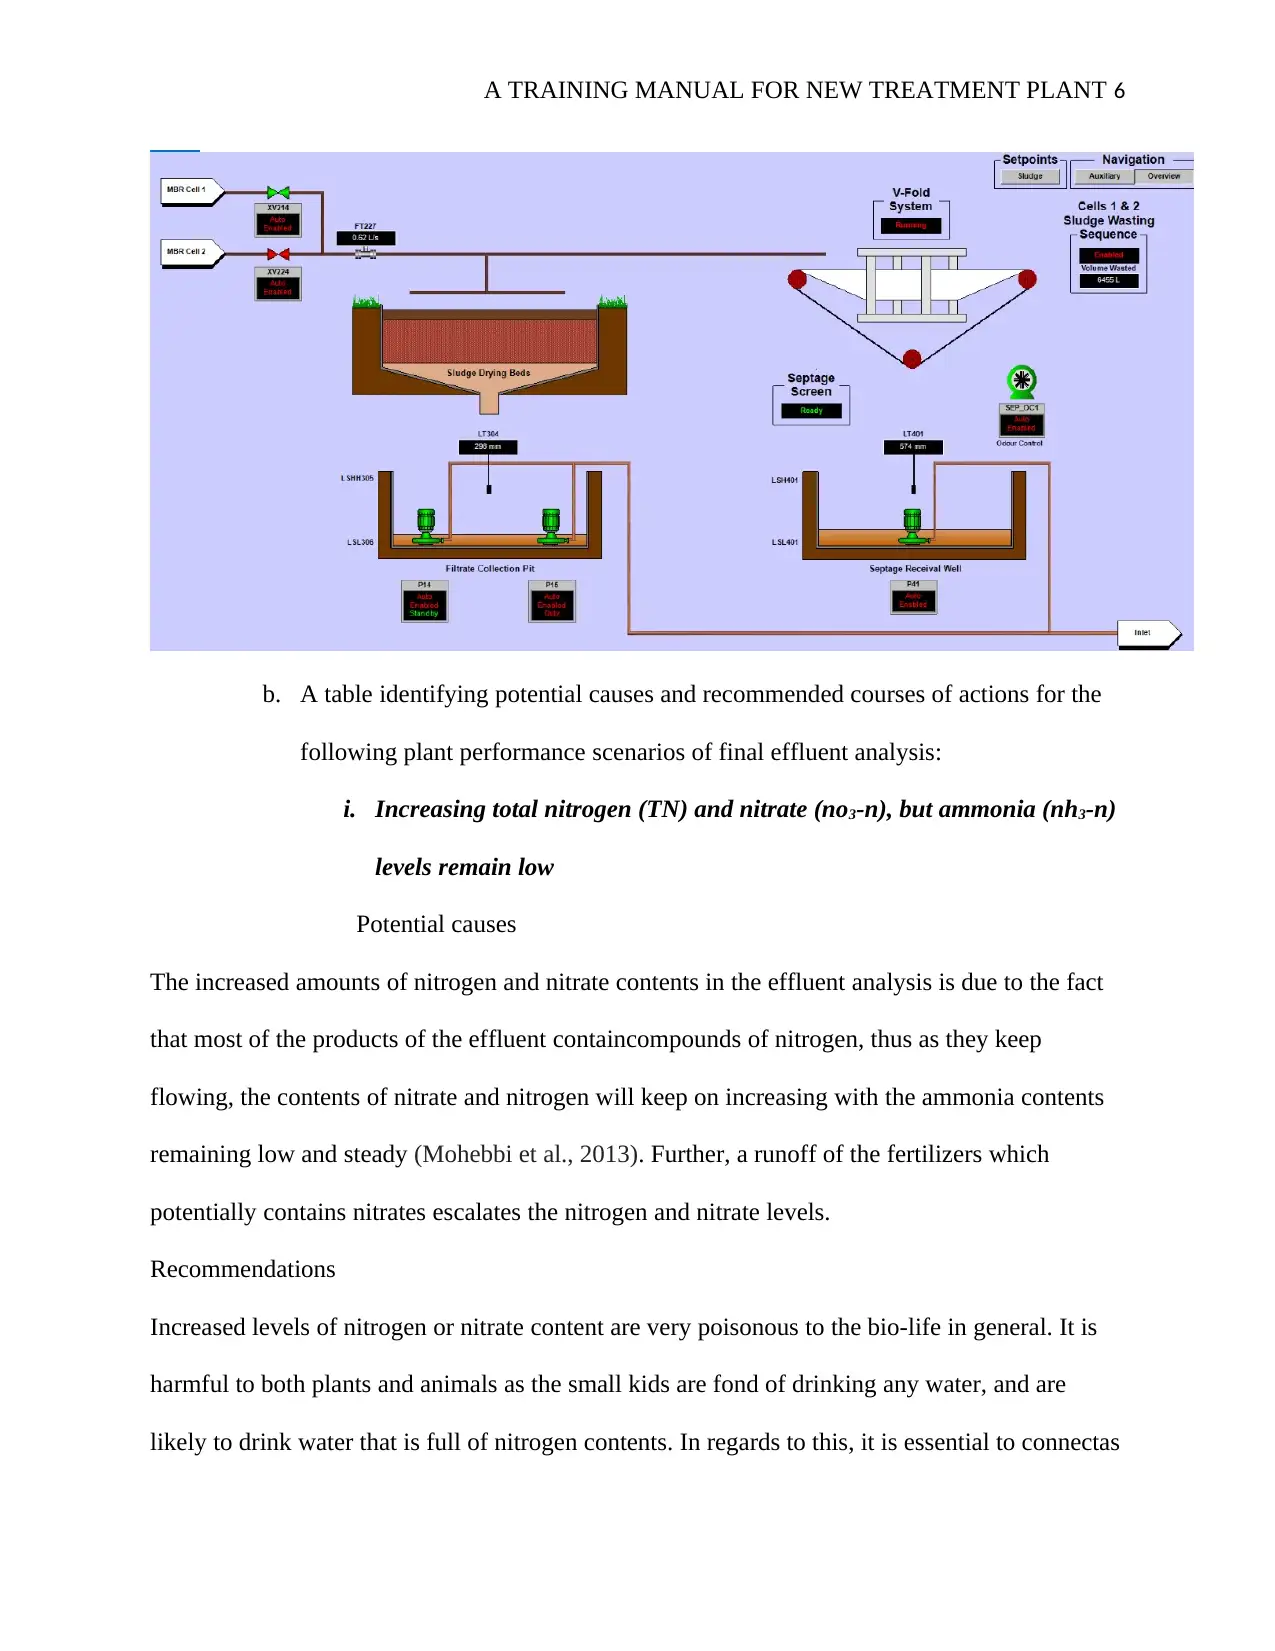
a. A process flow diagram (PFD) showing useful information like key processes
and what they achieve, reactor volumes, and adwf/ awwf rates (1-page a3
maximum)
8. Disinfection
After the essential treatment processes, there are still a few maladies causing bacteria within the
remaining treated wastewater. In order to eliminate the maladies resulting into bacteria, the
wastewater has to be cleaned for not less than 25 minutes in chlorinated tanks that contain
chlorine and sodium hypochlorite. Further, the cleansing includes the treatment procedure as it
needs to remove al the pollutants to ensure the wastewater is safety for consumption
9. Sludge Treatment
The slurry collected within the primary and secondary treatment procedures necessitates
concentration and solidifying to allow advanced processing. It is deposited into thickening tanks
that permit it to cool down and afterward isolated from the water. This process can take the
whole day and the remaining water is collected and taken back to the colossal air circulation
tanks for further treatment. The slurry is at that point treated and taken back into the environment
and can be utilized agriculturally.
a. A process flow diagram (PFD) showing useful information like key processes
and what they achieve, reactor volumes, and adwf/ awwf rates (1-page a3
maximum)
A TRAINING MANUAL FOR NEW TREATMENT PLANT 6
b. A table identifying potential causes and recommended courses of actions for the
following plant performance scenarios of final effluent analysis:
i. Increasing total nitrogen (TN) and nitrate (no3-n), but ammonia (nh3-n)
levels remain low
Potential causes
The increased amounts of nitrogen and nitrate contents in the effluent analysis is due to the fact
that most of the products of the effluent containcompounds of nitrogen, thus as they keep
flowing, the contents of nitrate and nitrogen will keep on increasing with the ammonia contents
remaining low and steady (Mohebbi et al., 2013). Further, a runoff of the fertilizers which
potentially contains nitrates escalates the nitrogen and nitrate levels.
Recommendations
Increased levels of nitrogen or nitrate content are very poisonous to the bio-life in general. It is
harmful to both plants and animals as the small kids are fond of drinking any water, and are
likely to drink water that is full of nitrogen contents. In regards to this, it is essential to connectas
⊘ This is a preview!⊘
Do you want full access?
Subscribe today to unlock all pages.
Trusted by 1+ million students worldwide
A TRAINING MANUAL FOR NEW TREATMENT PLANT 7
system which constantly eliminates the contents of both the ammonia and nitrogen levels from
the compound. For instance: the denitrification process (Salic & Zelic, 2018).
Increasing total phosphorus (tp)
Phosphorus plays an important role in promoting plant growth. However, if it is in excess, it
tends to jeopardize the growth of plants as it also results inutrophication. Primarily, the contents
of phosphorus are not eliminated at the primary removal stage, thus; most of the contents will
likely pass. These contents are mostly eliminated at the final stage, hence ratifying the reason as
to why the contents of phosphorus keep on escalation (Belfort, 2012)
Recommendations
Since phosphorus is harmful and results in eutrophication, it is essential to eliminate the contents
at a very early stage. For instance, in the primary stage. It is therefore recommended that various
effective mechanism is put into place at the primary stage so that the phosphorus contents can be
eliminated earlier, and not during effluent analysis stage (Spiller et al., 2015).
ii. Increasing ammonia (nh3-n), decreasing nitrate (no3-n), increasing total
nitrogen (TN)
From the basics, total nitrogen stands for the total compounds in the form of nitrogen within the
compound. These includethe total Kjeldan nitrogen, nitrite and nitrate components. The low
levels of nitrate are due to the fact most of the individual components will be forming the total
nitrogen components, hence leading to a decrease in the nitrate levels. Further, it demonstrates
that a section of the nitrate is being converted into nitrogen during the secondary treatment
process (Yates et al., 2014).
Another possible cause of increasing levels of ammonia ad nitrogen might be due to the higher
sludge retention time within the MBR system. Usually, when the retention time is made to be e
Paraphrase This Document
Need a fresh take? Get an instant paraphrase of this document with our AI Paraphraser
A TRAINING MANUAL FOR NEW TREATMENT PLANT 8
bit longer, the organic nitrogen becomes mineralized, increasing its content- which is then
converted into ammonia and subsequent increase in the levels.
Recommendations
As said above, increased levels of nitrogen or nitrate content is very poisonous to the bio-life in
general. It is harmful to both plants and animals as the small kids are fond of drinking any water,
and are likely to drink water that is full of nitrogen contents (Thomas & Burgess, 2017). In
regards to this, it is essential to connect as a system which constantly eliminates the contents of
both the ammonia and nitrogen levels from the compound. For instance: the the denitrification
process.
Regarding the second reason for the increase in ammonia and nitrogen contents, it is advisable to
make the retention time as short as possible as it is the reason for mineralization of nitrogen
contents, but then ensuring the the effectivity of the system.
A snapshot of current plant performance. Based on the operational records and lab results
provided, try to calculate as many plant performance parameters as possible (e.g. Hydraulic
retention time, sludge age, bod load, f/m ratio, etc.). Provide a brief comment on whether the
plant is performing within acceptable limits for an MBR plant. If the the calculation of a plant
performance parameter is not possible to recommend what parameters need to be measured
for its future calculation.
Considering the values provided, calculation of the plant performance parameters may not be
easily achievable. There are some values thathave not been availed. Hence a recommendation of
various plant performance shall be detailed which needs to be determined for future calculation.
The major areas which indicate an improvement in this design include five parameters namely:
TKN, TSS, COD, DRP, and Org- N. The TSS as well as the organic nitrogen removal rate
A TRAINING MANUAL FOR NEW TREATMENT PLANT 9
depends on the separation ability of the membrane to the sieve of the solids without relying on
the gravity. In terms of the COD, two significant parameters were nor provided which are
essential in generating comparable results in regards to the performance of the membrane
bioreactor. These aspects include; the biological activity within the process as well as the dosing
rate of ethanol. The MBR SRT was also not specified, making it difficult to determine the COD.
These parameters need to be determined in future Yang et al., 2014).
Part B: technical section
1. Sizing an upgraded scum (fat/oil/grease) removal system. The scum is removed from
the Noggerath inlet area into a hopper (0.4 m3) by a scum skimmer. Currently,, the
scum hopper is filled daily and the Council would like to increase its volume. The scum
in the hopper is 1% oil and grease and 99% water. Use the weekly test results from
Townsville Laboratory Services and plant inflow data to estimate the maximum size
required for an upgraded scum hopper.
Deterrence in the membrane bioreactor needs to be avoided as much as possible as it is likely to
result in manhole overflows, sewage spills, health hazards as well as environmental issues. The
major contributors to these problems aree due to the wastes which are generated such as
vegetable and animal-based oil and grease which does not have adequate grease control
measures in place (Ranade & Bhandari, 2014). When these materials are disposed ofinto the
sinks, the stick on the pipe and with time, they eventually block up the piping system.
Detergents that claim to be soluble and can dissolve the grease needs not to be used as they
potentially move the grease down the pipe and then result in problems at the downstream points.
⊘ This is a preview!⊘
Do you want full access?
Subscribe today to unlock all pages.
Trusted by 1+ million students worldwide
A TRAINING MANUAL FOR NEW TREATMENT PLANT 10
An effective means of eliminating these greases is by use of grease control devices (Yates,
2014).
The formula below will assist in determining the size of the scum hopper
(TGC) x (CPH) x (RT) x (ST) = Size of Lint scum hopper (Yatel et al., 2014).
Where: TGC = Total Gallons per Cycle
CPH = Cycles per hour
RT = Retention time
2.5 for Institutional Laundry
2.0 for Standard Commercial Laundry
1.5 Light Commercial Laundry
ST = Storage Factor, based on hours of operation;
1.0 for 8 hours of operation
1.5 for 12 or more hours
2. Anoxic zone 1 and 2 have developed a 200mm thick crust in the months of July and
August. It is theorized that this crust is formed by the growth of filamentous bacteria.
Provide a brief bullet point list of recommendations to limit this crust formation.
In ordinary situations, the bacteria present in the membrane bioreactor within an activated
sludge will be present in the form of small chains, singly or in clumps. However, in adverse
situations, the bacteria develop into filaments which are long chains that lead to the
formation of crust. Some of the filaments in the activated sludge are advantageous, however,
when they are exposed to aeration they begin to forming crust. To manage the filaments, it is
Paraphrase This Document
Need a fresh take? Get an instant paraphrase of this document with our AI Paraphraser
A TRAINING MANUAL FOR NEW TREATMENT PLANT 11
essential to identify some of the causes, and then provide recommendations on actions that
can be taken to prevent crust formation. The key cause includes:
Excess oils & grease;
The decline in aeration basin
ph
Animal & vegetable oils and
grease; (Yatel et al., 2014).
Insufficient DO for the
applied organic loading
waste deficient in nitrogen;
Colder temperatures;
Excess organic acids
Nutrient deficient conditions
Longer sludge ages;
Low F/M
Septic wastes;
Organic overload
Countermeasures
There exist a number of ways thatcan be applied towards managing the growth of bacterial
filaments. These methods would include both short term and long-term strategies. They include
Before activation of the sludge tank or installation of the cascade systems, high loaded
tank sectors needs to be erected (Yatel et al., 2014).
The addition of precipitants and flocculants.
Bypassing the preliminary sedimentation,
Through supplying lennsludge.
Improving the wastewater characteristics of lopsided effluents or
Sludge Juggling -this involves manipulation of the return sludge (RAS) flow rate and
waste feed points .
Polymer and Coagulant Addition – they are added to the secondary clarifier center well
or MLSS as it leaves the aeration basin
A TRAINING MANUAL FOR NEW TREATMENT PLANT 12
Chlorination -
Long term measures include activities such as
1. Changes in biomass concentration or changes in the waste feeding patterns.
nutrient additions (industrial waste systems only);
2. Changes in aeration (Yatel et al., 2014);
3. Control of influent waste septicity (organic acids and H2S);
Chlorination -
Long term measures include activities such as
1. Changes in biomass concentration or changes in the waste feeding patterns.
nutrient additions (industrial waste systems only);
2. Changes in aeration (Yatel et al., 2014);
3. Control of influent waste septicity (organic acids and H2S);
⊘ This is a preview!⊘
Do you want full access?
Subscribe today to unlock all pages.
Trusted by 1+ million students worldwide
1 out of 14

Your All-in-One AI-Powered Toolkit for Academic Success.
+13062052269
info@desklib.com
Available 24*7 on WhatsApp / Email
![[object Object]](/_next/static/media/star-bottom.7253800d.svg)
Unlock your academic potential
Copyright © 2020–2026 A2Z Services. All Rights Reserved. Developed and managed by ZUCOL.