Prosperous Pets: Analyzing Cable Channel Advertising Campaign Options

Verified

Added on  2019/09/18

|5
|1678
|1264
Project
AI Summary
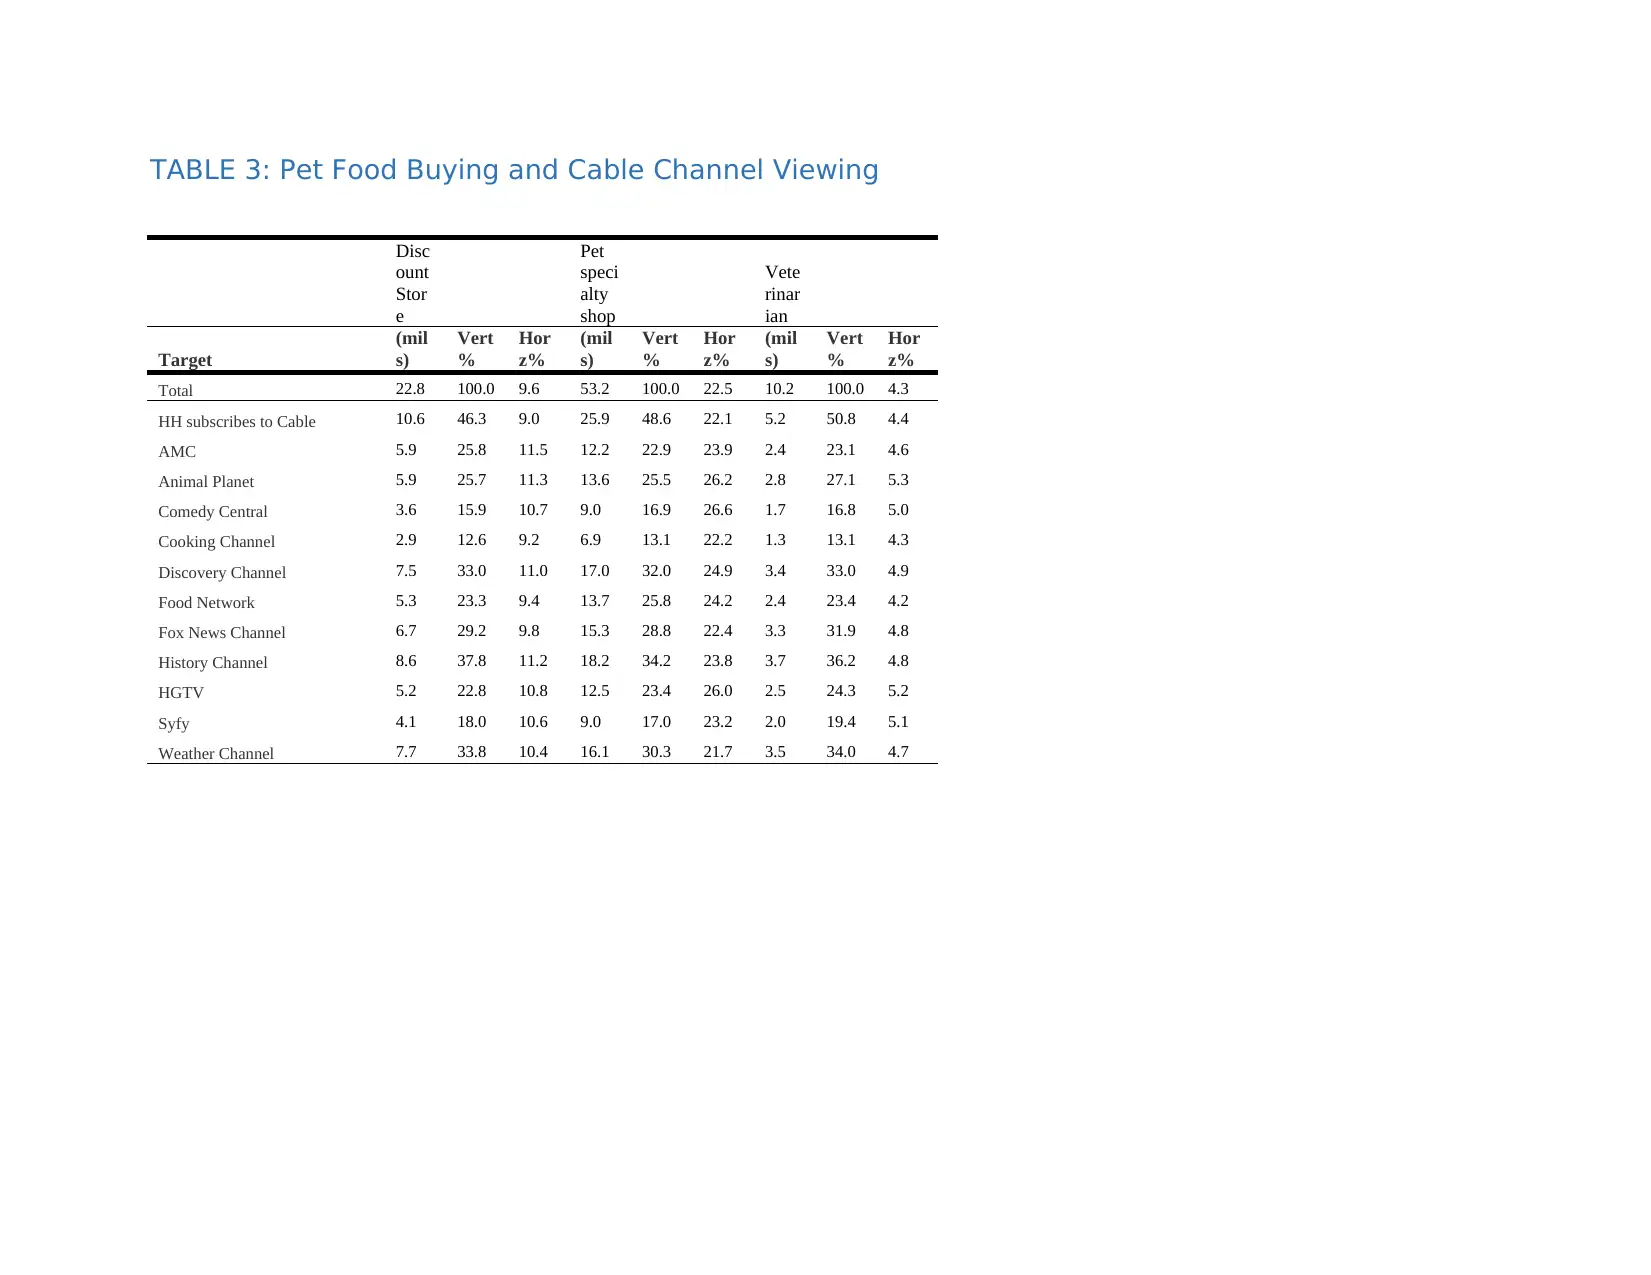
This project analyzes data from GfK's Media Mark Report to recommend the most effective cable channels for PROSPEROUS PETS' first television advertising campaign. The assignment involves understanding pet ownership, pet service usage, and pet food purchasing habits across 11 cable channels. The task requires calculating various metrics such as percentage chances, index values, and identifying the channels that best align with PROSPEROUS PETS' target audience. The analysis includes interpreting data from three tables, answering specific questions about pet owner demographics, service usage, and purchasing behaviors. Based on the data, the student recommends the top three and bottom three cable channels for advertising, considering factors such as profitability of services versus products. The project also explores the need for additional data and the impact of PROSPEROUS PETS' service-focused business model on advertising recommendations.
Document Page
Cats, Kibble, and Cable TV
Background and Goal
You were hired by PROSPEROUS PETS, a small regional chain of boutique pet care stores. PROSPEROUS PETS focuses on serving dog and cat
owners for all of their pet needs, including: pet sitting, pet training, grooming, toys, and food. PROSPEROUS PETS tends to serve customers who
consider their dogs and cats “surrogate children,” and, in turn, are willing to spend top dollar on quality services and products.
PROSPEROUS PETS is preparing to launch its first television advertising campaign. The top management team has whittled the list of cable
channels to potentially advertise on down to 11. Your task is to analyze additional information about the viewers of these 11 stations and come
up with a short list of cable channels that you believe will be best for PROSPEROUS PETS. To aid you in your task, management handed you
three reports generated from GfK’s Media Mark Report tool. The first report deals with the quantity of pets owned by viewers of each channel,
the second report deals with the types of pet services used by channel viewers, and the final report is about where people buy their pet food.
The Data
The data in each of the three reports can be interpreted in a similar manner.
The (mils) column is the estimated number (in millions) of people or U.S. households who exhibited the target behavior in the row and
column. For example, 15.1 million U.S. adults report watching the cable channel AMC as well as own 1 dog.
The Vertical % column is the estimated % of all people in a column who watch the channel reported in the table’s row. For example, of
all people who own 1 dog, 23.8% of them also report watching AMC.
The Horizontal % column is the estimated % of all people in a row who also exhibit the behavior reported in the table’s column. For
example, of all people who watch AMC, 29.7% of them own 1 dog.
These three pieces of information can be informative on their own. However, they can also be used to calculate other useful metrics.
Task 1: Understanding the Data
Use the information provided in Table 1 to answer the following questions:
1. If someone owns a dog, what is the % chance they watch Fox News? What if they own a cat?
tabler-icon-diamond-filled.svg

Paraphrase This Document

Need a fresh take? Get an instant paraphrase of this document with our AI Paraphraser
Document Page
2. Which channel is much more likely to be watched by someone with 4 or more dogs than an average American? What is the INDEX value
for this channel? An INDEX value of 100 is the benchmark for an average American adult to have 4 or more dogs.
3. Which channel is much LESS likely to be watched by someone with 4 or more cats than compared to an average American? What is the
INDEX value?
4. If we wanted to reach the absolute most 2 to 3 dog owning households by advertising on only a single cable channel, which channel
would we pick?
5. Based on these results, is it fair to say that Animal Planet watchers are more likely to own either a cat or dog compared to the national
average?
6. Regardless of the number of dogs or cats someone owns (including zero!), about how many U.S. adults in total said they watch the
Cooking Channel?
Use the information provided in Table 2 to answer the following questions:
1. Your friend assumed that Animal Planet is the best channel for finding pet owners who use pet services frequently. Does your data
support or contradict her belief? Why?
Use the information provided in Table 3 to answer the following questions:
1. Assuming people only buy from one of the three options, how many people in total bought their pet food from a discount
store, a pet specialty store, or directly from their veterinarian? What % of this total bought from their veterinarian?
2. Which cable channel had viewers with the largest % of their pet food shopping done at a veteranarian?
Discussion and Debate:
1. Based only on the information provided, which 3 cable channels would you recommend as the best choices for promoting the business?
Which 3 cable channels do you think are the poorest fit?
Document Page
2. What other additional information would you like to have so that you could make a more informed recommendation? Why is it
important? How could you find out this information?
3. If PROSPEROUS PETS told you that its services were much more profitable than its product (toys, food, etc.) sales, would that change
your recommendation? Why or why not?
TABLE 1: Pet Ownership and Cable Channel Viewing
1
dog
2-3
dogs
4+
dogs 1 cat
2-3
cats
4+
cats
Target
(mil
s)
Vert
%
Hor
z%
(mil
s)
Vert
%
Hor
z%
(mil
s)
Vert
%
Hor
z%
(mil
s)
Vert
%
Hor
z%
(mil
s)
Vert
%
Hor
z%
(mil
s)
Vert
%
Hor
z%
Total 63.8 100.0 26.9 39.5 100.0 16.7 5.8 100.0 2.4 29.0 100.0 12.2 21.4 100.0 9.0 5.6 100.0 2.4
HH subscribes to Cable 31.4 49.3 26.9 16.8 42.4 14.3 1.9 32.9 1.6 14.4 49.5 12.3 9.7 45.4 8.3 2.1 37.0 1.8
AMC 15.1 23.8 29.7 9.2 23.3 18.1 1.3 21.8 2.5 6.9 23.9 13.6 5.0 23.2 9.7 1.4 25.3 2.8
Animal Planet 15.5 24.2 29.8 11.4 28.9 22.0 1.6 27.5 3.1 7.5 25.8 14.4 6.0 28.0 11.6 1.6 27.9 3.0
Comedy Central 9.8 15.4 28.9 7.1 17.9 20.8 0.9 15.0 2.6 4.5 15.4 13.1 3.9 18.3 11.6 0.9 15.3 2.5
Cooking Channel 8.4 13.2 26.8 4.9 12.5 15.8 0.9 15.7 2.9 3.4 11.7 10.8 3.1 14.4 9.9 0.7 12.0 2.2
Discovery Channel 19.3 30.3 28.3 13.4 33.9 19.6 1.8 32.0 2.7 9.0 31.2 13.2 7.0 32.5 10.2 1.7 30.1 2.5
Food Network 16.2 25.4 28.6 9.7 24.5 17.1 1.5 26.4 2.7 7.0 24.2 12.4 5.6 26.0 9.8 1.3 22.5 2.2
Fox News Channel 19.1 30.0 28.0 11.3 28.7 16.6 1.6 28.6 2.4 8.3 28.5 12.1 5.9 27.8 8.7 1.4 25.7 2.1
History Channel 21.4 33.6 27.9 15.2 38.5 19.8 2.2 37.7 2.8 9.9 34.2 12.9 8.2 38.5 10.7 2.2 39.2 2.9
HGTV 14.8 23.2 30.8 8.6 21.9 18.0 1.2 20.5 2.5 5.8 20.1 12.1 4.9 22.9 10.2 1.2 21.0 2.5
Syfy 10.0 15.6 25.6 7.9 20.0 20.3 1.6 27.0 4.0 5.2 17.9 13.3 4.4 20.5 11.3 1.3 23.3 3.4
Weather Channel 19.6 30.7 26.4 12.5 31.7 16.9 2.0 34.7 2.7 9.5 32.7 12.8 6.8 31.6 9.1 2.0 36.0 2.7
Document Page
TABLE 2: Pet Service Usage and Cable Channel Viewing
Has
Pet
Insur
ance
Used
Pet
Day
care
Used
Pet
Groo
ming
1
Vat
Visit
2-3
Vet
Visit
s
4+
Vet
Visit
s
Target
(mil
s)
Vert
%
Hor
z%
(mil
s)
Vert
%
Hor
z%
(mil
s)
Vert
%
Hor
z%
(mil
s)
Vert
%
Hor
z%
(mil
s)
Vert
%
Hor
z%
(mil
s)
Vert
%
Hor
z%
Total 7.1 100.0 3.0 3.5 100.0 1.5 31.9 100.0 13.5 34.8 100.0 14.7 42.1 100.0 17.8 24.1 100.0 10.2
HH subscribes to Cable 3.3 46.5 2.8 1.6 46.7 1.4 16.1 50.4 13.7 16.8 48.3 14.4 19.9 47.3 17.1 11.0 45.8 9.4
AMC 1.5 21.8 3.0 0.9 26.0 1.8 7.9 24.7 15.5 7.8 22.4 15.3 10.2 24.2 20.1 5.3 22.1 10.4
Animal Planet 1.6 23.1 3.2 0.7 19.0 1.3 8.0 25.1 15.5 8.3 23.7 15.9 11.1 26.4 21.5 6.6 27.5 12.8
Comedy Central 1.1 15.6 3.3 0.7 19.5 2.0 5.4 16.9 15.9 5.5 15.9 16.3 7.1 16.8 20.9 4.4 18.1 12.9
Cooking Channel 0.8 11.7 2.7 0.4 11.8 1.3 4.2 13.1 13.4 4.6 13.2 14.6 5.7 13.4 18.1 2.9 12.1 9.3
Discovery Channel 2.0 28.3 2.9 1.1 31.2 1.6 10.4 32.5 15.2 10.5 30.1 15.3 13.9 33.1 20.4 7.8 32.4 11.4
Food Network 1.8 25.2 3.2 1.1 31.5 1.9 8.7 27.4 15.5 8.6 24.8 15.2 10.8 25.7 19.1 6.2 25.8 11.0
Fox News Channel 1.8 25.8 2.7 0.9 24.7 1.3 10.2 31.8 14.9 10.4 29.8 15.2 12.4 29.5 18.2 6.9 28.8 10.2
History Channel 2.4 33.7 3.1 1.2 34.5 1.6 11.9 37.4 15.6 11.9 34.1 15.5 15.3 36.3 19.9 8.8 36.5 11.5
HGTV 1.6 22.3 3.3 0.8 22.4 1.6 8.3 26.0 17.3 7.5 21.6 15.7 9.6 22.7 19.9 6.2 25.7 12.9
Syfy 1.4 20.1 3.7 0.4 11.8 1.0 5.3 16.6 13.6 6.0 17.1 15.3 8.0 19.1 20.7 4.2 17.2 10.7
Weather Channel 1.9 26.4 2.5 1.0 27.9 1.3 10.6 33.2 14.3 10.7 30.9 14.5 13.4 31.9 18.1 8.4 34.7 11.3
tabler-icon-diamond-filled.svg

Paraphrase This Document

Need a fresh take? Get an instant paraphrase of this document with our AI Paraphraser
Document Page
TABLE 3: Pet Food Buying and Cable Channel Viewing
Disc
ount
Stor
e
Pet
speci
alty
shop
Vete
rinar
ian
Target
(mil
s)
Vert
%
Hor
z%
(mil
s)
Vert
%
Hor
z%
(mil
s)
Vert
%
Hor
z%
Total 22.8 100.0 9.6 53.2 100.0 22.5 10.2 100.0 4.3
HH subscribes to Cable 10.6 46.3 9.0 25.9 48.6 22.1 5.2 50.8 4.4
AMC 5.9 25.8 11.5 12.2 22.9 23.9 2.4 23.1 4.6
Animal Planet 5.9 25.7 11.3 13.6 25.5 26.2 2.8 27.1 5.3
Comedy Central 3.6 15.9 10.7 9.0 16.9 26.6 1.7 16.8 5.0
Cooking Channel 2.9 12.6 9.2 6.9 13.1 22.2 1.3 13.1 4.3
Discovery Channel 7.5 33.0 11.0 17.0 32.0 24.9 3.4 33.0 4.9
Food Network 5.3 23.3 9.4 13.7 25.8 24.2 2.4 23.4 4.2
Fox News Channel 6.7 29.2 9.8 15.3 28.8 22.4 3.3 31.9 4.8
History Channel 8.6 37.8 11.2 18.2 34.2 23.8 3.7 36.2 4.8
HGTV 5.2 22.8 10.8 12.5 23.4 26.0 2.5 24.3 5.2
Syfy 4.1 18.0 10.6 9.0 17.0 23.2 2.0 19.4 5.1
Weather Channel 7.7 33.8 10.4 16.1 30.3 21.7 3.5 34.0 4.7
chevron_up_icon
1 out of 5
circle_padding
hide_on_mobile
zoom_out_icon
[object Object]