AFCP8001 Term 1 2020: Epeus Portfolio Stock Pricing Analysis

Verified

Added on  2022/08/14

|15
|2430
|15
Project
AI Summary
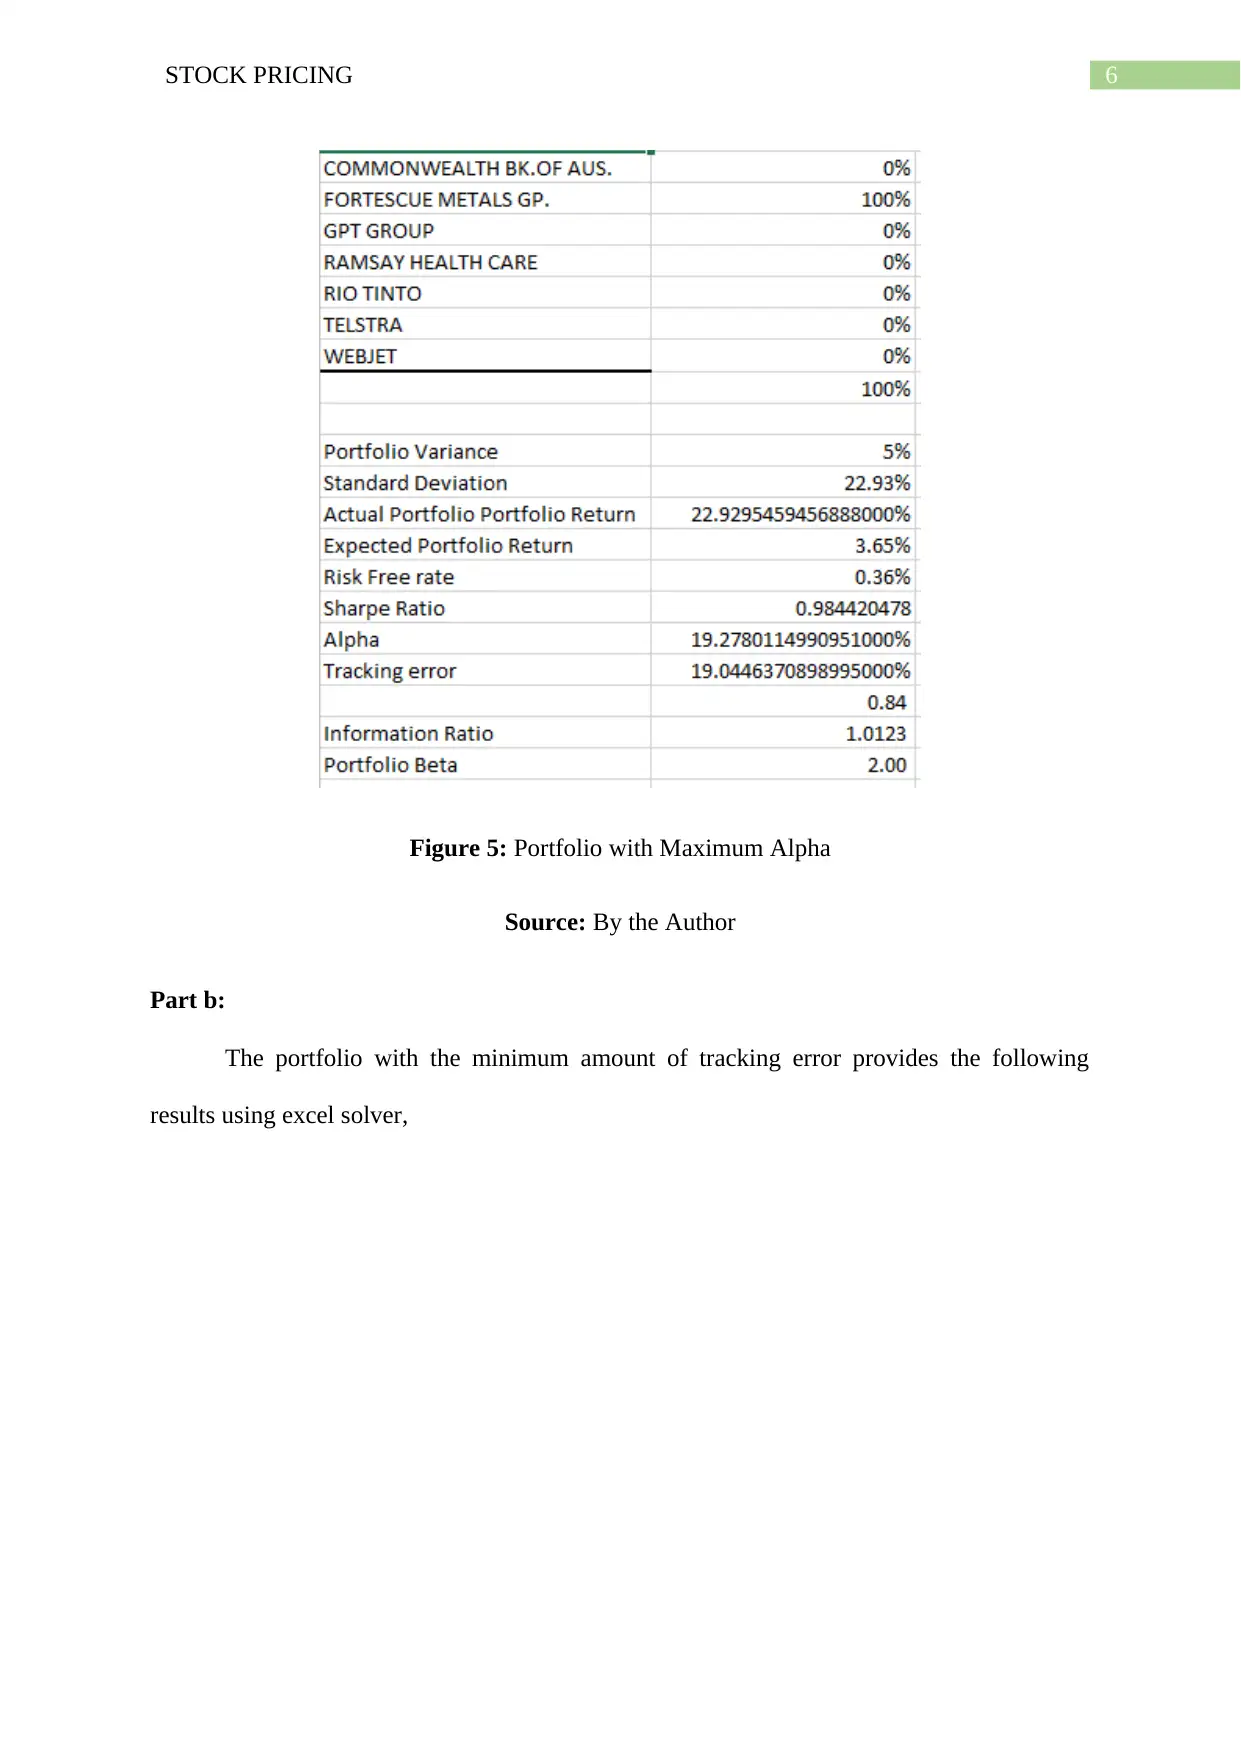
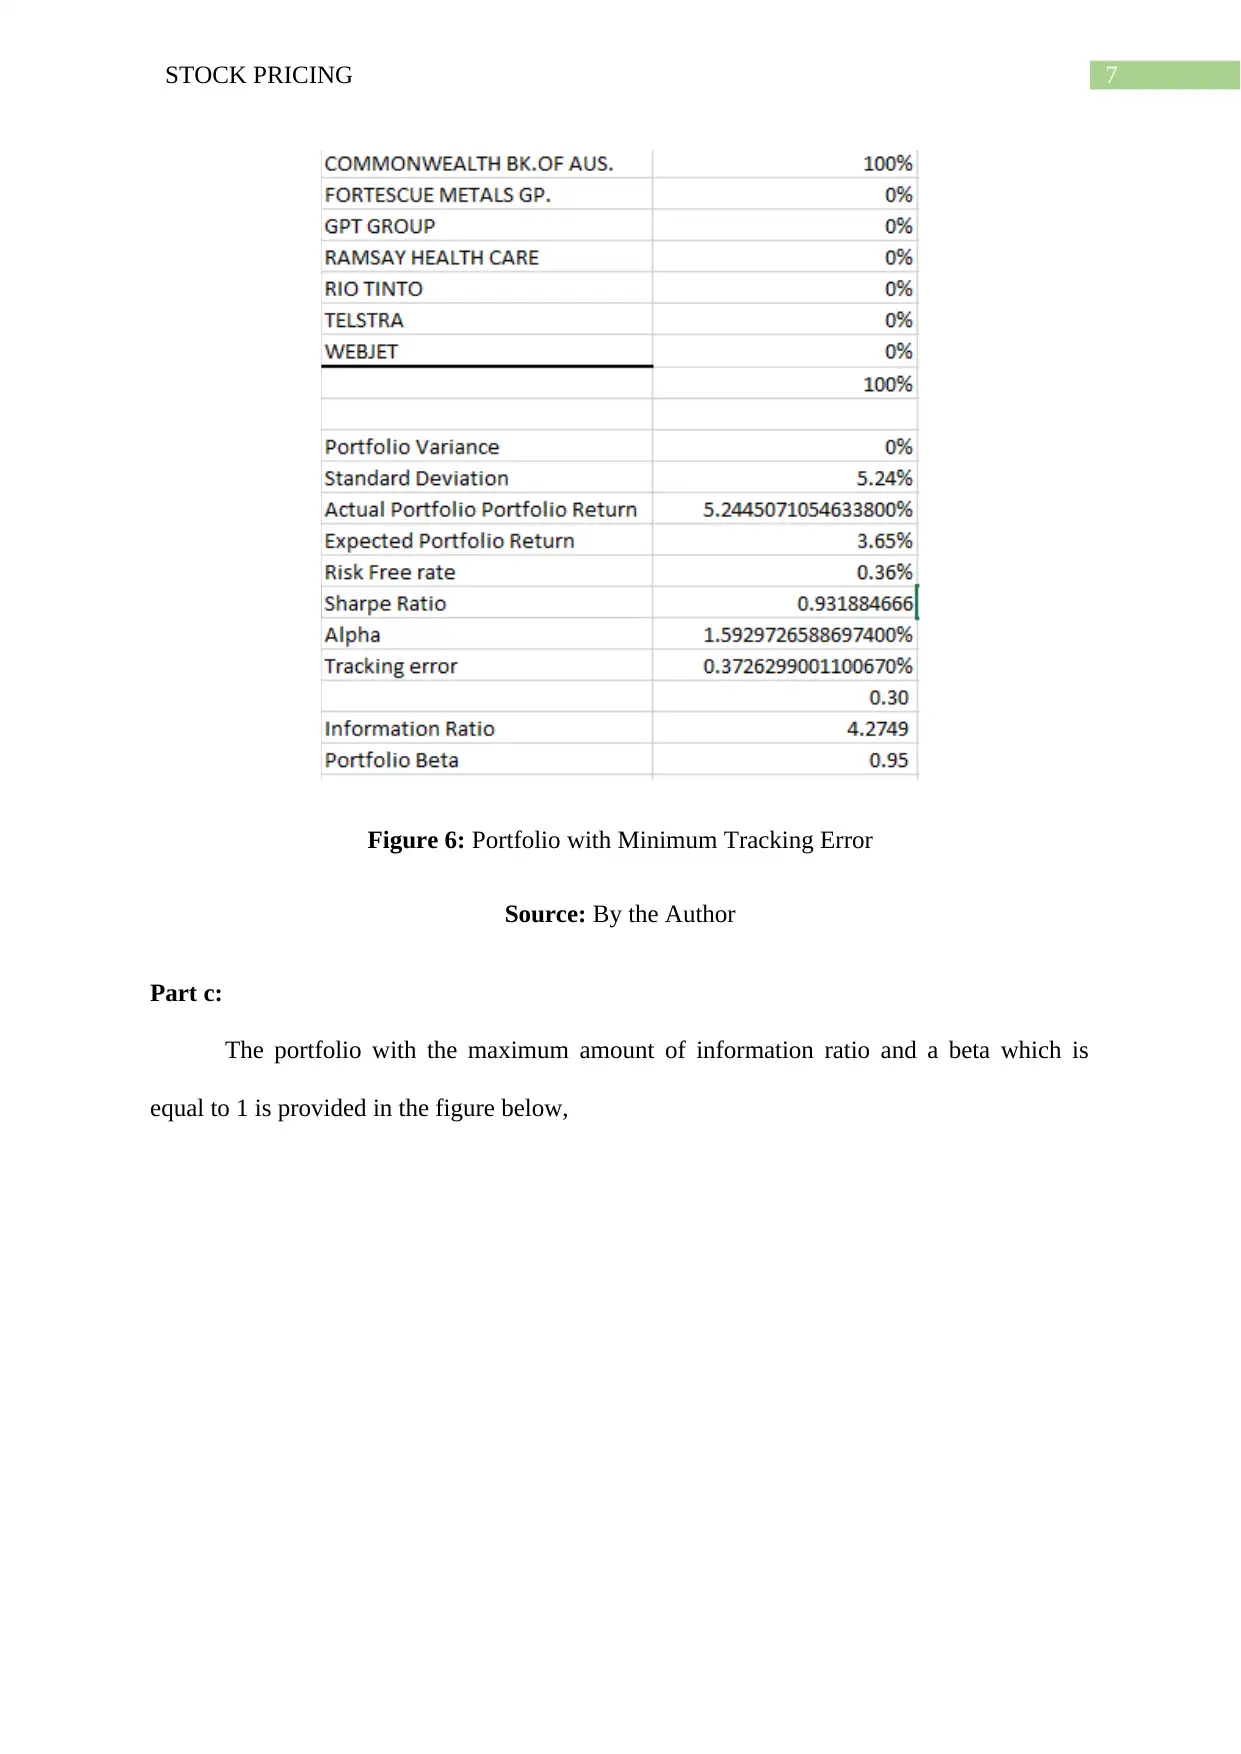
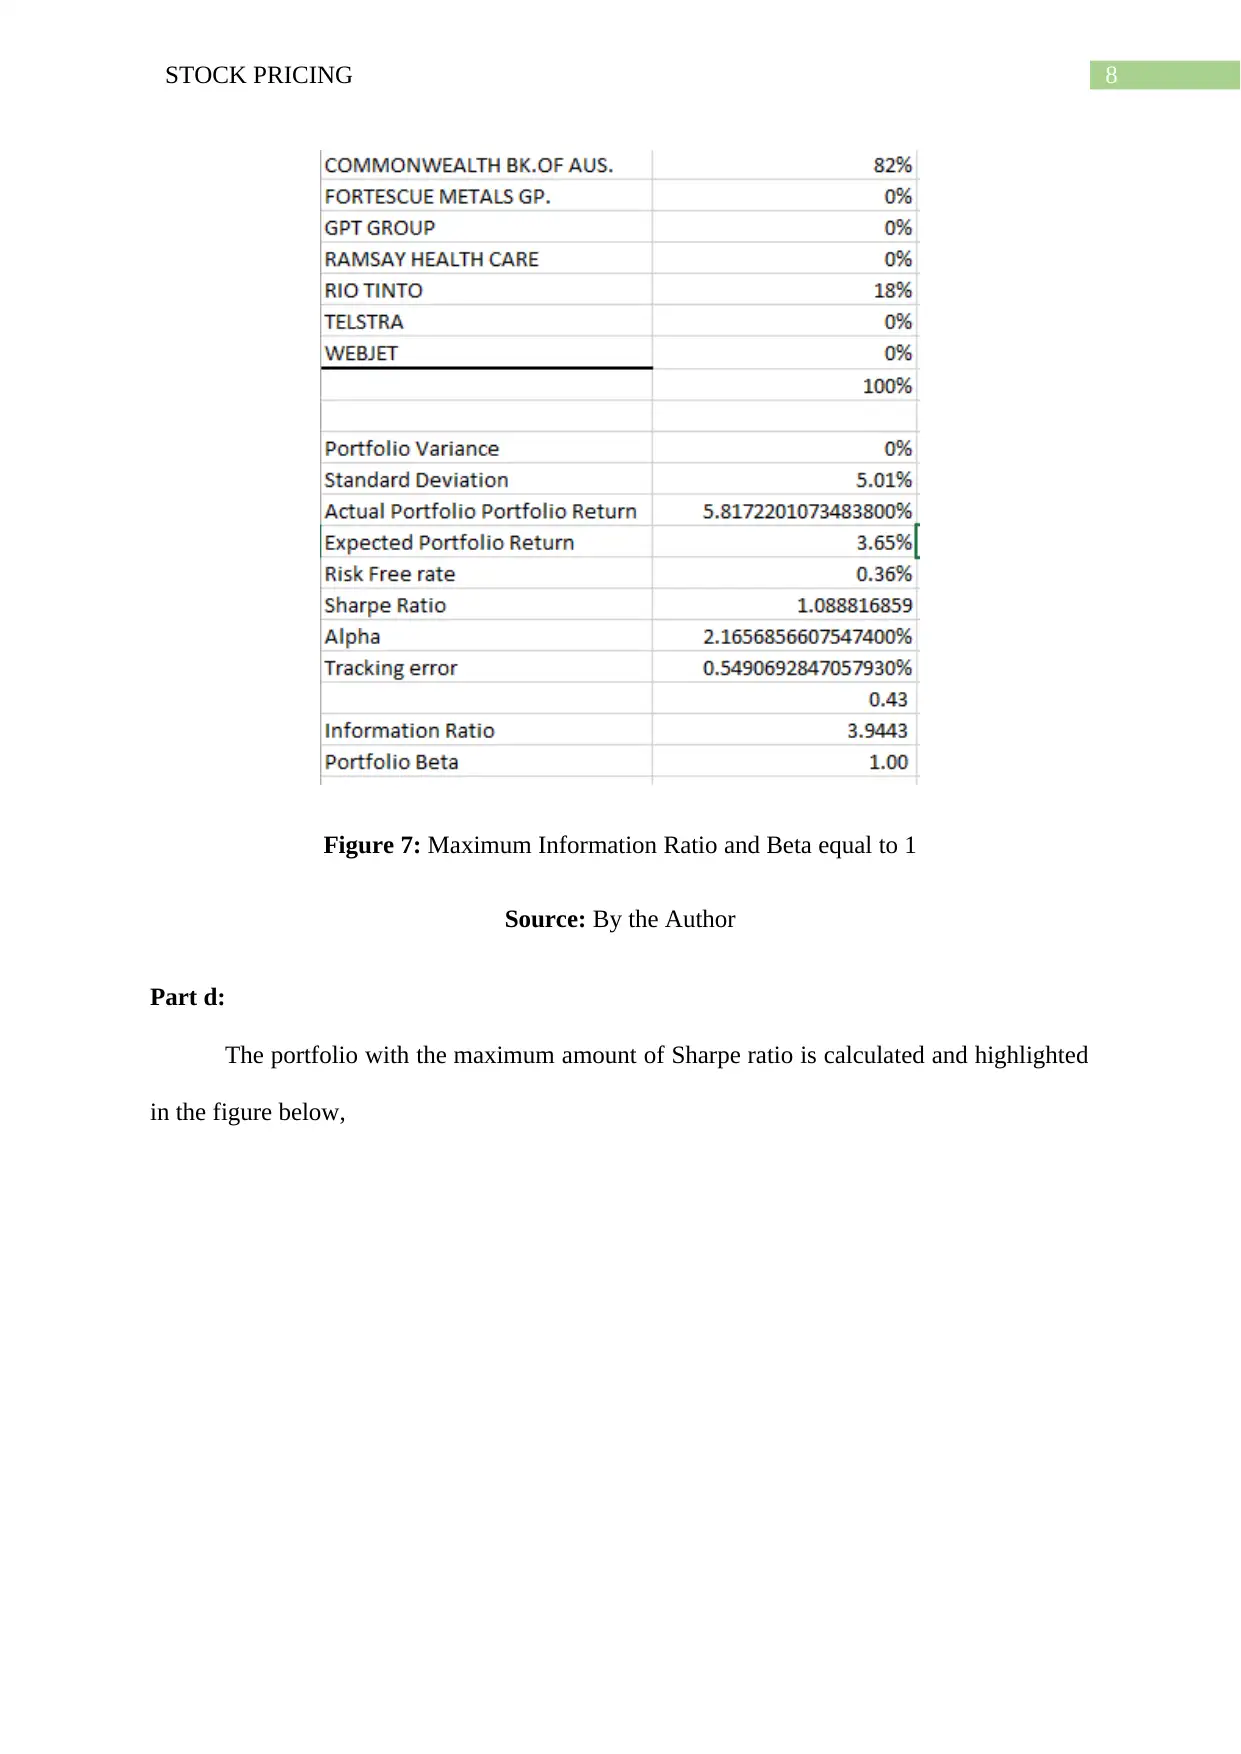
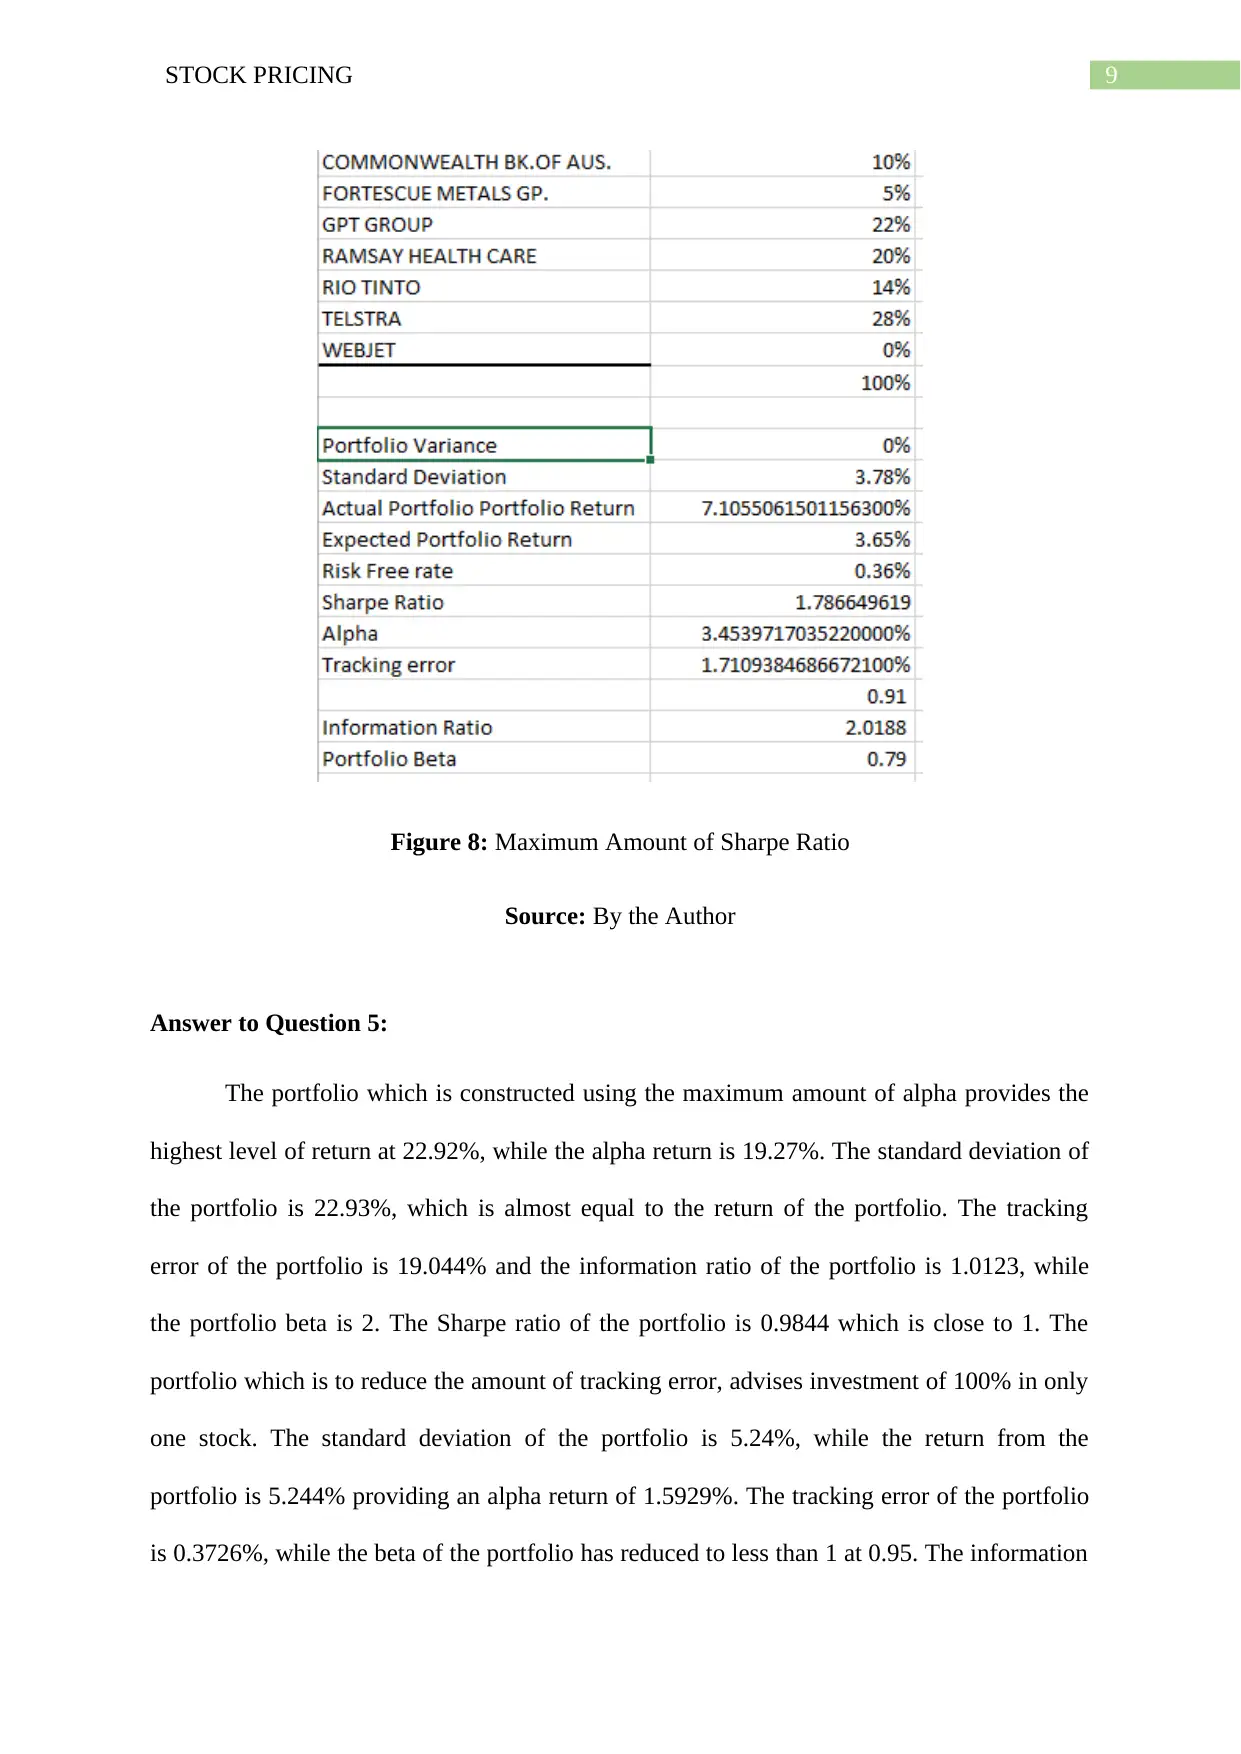
This assignment analyzes stock pricing models, portfolio construction, and the use of robo-advisors. The analysis begins with calculating key metrics like alpha, beta, Sharpe ratio, and tracking error using both single and multi-factor models. The student then explores portfolio optimization techniques to maximize returns and minimize risks, including constructing portfolios with maximum alpha, minimum tracking error, maximum information ratio (with beta = 1), and maximum Sharpe ratio. The assignment also delves into the application of robo-advisors in the investment industry, comparing their efficiency and effectiveness with traditional advisors. The student provides recommendations for Epeus Portfolio Management based on the findings, highlighting the benefits of robo-advisors and the importance of diversification and risk management. The project uses Excel Solver to optimize portfolio weights, generate capital allocation lines, and analyze efficient frontiers, providing a practical application of financial concepts.
Document Page
Running head: STOCK PRICING
Stock Pricing
Name of the Student:
Name of the University:
Author Note:
tabler-icon-diamond-filled.svg

Paraphrase This Document

Need a fresh take? Get an instant paraphrase of this document with our AI Paraphraser
Document Page
1STOCK PRICING
Table of Contents
Answer to Question 1:................................................................................................................2
Part a:.....................................................................................................................................2
Part b:.....................................................................................................................................2
Part c:.....................................................................................................................................3
Answer 2:...................................................................................................................................3
Answer to Question 3:................................................................................................................4
Answer to Question 4:................................................................................................................5
Part a:.....................................................................................................................................5
Part b:.....................................................................................................................................6
Part c:.....................................................................................................................................7
Part d:.....................................................................................................................................8
Answer to Question 5:................................................................................................................9
Answer to Question 6:..............................................................................................................10
Answer to Question 7:..............................................................................................................12
Bibliographies:.........................................................................................................................13
Document Page
2STOCK PRICING
Answer to Question 1:
Part a:
The standard deviation and the average arithmetic excess return is provided in the
figure below,
Figure 1: Average Return and Standard Deviation
Source: By the Author
Part b:
The tracking error of the companies is calculated in the figure below and highlights
the different level of tracking error for the stocks.
Figure 2: Tracking Error
Source: By the Author
The alpha, beta, t-statistic and r-square for the shares is provided in the figure below
which has been calculated using regression.
Figure 3: Alpha Beta T-Statistic and R-square
Document Page
3STOCK PRICING
Source: By the Author
Part c:
The second pass regression has been conducted as per the data provided and the
results is presented in the table below,
Figure 4: Second Pass Regression
Source: By the author
Answer 2:
The two asset pricing models which has been used in the above calculation are the
single factor model and the multi factor model. In the single factor model, the asset are priced
considering only one data which is the index of the stocks. In the multi factor model
additional factors such as the SMB and HML are incorporated in the existing single factor
model. Thus the risk which the portfolio was exposed to in a single factor model is increased
with the incorporation of other factors.
This also highlights the use of smart beta investing which can be used by the portfolio
managers to beat the benchmark index. Thus in a single factor smart beta investing only one
tabler-icon-diamond-filled.svg

Paraphrase This Document

Need a fresh take? Get an instant paraphrase of this document with our AI Paraphraser
Document Page
4STOCK PRICING
factor which drives the stock is looked upon when deciding to invest in a stock, while in a
multi factor smart beta various factors are considered when making the investment in a stock.
Thus since Epeus Portfolio managers have a claim to superior stock selection skills,
this can be enhanced by the use of Multi-factor models. Since with the use of single factor
model only one of the factors is taken into consideration while selecting a stock. Thus the
performance of the stock highly depends on the only one factor on which the stock is selected
using the single factor model. However, with the use of multifactor model additional factors
are considered when selecting the stock, which increases the possibility of the stock
performing well when so many factors are considered.
Thus the management should use multifactor model while selecting the stocks as it
will enhance the stock selection of the portfolio managers and would lead to an increase in
active return of the portfolio.
Answer to Question 3:
One of the funds which is a multifactor fund and is handled by three portfolio
managers is the fund MSCI USA diversified Multi factor index. The index which is the
benchmark for the fund is the MSCI USA index and focuses on four factors when selecting
the stocks for the fund. The four style factors which are considered when selecting the stocks
for the fund are Value, momentum, quality and size of the firm. Thus this factors are
considered when selecting a stock for the fund, while the risk of the fund is kept at a level of
the index.
Thus, the fund consists of stocks which are equally weighted using the above style
factors. The points for the factors for a stock is calculated using a Global Equity model of the
company. The value is calculated by analysing the different financial ratio of the company
Document Page
5STOCK PRICING
which depicts the value of the company. The quality score is calculated for a stock by also
analysing the financial ratio, which highlight the profitability and the turnover of the
company. The momentum is given points when the stock’s historical performance in the past
2 years is measured with the global markets and also the stocks of the same industry over 1
year period. The size of the company is measured by analysing the market capitalization of
the company with peer companies in the same country but also different industry.
The other funds which is also using a four factor multi model for the selection of
stock is the Goldman Sachs Active Beta US Large Cap Fund. The factors which are used by
this fund is the same as the above mentioned fund, however giving scores or points to these
factors is different where value is given score by using the book value to price, sales to price
and free cash flow to price ratio. The momentum is provided a score using the Beta and
volatility adjusted returns which are taken daily and taken for an 11 month period. The gross
profit or the return on equity is taken to measure the quality factor of the stock. Thus the
fourth factor which is different in this fund is the low volatility factor, thus stocks which have
a low volatility are considered and provided a score.
Thus the two funds have different fund managers and are measured using the
multifactor model. Also they use different methodology to provide score to the factors which
are used in selection of the stock.
Answer to Question 4:
Part a:
The share-holding with the maximum amount of alpha provides the following results
with the use of excel solver,
Document Page
6STOCK PRICING
Figure 5: Portfolio with Maximum Alpha
Source: By the Author
Part b:
The portfolio with the minimum amount of tracking error provides the following
results using excel solver,
tabler-icon-diamond-filled.svg

Paraphrase This Document

Need a fresh take? Get an instant paraphrase of this document with our AI Paraphraser
Document Page
7STOCK PRICING
Figure 6: Portfolio with Minimum Tracking Error
Source: By the Author
Part c:
The portfolio with the maximum amount of information ratio and a beta which is
equal to 1 is provided in the figure below,
Document Page
8STOCK PRICING
Figure 7: Maximum Information Ratio and Beta equal to 1
Source: By the Author
Part d:
The portfolio with the maximum amount of Sharpe ratio is calculated and highlighted
in the figure below,
Document Page
9STOCK PRICING
Figure 8: Maximum Amount of Sharpe Ratio
Source: By the Author
Answer to Question 5:
The portfolio which is constructed using the maximum amount of alpha provides the
highest level of return at 22.92%, while the alpha return is 19.27%. The standard deviation of
the portfolio is 22.93%, which is almost equal to the return of the portfolio. The tracking
error of the portfolio is 19.044% and the information ratio of the portfolio is 1.0123, while
the portfolio beta is 2. The Sharpe ratio of the portfolio is 0.9844 which is close to 1. The
portfolio which is to reduce the amount of tracking error, advises investment of 100% in only
one stock. The standard deviation of the portfolio is 5.24%, while the return from the
portfolio is 5.244% providing an alpha return of 1.5929%. The tracking error of the portfolio
is 0.3726%, while the beta of the portfolio has reduced to less than 1 at 0.95. The information
tabler-icon-diamond-filled.svg

Paraphrase This Document

Need a fresh take? Get an instant paraphrase of this document with our AI Paraphraser
Document Page
10STOCK PRICING
ratio is however, the highest at 4.2749, while the Sharpe ratio is 0.9318. Thus both the above
portfolio are not feasible for Epeus portfolio management since they provide concentration
risk. One of the portfolio increases the risk of the investment, while another reduces the
return and the Sharpe Ratio of the fund.
The third portfolio increases the information ratio of the company along with the
Sharpe ratio of the portfolio. The alpha return is also increased at 2.16%, while the tracking
error of the portfolio is low at 0.54%. The Beta of the portfolio is taken as a constant at 1,
while the actual portfolio return is 5.8172%.
The fourth portfolio has the highest Sharpe Ratio at 1.7866, while the information
ratio is 2.0188 and the Beta is 0.79. The alpha return is 3.4539% and the tracking error is
1.710% and the standard deviation of the portfolio is 3.78%.
Thus, the portfolio which requires the Sharpe Ratio to be maximized is the most
optimal portfolio which should be taken by the portfolio company which can be said Portfolio
D is the portfolio which should be selected by the company. The improvements which can be
done by the Epeus is by adding more constraints in the selection process. There should be a
stock screener which would further choose the stock which has passed the initial screener.
Also, various risk profiling of the investors can be taken in the stock selection process, so as
to select stocks which are within the risk tolerance level of the investor. The stocks which are
selected provide diversification benefits to the portfolio, by reducing the risk while
maximizing the return. Thus the correlation among the stocks which are selected should be
low.
Answer to Question 6:
Part a:
Document Page
11STOCK PRICING
The average return on the stock and the standard deviation of the stock, along with the
correlation matrix is highlighted in the figure below,
Figure 9: Average Return and Correlation
Source: By the Author
Part b:
The portfolio with different weights and relevant measures have been calculated and
provided in the figure below,
Figure 10:
Source:
Part c and d:
The capital allocation line and the efficient frontier of the portfolio is provided in the
figure below. Thus the, portfolio for a risk averse investor is to invest at the risk free rate of
1.5%, while risk seeking investor can invest in any of the portfolio in the northwest corner of
the graph. The risk neutral investor can invest in any of the portfolio.
chevron_up_icon
1 out of 15
circle_padding
hide_on_mobile
zoom_out_icon
[object Object]