Business Analysis: Landscape Analysis and Affinity Diagram Report

Verified

Added on  2021/08/03

|12
|671
|339
Report
AI Summary
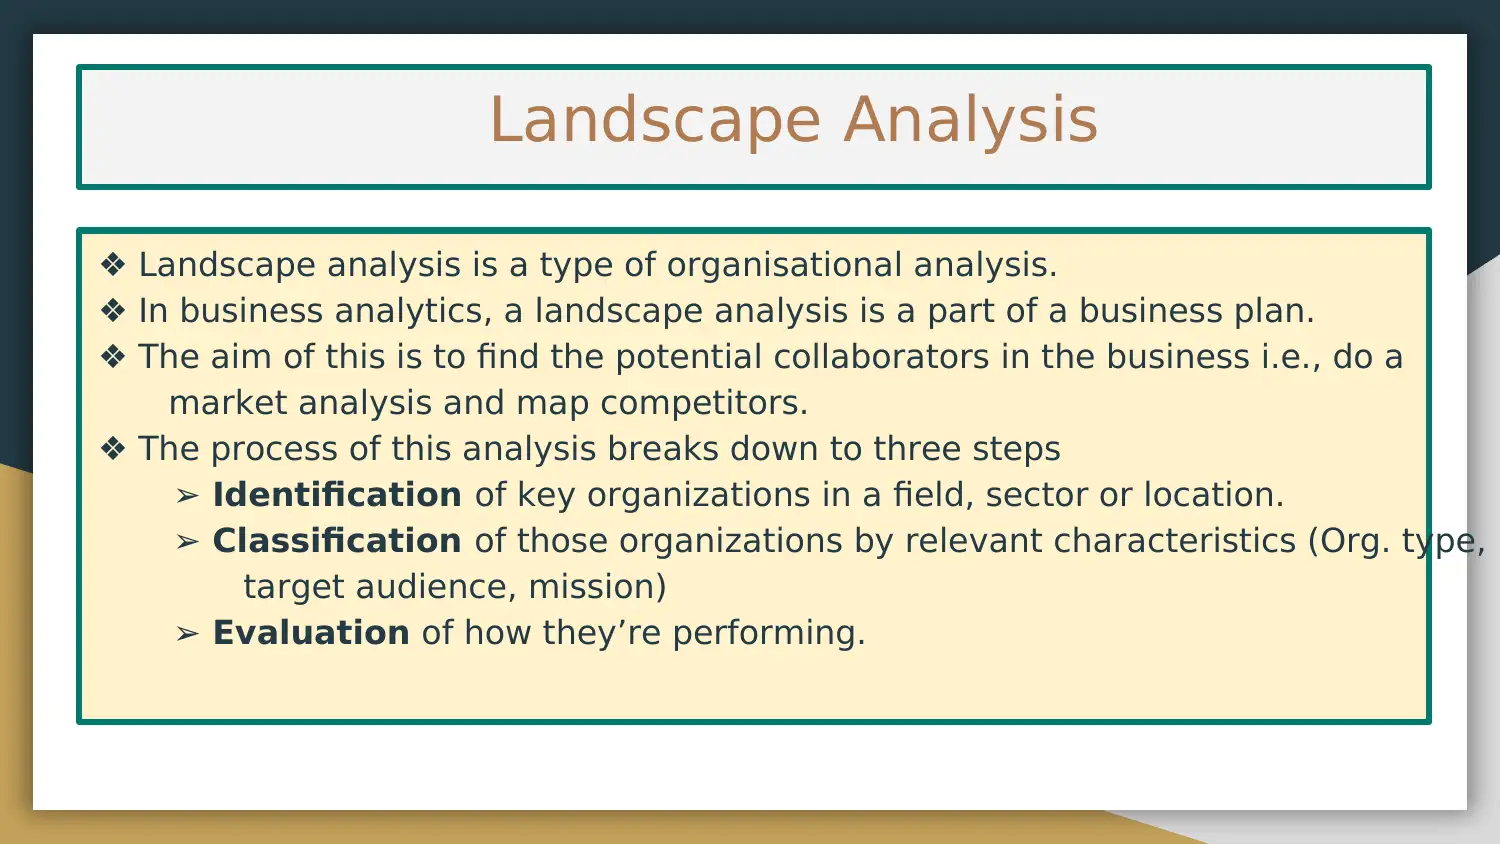
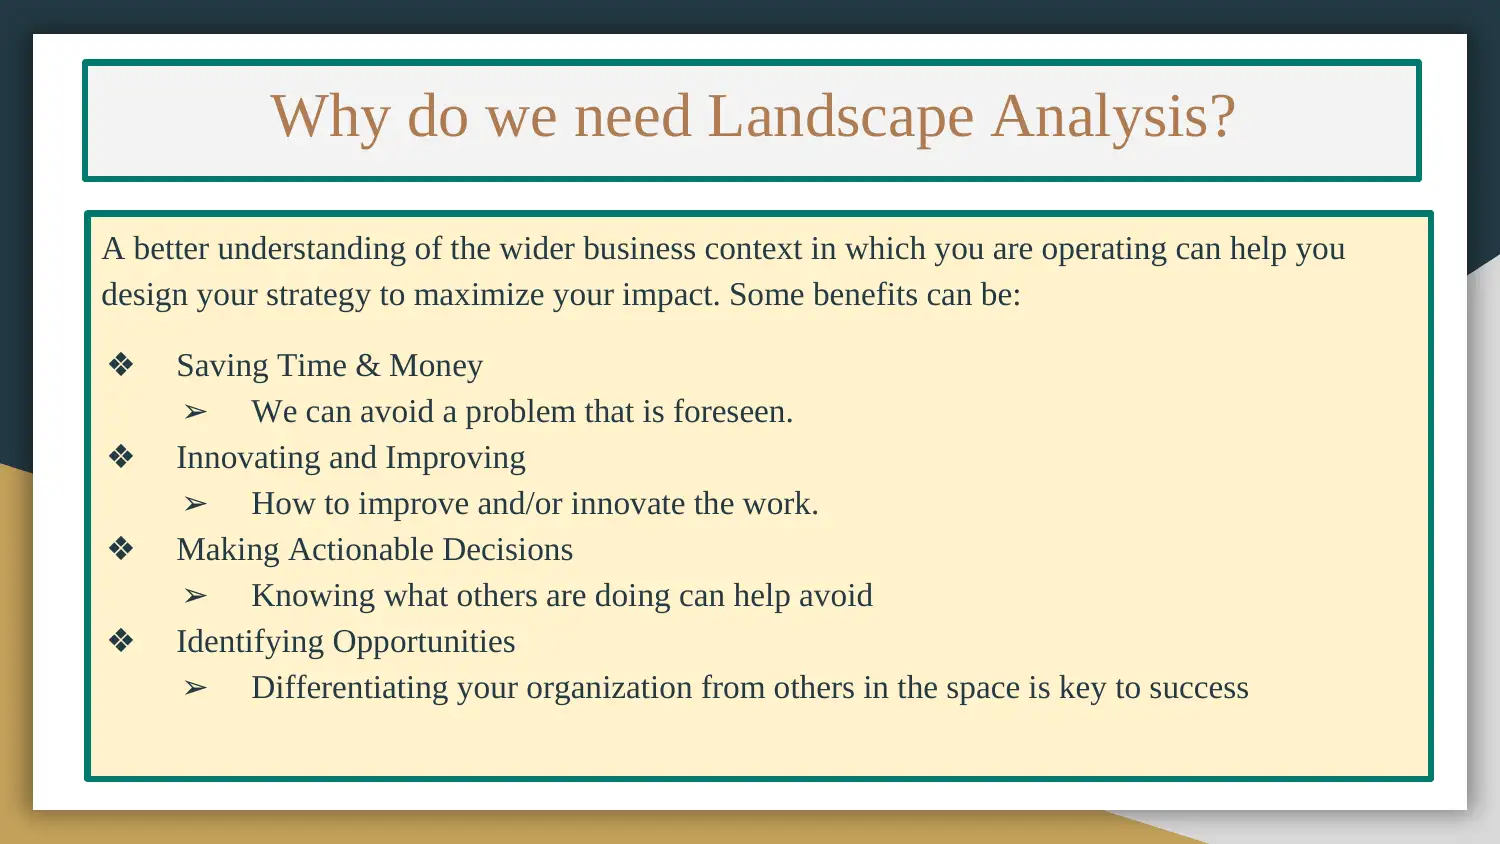
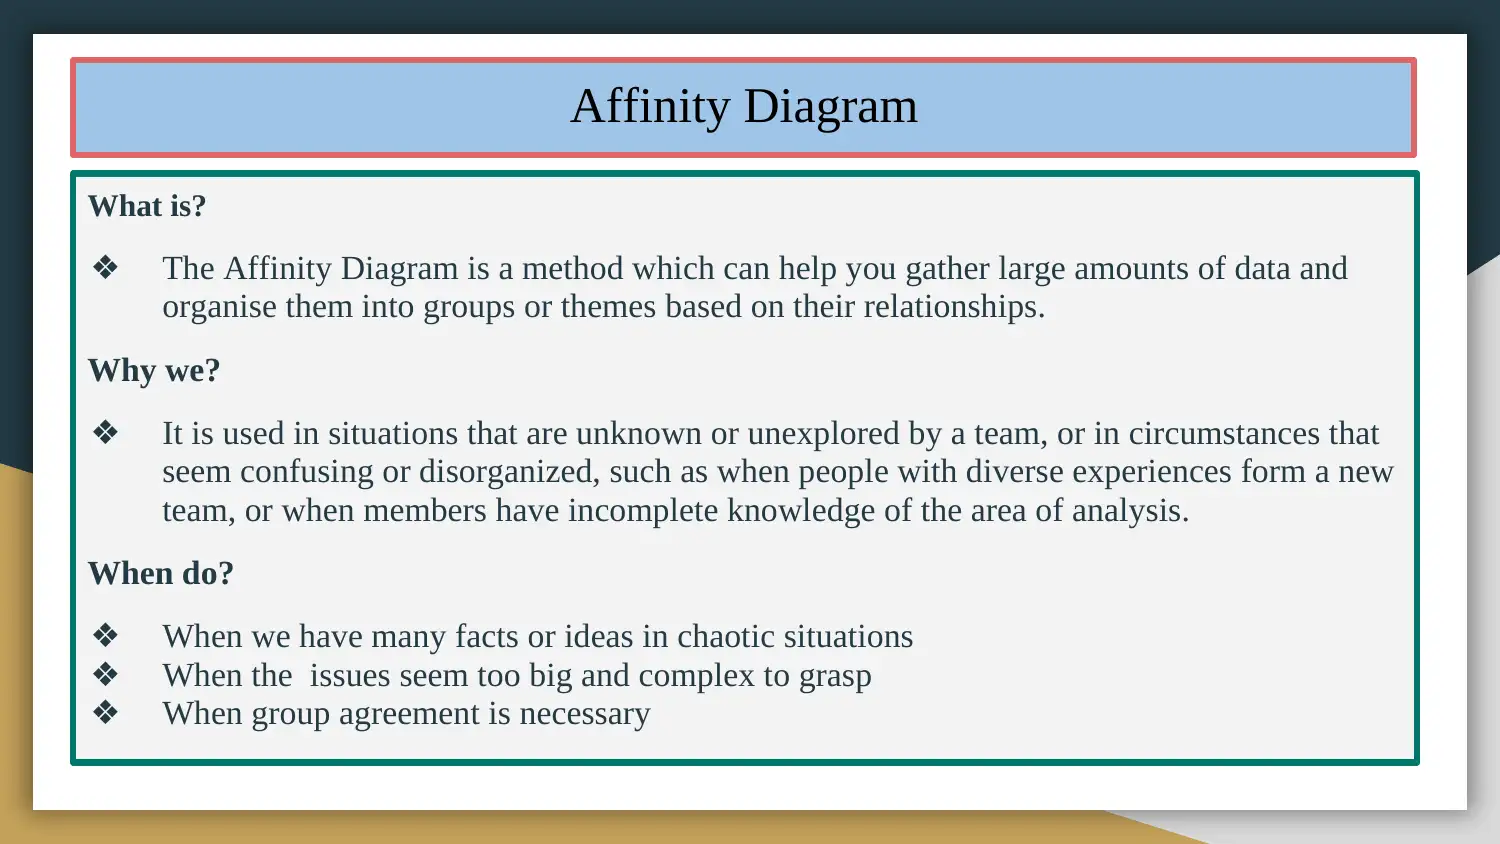
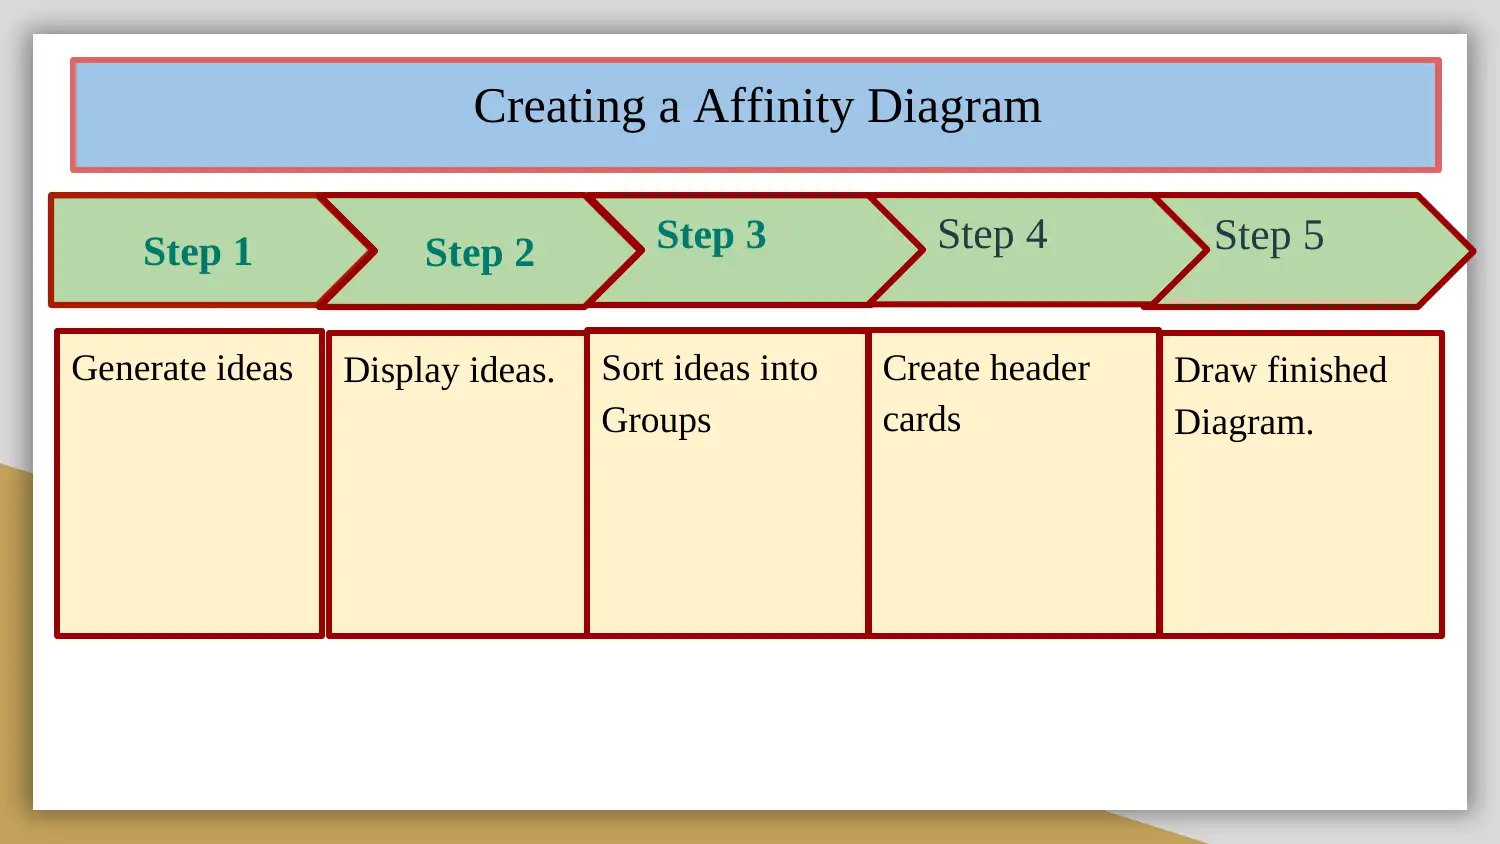
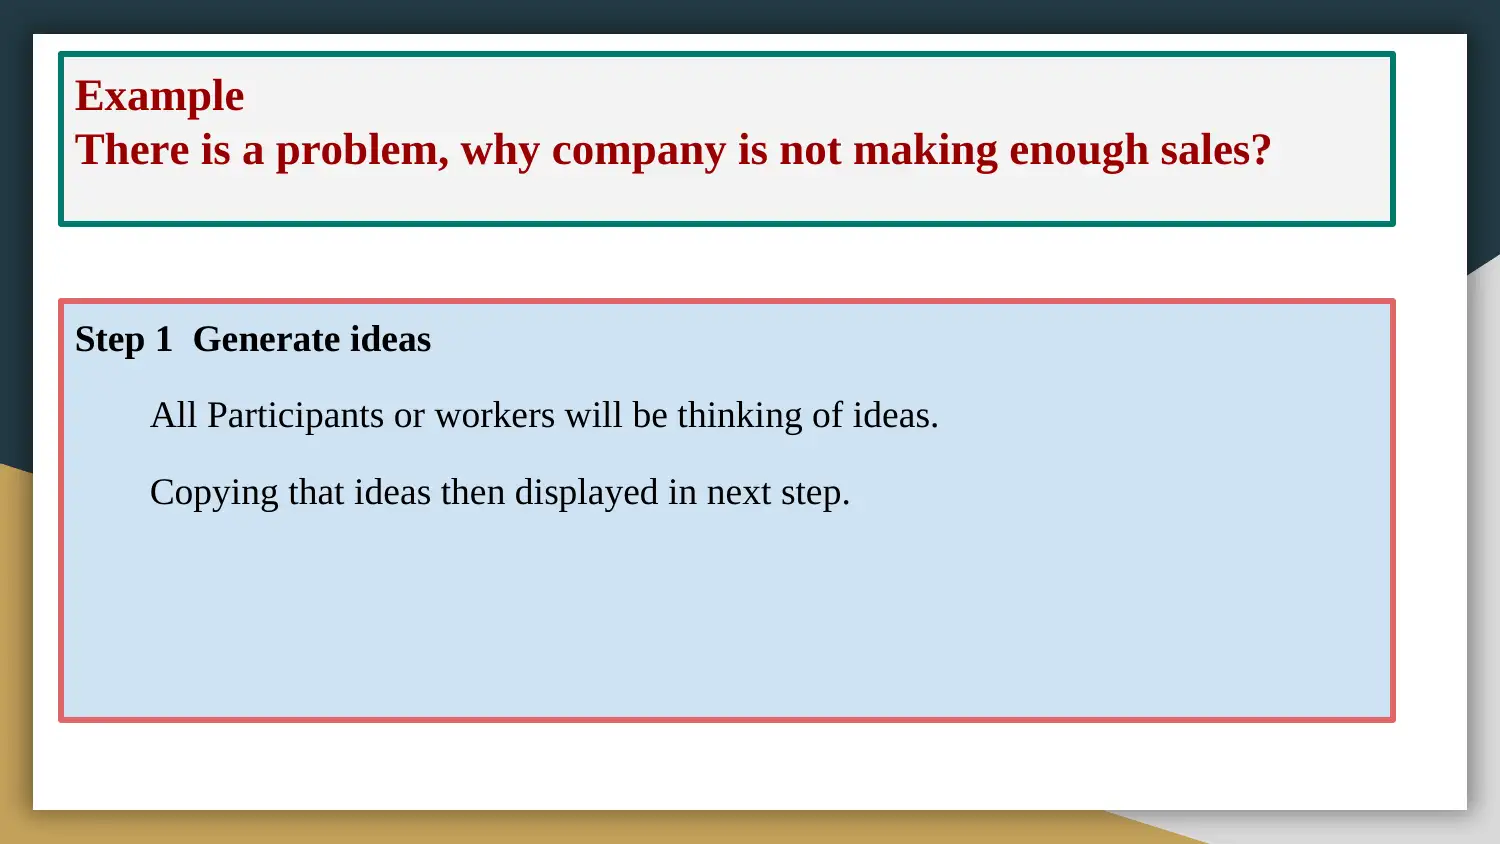
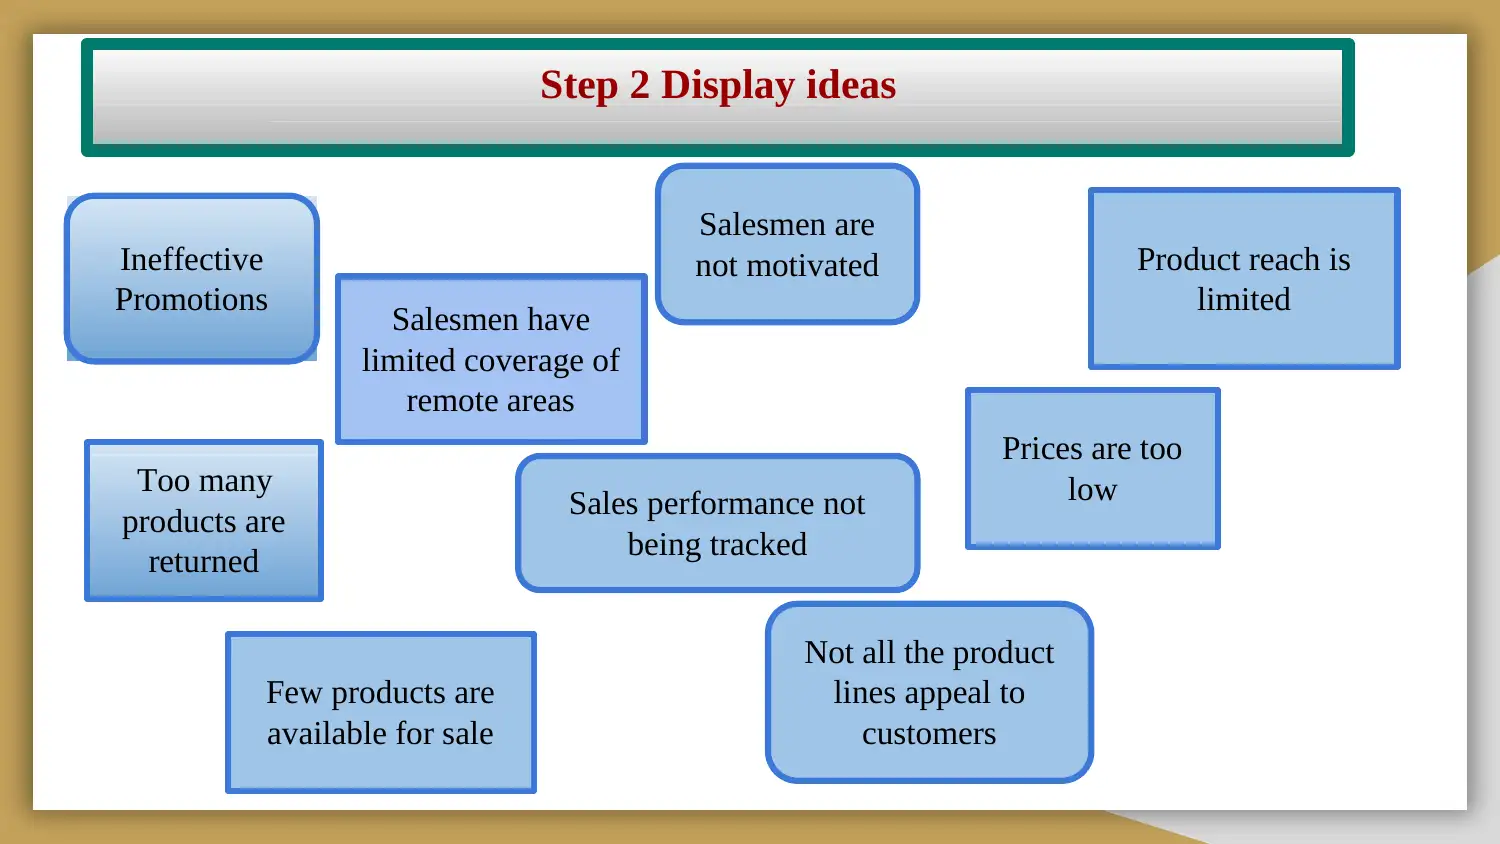
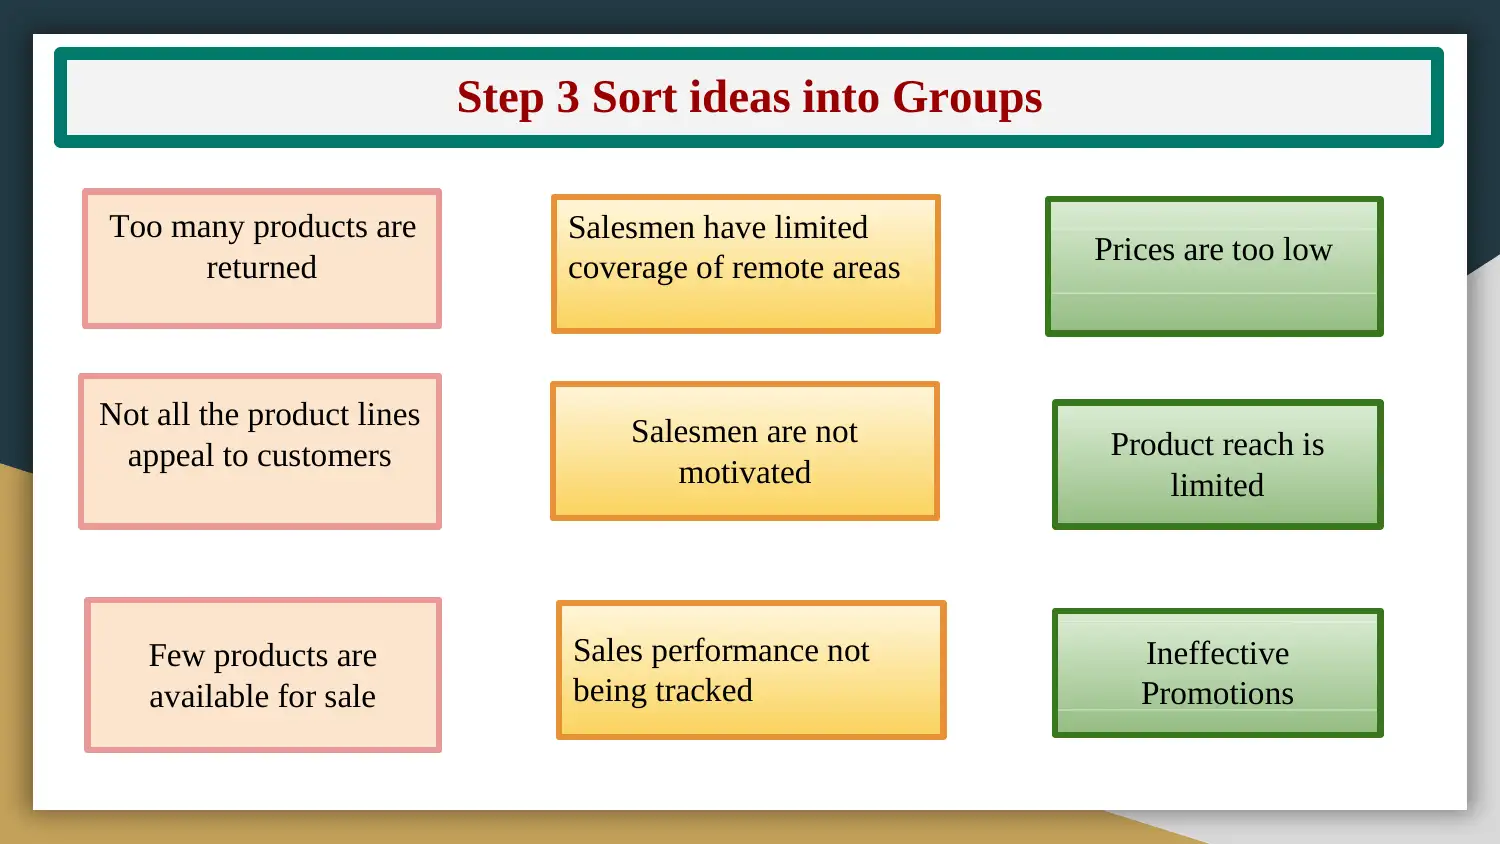
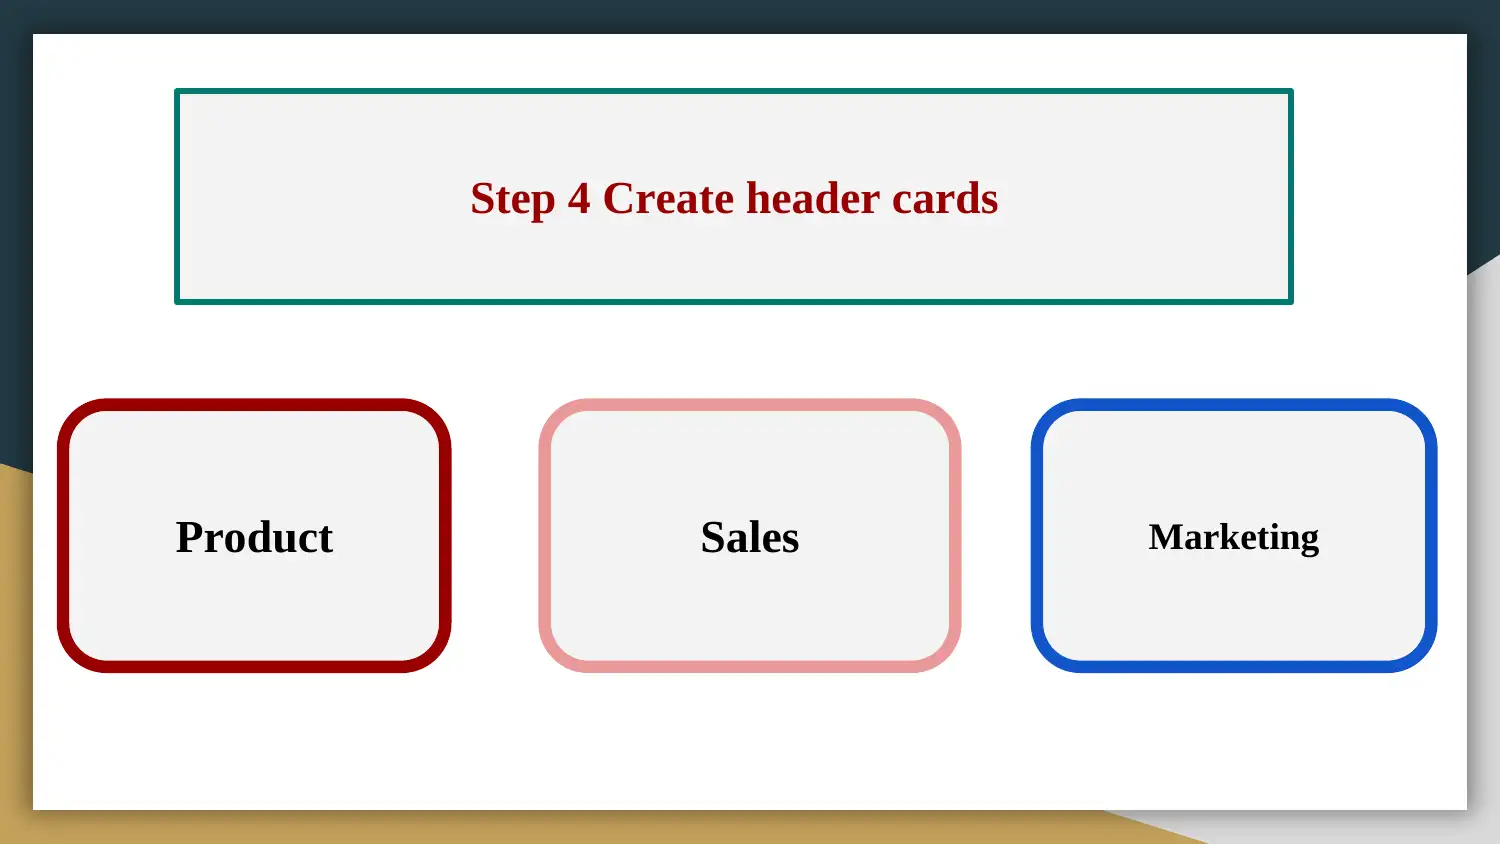
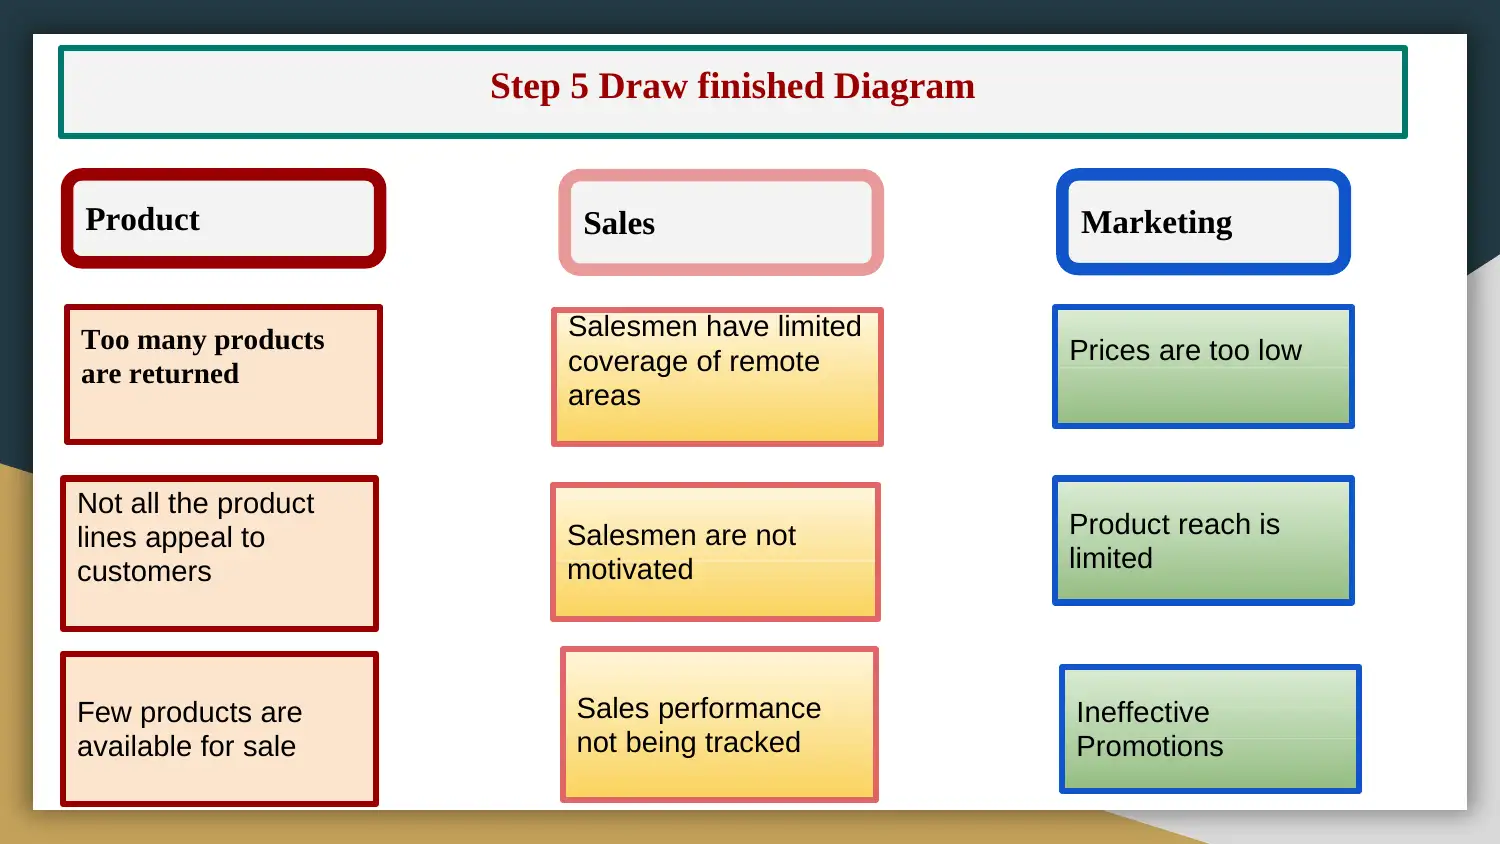
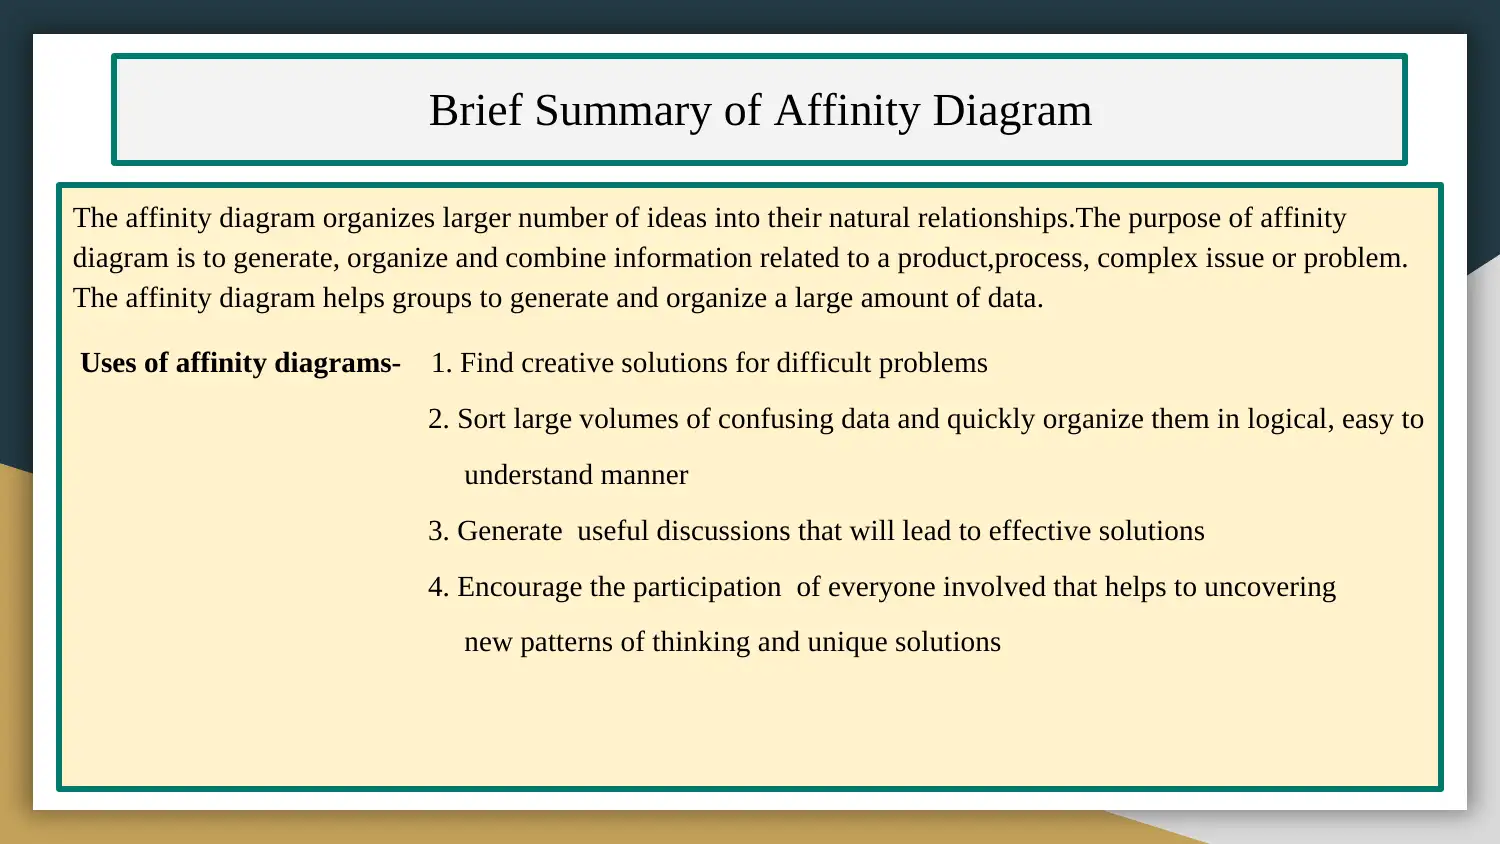
This report delves into the concepts of landscape analysis and affinity diagrams, crucial tools in business development. Landscape analysis, as presented in the report, involves assessing the broader business environment, identifying key organizations, classifying them, and evaluating their performance. It highlights the benefits of this analysis, such as time and cost savings, innovation opportunities, informed decision-making, and identification of opportunities. The report then explains the affinity diagram, a method for organizing large datasets and complex issues, particularly useful when dealing with ambiguous situations. It outlines the steps involved in creating an affinity diagram, from generating ideas to creating header cards and drawing the final diagram, with a practical example illustrating its application in addressing sales problems. Finally, the report summarizes the uses of affinity diagrams in finding creative solutions, organizing data, generating discussions, and encouraging participation, making it a valuable resource for anyone seeking to improve their business analysis and strategic planning skills.
Document Page
Landscape Analysis
Use affinity diagrams to categorize and prioritize
business needs and issues
tabler-icon-diamond-filled.svg

Paraphrase This Document

Need a fresh take? Get an instant paraphrase of this document with our AI Paraphraser
Document Page
Landscape Analysis
Landscape analysis is a type of organisational analysis.
In business analytics, a landscape analysis is a part of a business plan.
The aim of this is to find the potential collaborators in the business i.e., do a
market analysis and map competitors.
The process of this analysis breaks down to three steps
Identification of key organizations in a field, sector or location.
Classification of those organizations by relevant characteristics (Org. type,
target audience, mission)
Evaluation of how they’re performing.
Document Page
Why do we need Landscape Analysis?
A better understanding of the wider business context in which you are operating can help you
design your strategy to maximize your impact. Some benefits can be:
Saving Time & Money
We can avoid a problem that is foreseen.
Innovating and Improving
How to improve and/or innovate the work.
Making Actionable Decisions
Knowing what others are doing can help avoid
Identifying Opportunities
Differentiating your organization from others in the space is key to success
Document Page
Affinity Diagram
What is?
The Affinity Diagram is a method which can help you gather large amounts of data and
organise them into groups or themes based on their relationships.
Why we?
It is used in situations that are unknown or unexplored by a team, or in circumstances that
seem confusing or disorganized, such as when people with diverse experiences form a new
team, or when members have incomplete knowledge of the area of analysis.
When do?
When we have many facts or ideas in chaotic situations
When the issues seem too big and complex to grasp
When group agreement is necessary
tabler-icon-diamond-filled.svg

Paraphrase This Document

Need a fresh take? Get an instant paraphrase of this document with our AI Paraphraser
Document Page
Step 1
Generate ideas
Step 2
Display ideas.
Step 3
Sort ideas into
Groups
Step 5
Draw finished
Diagram.
Step 4
Create header
cards
Creating a Affinity Diagram
Document Page
Example
There is a problem, why company is not making enough sales?
Step 1 Generate ideas
All Participants or workers will be thinking of ideas.
Copying that ideas then displayed in next step.
Document Page
Step 2 Display ideas
Ineffective
Promotions Salesmen have
limited coverage of
remote areas
Not all the product
lines appeal to
customers
Product reach is
limited
Too many
products are
returned
Salesmen are
not motivated
Sales performance not
being tracked
Prices are too
low
Few products are
available for sale
tabler-icon-diamond-filled.svg

Paraphrase This Document

Need a fresh take? Get an instant paraphrase of this document with our AI Paraphraser
Document Page
Step 3 Sort ideas into Groups
Too many products are
returned
Not all the product lines
appeal to customers
Few products are
available for sale
Salesmen have limited
coverage of remote areas
Salesmen are not
motivated
Sales performance not
being tracked
Prices are too low
Product reach is
limited
Ineffective
Promotions
Document Page
Step 4 Create header cards
Product Sales Marketing
Document Page
Step 5 Draw finished Diagram
Too many products
are returned
Not all the product
lines appeal to
customers
Few products are
available for sale
Salesmen have limited
coverage of remote
areas
Salesmen are not
motivated
Sales performance
not being tracked
Prices are too low
Product reach is
limited
Ineffective
Promotions
Product Sales Marketing
tabler-icon-diamond-filled.svg

Paraphrase This Document

Need a fresh take? Get an instant paraphrase of this document with our AI Paraphraser
Document Page
Brief Summary of Affinity Diagram
The affinity diagram organizes larger number of ideas into their natural relationships.The purpose of affinity
diagram is to generate, organize and combine information related to a product,process, complex issue or problem.
The affinity diagram helps groups to generate and organize a large amount of data.
Uses of affinity diagrams- 1. Find creative solutions for difficult problems
2. Sort large volumes of confusing data and quickly organize them in logical, easy to
understand manner
3. Generate useful discussions that will lead to effective solutions
4. Encourage the participation of everyone involved that helps to uncovering
new patterns of thinking and unique solutions
Document Page
THANK YOU
chevron_up_icon
1 out of 12
circle_padding
hide_on_mobile
zoom_out_icon
[object Object]