AFIN270 Assignment: Analyzing Probability, Correlation, and Modeling

Verified

Added on  2022/11/26

|7
|1079
|355
Homework Assignment
AI Summary
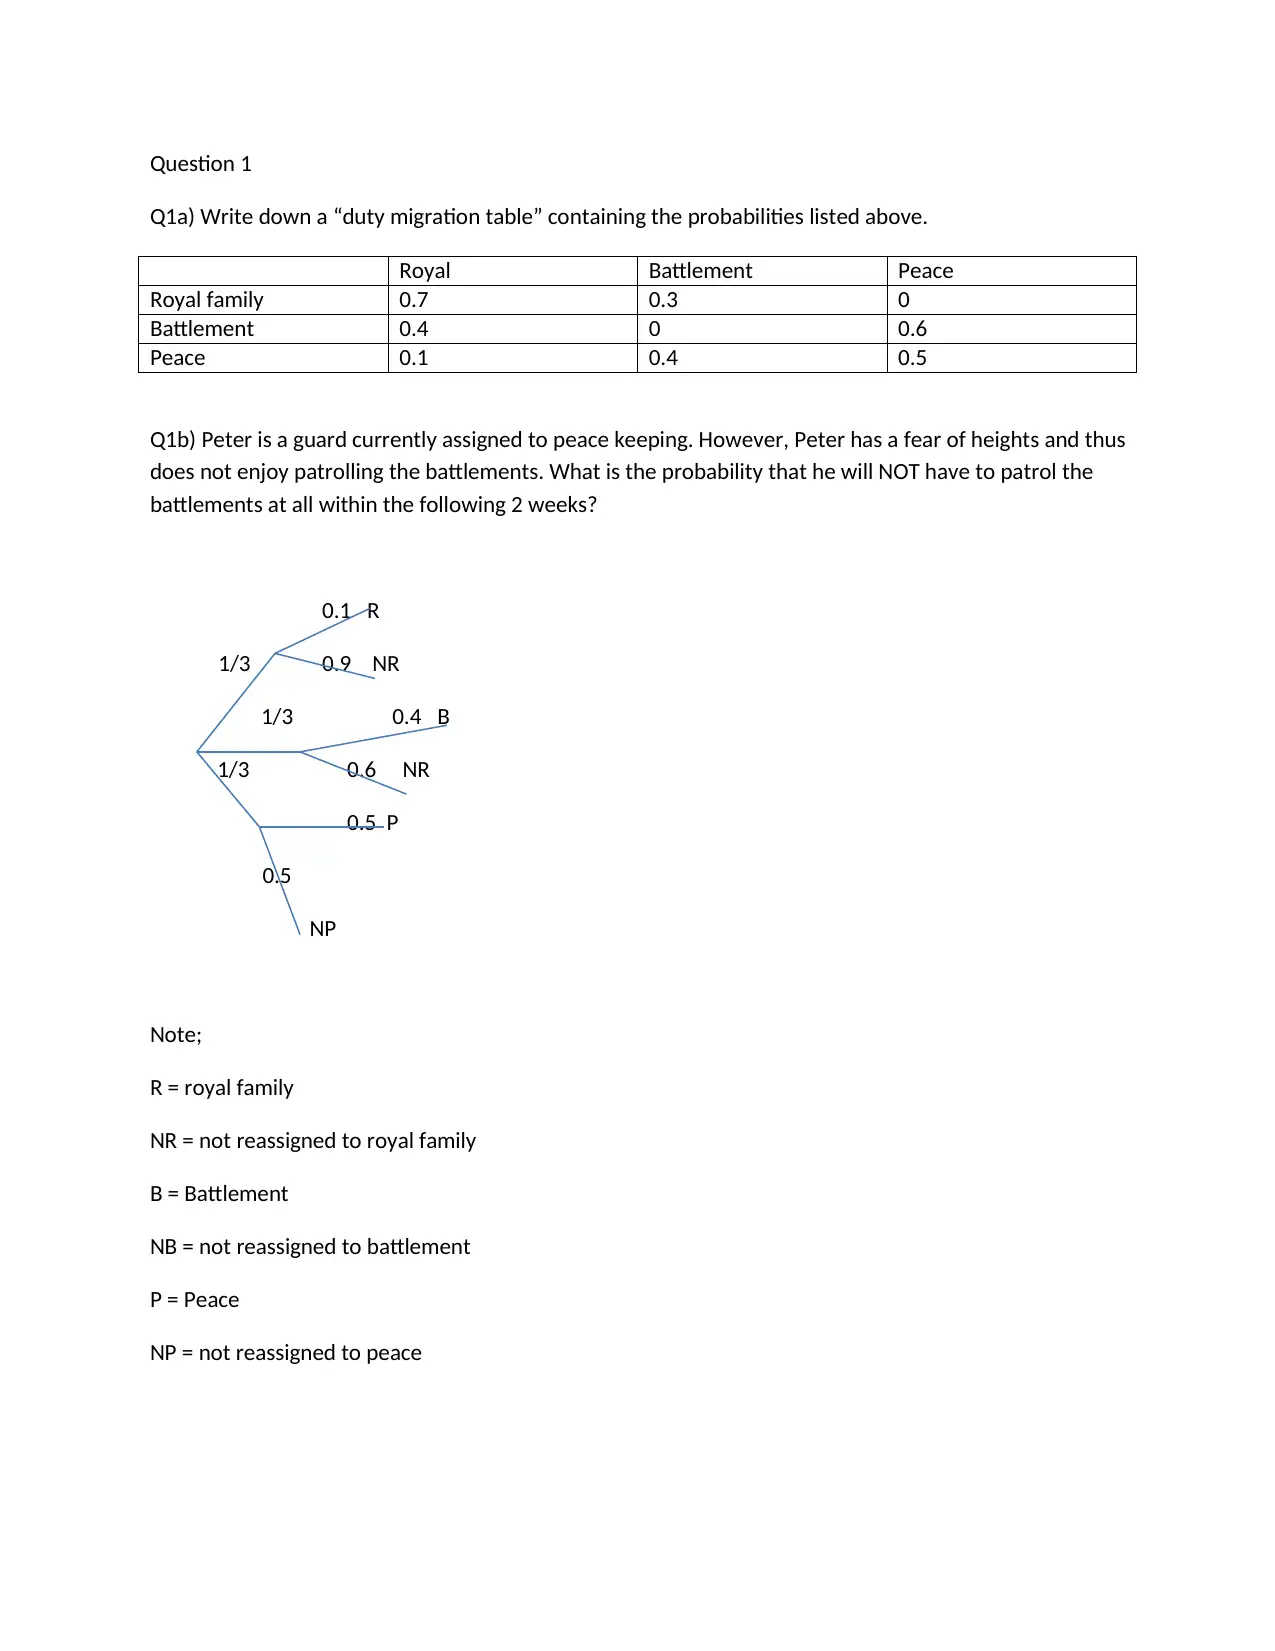
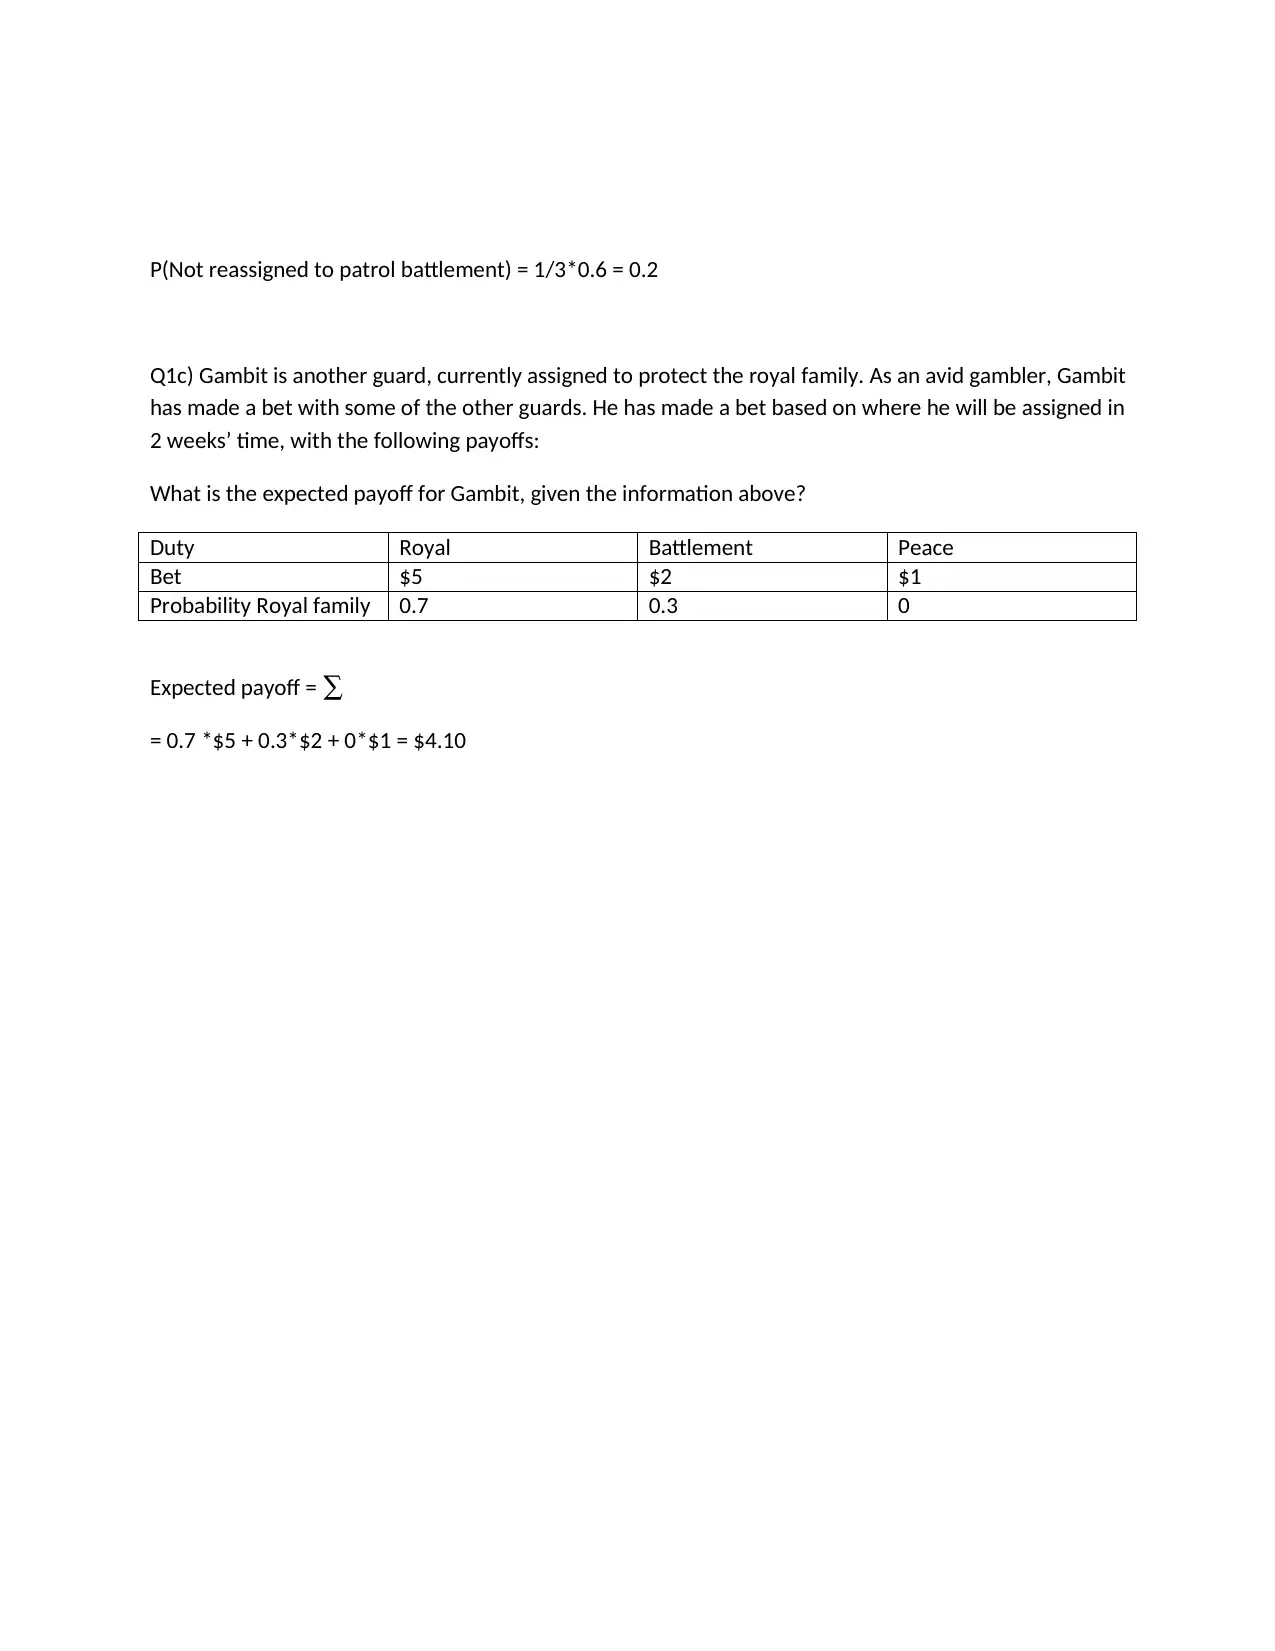
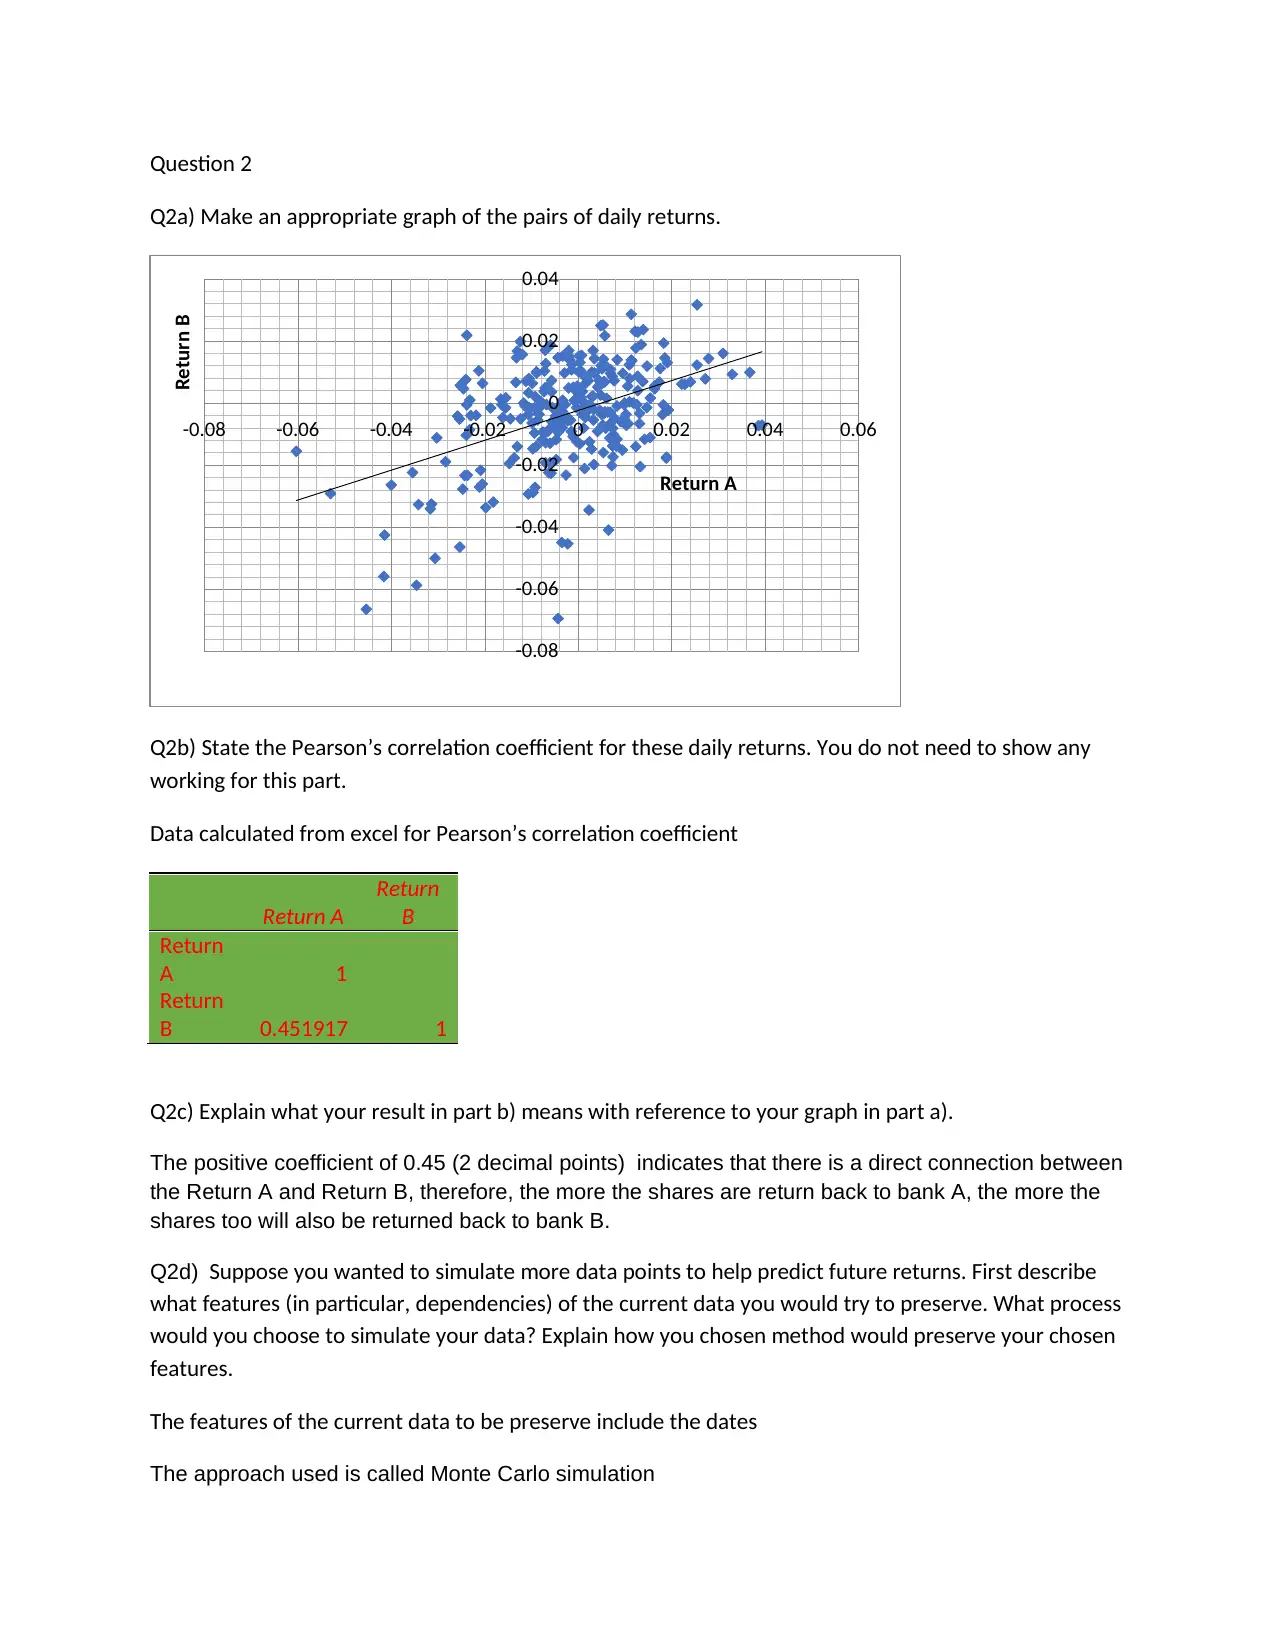
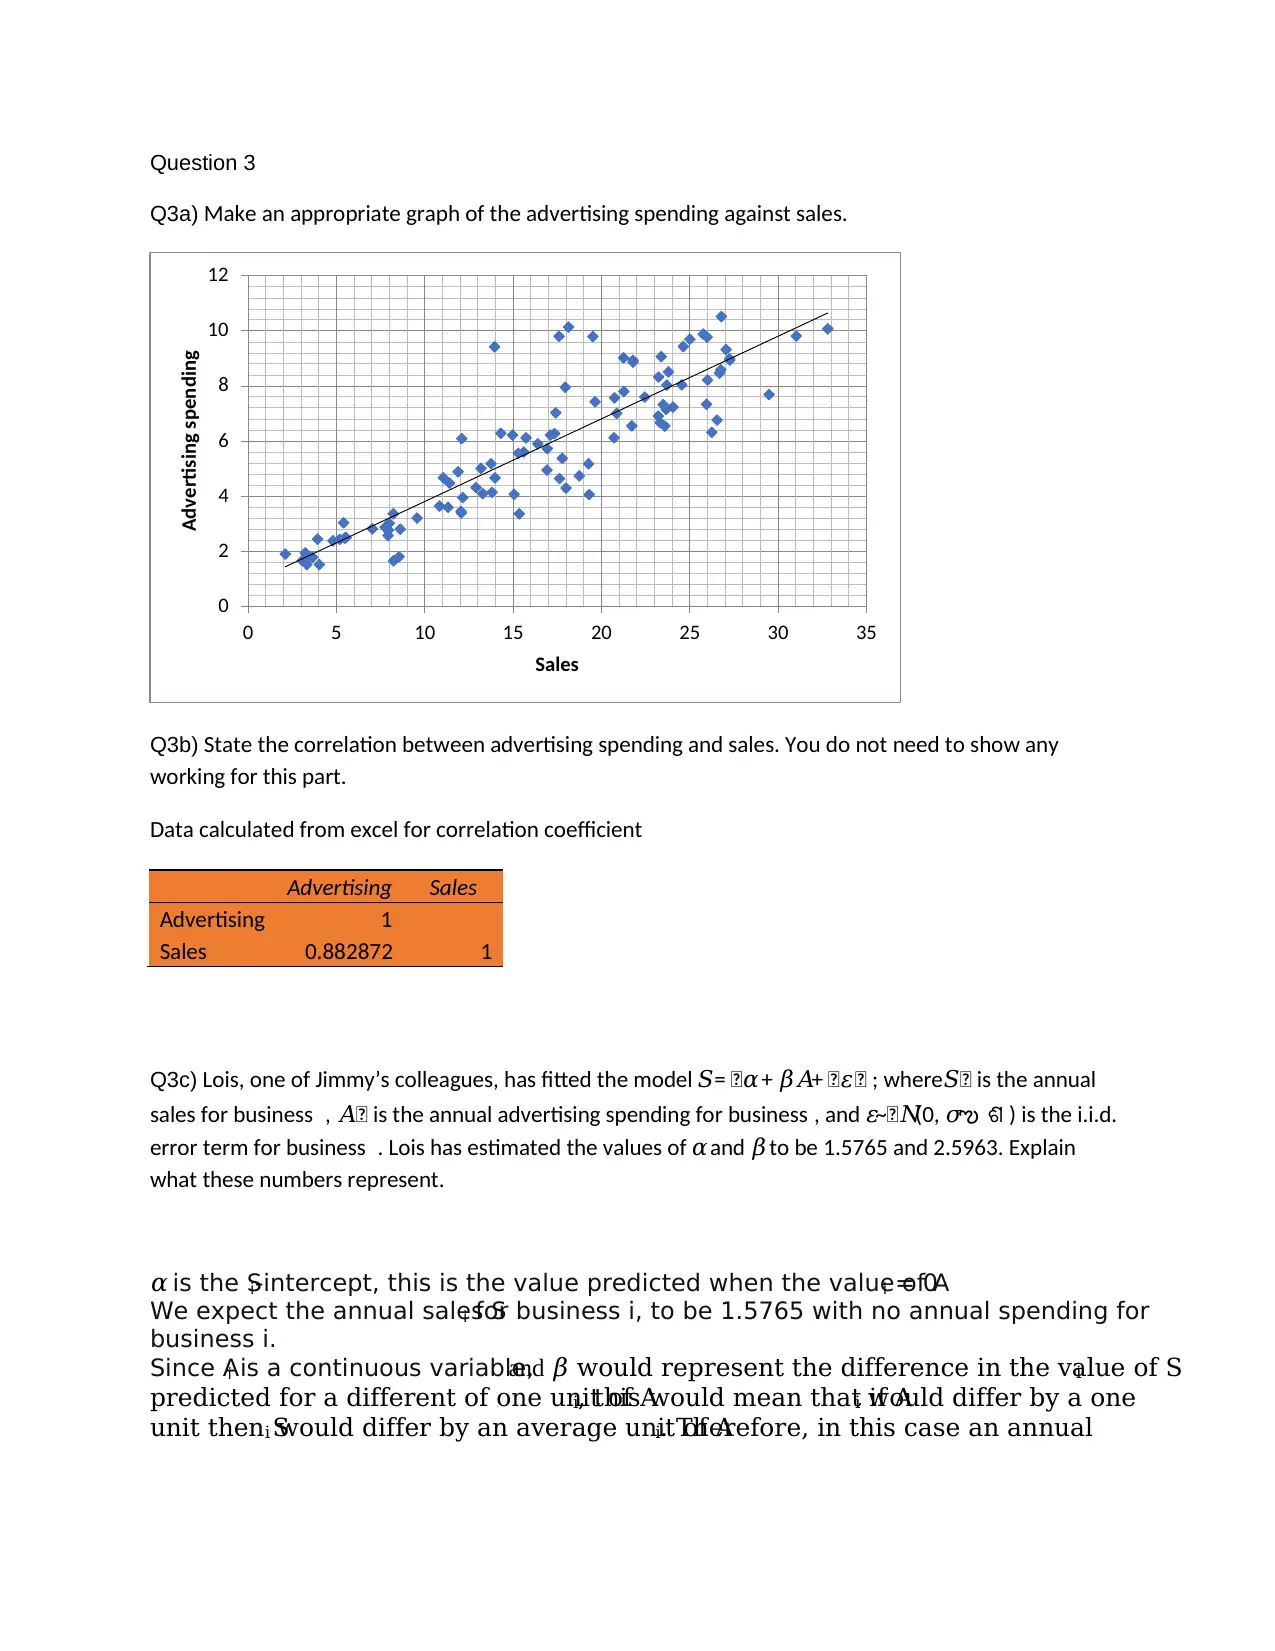
This assignment solution for AFIN270 covers a range of financial concepts including probability, correlation, and statistical modeling. Question 1 explores probability calculations related to a guard's duties in Camelot, including the construction of a duty migration table and the calculation of probabilities for specific scenarios. Question 2 delves into the analysis of daily returns for two assets, involving the creation of a scatter plot, the calculation and interpretation of Pearson's correlation coefficient, and a discussion of data simulation techniques using Monte Carlo methods to preserve data features. Question 3 focuses on the relationship between advertising spending and sales, including the creation of a scatter plot, the calculation of the correlation coefficient, and the interpretation of a linear regression model's parameters and assumptions. Finally, Question 4 examines the application of a Fréchet distribution to model monthly returns for shares, involving the derivation of the cumulative distribution function (CDF) and the calculation of probabilities based on the given distribution parameters. The solution demonstrates a practical application of statistical methods to financial problems.
tabler-icon-diamond-filled.svg

Contribute Materials

Your contribution can guide someone’s learning journey. Share your documents today.
Document Page
Question 1
Q1a) Write down a “duty migration table” containing the probabilities listed above.
Royal Battlement Peace
Royal family 0.7 0.3 0
Battlement 0.4 0 0.6
Peace 0.1 0.4 0.5
Q1b) Peter is a guard currently assigned to peace keeping. However, Peter has a fear of heights and thus
does not enjoy patrolling the battlements. What is the probability that he will NOT have to patrol the
battlements at all within the following 2 weeks?
0.1 R
1/3 0.9 NR
1/3 0.4 B
1/3 0.6 NR
0.5 P
0.5
NP
Note;
R = royal family
NR = not reassigned to royal family
B = Battlement
NB = not reassigned to battlement
P = Peace
NP = not reassigned to peace
tabler-icon-diamond-filled.svg

Secure Best Marks with AI Grader

Need help grading? Try our AI Grader for instant feedback on your assignments.
Document Page
P(Not reassigned to patrol battlement) = 1/3*0.6 = 0.2
Q1c) Gambit is another guard, currently assigned to protect the royal family. As an avid gambler, Gambit
has made a bet with some of the other guards. He has made a bet based on where he will be assigned in
2 weeks’ time, with the following payoffs:
What is the expected payoff for Gambit, given the information above?
Duty Royal Battlement Peace
Bet $5 $2 $1
Probability Royal family 0.7 0.3 0
Expected payoff =
= 0.7 *$5 + 0.3*$2 + 0*$1 = $4.10
Document Page
Question 2
Q2a) Make an appropriate graph of the pairs of daily returns.
Q2b) State the Pearson’s correlation coefficient for these daily returns. You do not need to show any
working for this part.
Data calculated from excel for Pearson’s correlation coefficient
Return A
Return
B
Return
A 1
Return
B 0.451917 1
Q2c) Explain what your result in part b) means with reference to your graph in part a).
The positive coefficient of 0.45 (2 decimal points) indicates that there is a direct connection between
the Return A and Return B, therefore, the more the shares are return back to bank A, the more the
shares too will also be returned back to bank B.
Q2d) Suppose you wanted to simulate more data points to help predict future returns. First describe
what features (in particular, dependencies) of the current data you would try to preserve. What process
would you choose to simulate your data? Explain how you chosen method would preserve your chosen
features.
The features of the current data to be preserve include the dates
The approach used is called Monte Carlo simulation
-0.08
-0.06
-0.04
-0.02
0
0.02
0.04
-0.08 -0.06 -0.04 -0.02 0 0.02 0.04 0.06
Return B
Return A
Document Page
To generate the random numbers in excel we use the two functions
1. RAND ( ): generating random numbers from 0 and 1
2. RANDBETWEEN(a, b): generating random numbers from the integers between a and b
To avoid the random numbers generated from changing on excel we enter RAND ( ) on the bar
formula and press the key function F9. Similarly, copy the random numbers generated using Ctrl-C
and paste on the same location.
RANDBETWEEN would only generate integer values.
tabler-icon-diamond-filled.svg

Secure Best Marks with AI Grader

Need help grading? Try our AI Grader for instant feedback on your assignments.
Document Page
Question 3
Q3a) Make an appropriate graph of the advertising spending against sales.
Q3b) State the correlation between advertising spending and sales. You do not need to show any
working for this part.
Data calculated from excel for correlation coefficient
Advertising Sales
Advertising 1
Sales 0.882872 1
Q3c) Lois, one of Jimmy’s colleagues, has fitted the model 𝑆 = 𝛼 + 𝛽𝐴 + 𝜀 ; where𝑆 is the annual
sales for business , 𝐴 is the annual advertising spending for business , and 𝜀 ~ 𝑁(0, 𝜎 ) is the i.i.d.
error term for business . Lois has estimated the values of 𝛼 and 𝛽 to be 1.5765 and 2.5963. Explain
what these numbers represent.
𝛼 is the Si-intercept, this is the value predicted when the value of Ai = 0
We expect the annual sales Si for business i, to be 1.5765 with no annual spending for
business i.
Since Ai is a continuous variable,and 𝛽 would represent the difference in the value of Si
predicted for a different of one unit of Ai, this would mean that if Ai would differ by a one
unit then Si would differ by an average unit of Ai. Therefore, in this case an annual
0
2
4
6
8
10
12
0 5 10 15 20 25 30 35
Advertising spending
Sales
Document Page
advertising spending for business i, would on average be equivalent to 2.5963 annual sal
for the prior an annual advertising spending.
Q3d)Under Lois’ model, state explicitly the assumptions for 𝜀i. From the graph, does the data
seem to match the assumptions required? Explain your answer.
The mean residual value is equivalent to zero = sum/n = 0/n = 0
The sum of the residuals is always zero for the line of best fit
The variance for error term = 𝜎ϵ
From the graph
The dots are tightly adhered to the zero baselines; therefore the regression is accurately reasonable
-15
-10
-5
0
5
10
0 2 4 6 8 10 12
residual errors
Document Page
Question 4
Q4) Clint is modelling the monthly returns for shares in Stork Industrial using a Fréchet distribution. He
believes the return 𝑅follows a 𝐺𝐸𝑉(0.03,0.02,0.015) distribution.
a) Write down the CDF for this distribution, and then state clearly what this function represents.
The cumulative distribution function of a GEV is
F(R; [ ( )]
F(R; 0.03, 0.02, 0.015) = [ ( )]
= [ ( )]
b) Using part a) or otherwise, calculate Pr(𝑅> 10%). Show all steps of working.
Pr(R > 10%)
= 1 – p(
= 1 - [ ( )]
= 1 – 0.3679 = 0.6321
chevron_up_icon
1 out of 7
circle_padding
hide_on_mobile
zoom_out_icon
logo.png

Your All-in-One AI-Powered Toolkit for Academic Success.

Available 24*7 on WhatsApp / Email

[object Object]