Business Expansion Strategy: Data Analysis of Kenya and South Africa
VerifiedAdded on 2023/06/10
|11
|3289
|500
Report
AI Summary
This report analyzes data from the World Bank Enterprise survey to assess the feasibility of business expansion in Kenya and South Africa. It examines factors such as political instability, customs and trade regulations, business licensing permits, access to finance, and labor regulations. Using measures of central tendency (mean, median, and mode), the analysis compares the challenges faced by businesses in each country based on a five-point Likert scale. The findings indicate varying degrees of obstacles in each category, providing insights for businesses to make informed decisions about their expansion strategy. Desklib offers a range of similar solved assignments and study resources for students.
Using Data to Build
Business Practice
Business Practice
Paraphrase This Document
Need a fresh take? Get an instant paraphrase of this document with our AI Paraphraser
Contents
INTRODUCTION...........................................................................................................................3
MAIN BODY..................................................................................................................................3
Examine the material supplied to acquire a better grasp of what the company need..................3
Choose the questions company wants to look into to get the information they need..................5
Analyse the data for the questions company has chosen using the relevant summary statistic.. 6
Findings and recommendations...................................................................................................9
CONCLUSION..............................................................................................................................10
REFERENCES..............................................................................................................................11
INTRODUCTION
Understanding what big data can help an organisation achieve is the key to using it effectively.
While marketing and e-commerce are commonly connected with big data, it would be a mistake
to suppose that data is limited to those industries. Businesses in a variety of industries may
benefit from data in a variety of ways, with appropriate analysis allowing a firm to differentiate
itself from its competitors. Such approaches can also be used to detect probable mistakes or fraud
before they happen, especially in the financial industry. The aim of e-commerce giants like
Amazon and Wal-Mart is to leverage data to their advantage (Kotu, and Deshpande, 2018).
These businesses gain a better understanding of their customers, their habits, and their
requirements by carefully analysing their users' browsing history. This data is subsequently put
to good use to guarantee that the company's earnings are maximised. The information also allows
the corporation to show items that certain consumers are more likely to request and purchase.
The following report highlights the case of a business which is planning to extend their business
in the market of Africa. For this same purpose, the business is analysing different factors that are
active in the countries like Kenya and South Africa. The business needs to select one country
from the two mentioned above and for this different data collected from the website of World
Bank is being analysed.
MAIN BODY
Examine the material supplied to acquire a better grasp of what the company need.
A dataset is a collection or set of data. This information is usually given in a tabular format. Each
column denotes a distinct variable. And, according to the question, each row refers to a certain
member of the data set. This is part of the data management process. Data sets represent the
values for each variable for unknown quantities such as an object's height, weight, temperature,
volume, and other characteristics, as well as the values of random numbers. This set of values is
referred to as a datum. Each row in the data collection corresponds to the data of one or more
members. Let us learn about the concept of a dataset, different types of datasets, attributes, and
more in this article, which includes many solved cases (Glass, and Cook, 2018). The data set that
is being analysed for this report is related to the two countries, South Africa and Kenya.
Different factors are being selected in the report which would provide insight to the business
⊘ This is a preview!⊘
Do you want full access?
Subscribe today to unlock all pages.
Trusted by 1+ million students worldwide
about how hard or easy it is for the business to set up their business and run their operations in
the selected country smoothly.
The data set which is being provided is a condensed version of the data obtained by the
World Bank Enterprise survey (WBES). The data collection details some of the challenges that
firms face in various regions. The data set is divided into three excel sheet. The first excel sheet
provides responses related to the South Africa, the second excel sheet provides insight related to
Kenya and the third excel sheet is the key to interpret the first two sheets. The data has been
sorted for further analysis using different tools in excel like, replace, sort, count etc. And for the
analysis part, usage of mean, mode, median is being done which will be interpreted in the
following steps.
The data set which has been provided talks a one major question which is "To what degree
are each of the following an obstacle to the current operations of this establishment?" and
different factors are talked therein, these factors are:
Labour Regulation
Inadequately Educated workforce
Access to finance
Crime, theft and disorder
Access to land
Practices of competitors in the informal sector
Transport
Customs and trade regulations
Electricity
Tax rates
Tax administration
Political instability
Corruption
Courts
Business Licensing Permit
The data which has been provided was coded in different terminologies and sorting of the
data was done to make it more presentable and understandable, using excel tools.
Paraphrase This Document
Need a fresh take? Get an instant paraphrase of this document with our AI Paraphraser
Choose the questions company wants to look into to get the information they need.
The data set have been provided with different factors which are helpful for the business to
take into consideration while making a decision related to expansion in Africa (Pierce, and et.al.,
2021). Following factors are selected for this particular analysis of the African countries:
Political instability- The authorised employment of the public force by
governments is essential for political stability. By symbolising unpredictability in
electoral politics, political instability is intimately related with the notion of a failed
state. When a government can no longer afford to provide fundamental services to
its citizens, such as security and the capacity to procure food and shelter, it loses its
authority to enforce the law, resulting in political instability (Fernando, Jabbour,
and Wah, 2019). Businesses must assess the influence of a new law enacted by a
governmental entity on their operations. Companies may be required to develop
new strategies or procedures in order to comply with legislative objectives.
Customs and trade regulations: Trade rules are laws adopted by both the federal
and state governments to encourage unrestricted corporate competition (Chan, and
et.al., 2020). Trade regulation also includes consumer protection laws, advertising
laws, trademark laws, and franchise laws.
Business Licensing Permit: A business licence is a government-issued licence that
permits people or businesses to do legitimate business within the government's
territorial authority (Rembert, and et.al., 2021).
Access to finance: A company's financial base is crucial. Finance is required to
acquire assets, products, and raw materials, as well as for other economic
operations. Let's take a closer look at the definition of business finance.
Labour Regulation: The necessary rules and regulations that businesses must
follow are known as labour law compliance. These are the rules and regulations
that govern employment. The rules that control the interaction between employees,
employers, trade unions, and the government are known as labour laws
(Kouhizadeh, Zhu, and Sarkis, 2020.). The tripartite connection between employee,
employer, and union is the subject of collective labour law. Individual labour law is
concerned with employees' rights at work, as well as the employment contract.
Access to land: Land can be utilised as a source of funding for a company. Land is
also utilised to construct a business's structure and to carry out the duties and
activities that enterprises desire, such as farming.
Analyse the data for the questions company has chosen using the relevant summary statistic.
Analysis using Measures of central tendency
The statistical metric that captures the single value of the whole distribution or dataset is
known as the central tendency. Its goal is to accurately describe all of the data in the distribution.
The average value of the dataset is represented by the mean. It may be determined by
multiplying the total of all the values in the dataset by the number of values in the dataset. It is
commonly referred to as the arithmetic mean.
The median of a dataset is the middle value, whether the dataset is sorted in ascending or
descending order. When there are an even number of items in a dataset, the median value may be
calculated by taking the mean of the middle two values (Bouwman, and et.al., 2018) .
The mode reflects the value that appears most frequently in the dataset. There are
instances when the dataset has numerous modes, and other times when it contains none at all.
The respondents were given a five point Likert Scale. The first option which were
provided to the respondents was “no obstacle”. And the fifth option was “Very severe Obstacle”.
The respondents were to choose from these five point Likert scale.
Analysis of different Factors which are to be taken into consideration while making
a decision related to expansion in Africa:
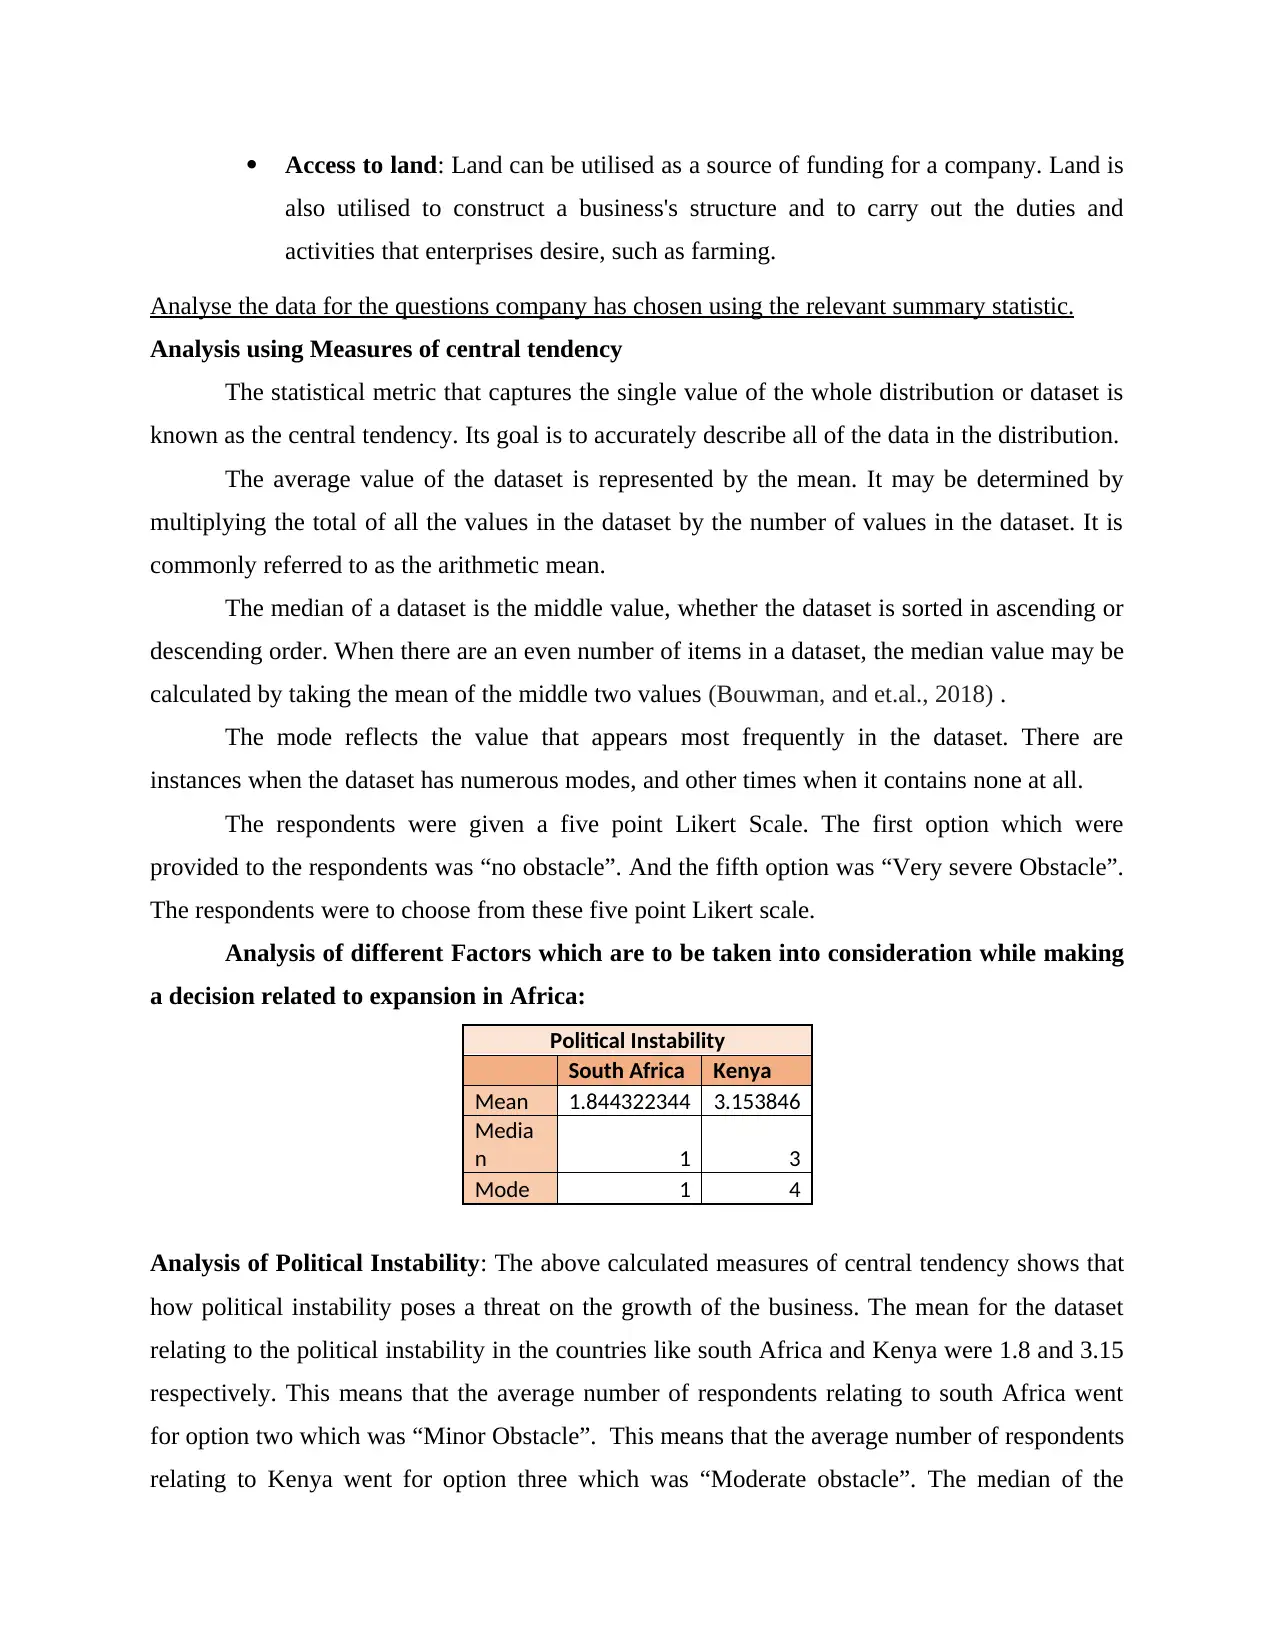
Political Instability
South Africa Kenya
Mean 1.844322344 3.153846
Media
n 1 3
Mode 1 4
Analysis of Political Instability: The above calculated measures of central tendency shows that
how political instability poses a threat on the growth of the business. The mean for the dataset
relating to the political instability in the countries like south Africa and Kenya were 1.8 and 3.15
respectively. This means that the average number of respondents relating to south Africa went
for option two which was “Minor Obstacle”. This means that the average number of respondents
relating to Kenya went for option three which was “Moderate obstacle”. The median of the
also utilised to construct a business's structure and to carry out the duties and
activities that enterprises desire, such as farming.
Analyse the data for the questions company has chosen using the relevant summary statistic.
Analysis using Measures of central tendency
The statistical metric that captures the single value of the whole distribution or dataset is
known as the central tendency. Its goal is to accurately describe all of the data in the distribution.
The average value of the dataset is represented by the mean. It may be determined by
multiplying the total of all the values in the dataset by the number of values in the dataset. It is
commonly referred to as the arithmetic mean.
The median of a dataset is the middle value, whether the dataset is sorted in ascending or
descending order. When there are an even number of items in a dataset, the median value may be
calculated by taking the mean of the middle two values (Bouwman, and et.al., 2018) .
The mode reflects the value that appears most frequently in the dataset. There are
instances when the dataset has numerous modes, and other times when it contains none at all.
The respondents were given a five point Likert Scale. The first option which were
provided to the respondents was “no obstacle”. And the fifth option was “Very severe Obstacle”.
The respondents were to choose from these five point Likert scale.
Analysis of different Factors which are to be taken into consideration while making
a decision related to expansion in Africa:
Political Instability
South Africa Kenya
Mean 1.844322344 3.153846
Media
n 1 3
Mode 1 4
Analysis of Political Instability: The above calculated measures of central tendency shows that
how political instability poses a threat on the growth of the business. The mean for the dataset
relating to the political instability in the countries like south Africa and Kenya were 1.8 and 3.15
respectively. This means that the average number of respondents relating to south Africa went
for option two which was “Minor Obstacle”. This means that the average number of respondents
relating to Kenya went for option three which was “Moderate obstacle”. The median of the
⊘ This is a preview!⊘
Do you want full access?
Subscribe today to unlock all pages.
Trusted by 1+ million students worldwide
dataset was 1 and 3 respectively for the countries. this means that the mid respondent of the
survey went with “no obstacle” and “Moderate obstacle” for both countries. the mode of the
dataset was 1 and 4 for South Africa and Kenya respectively. this means that the maximum
numbers of respondents go with option 1 which is “no obstacle” and option 4 which is “major
obstacle”.
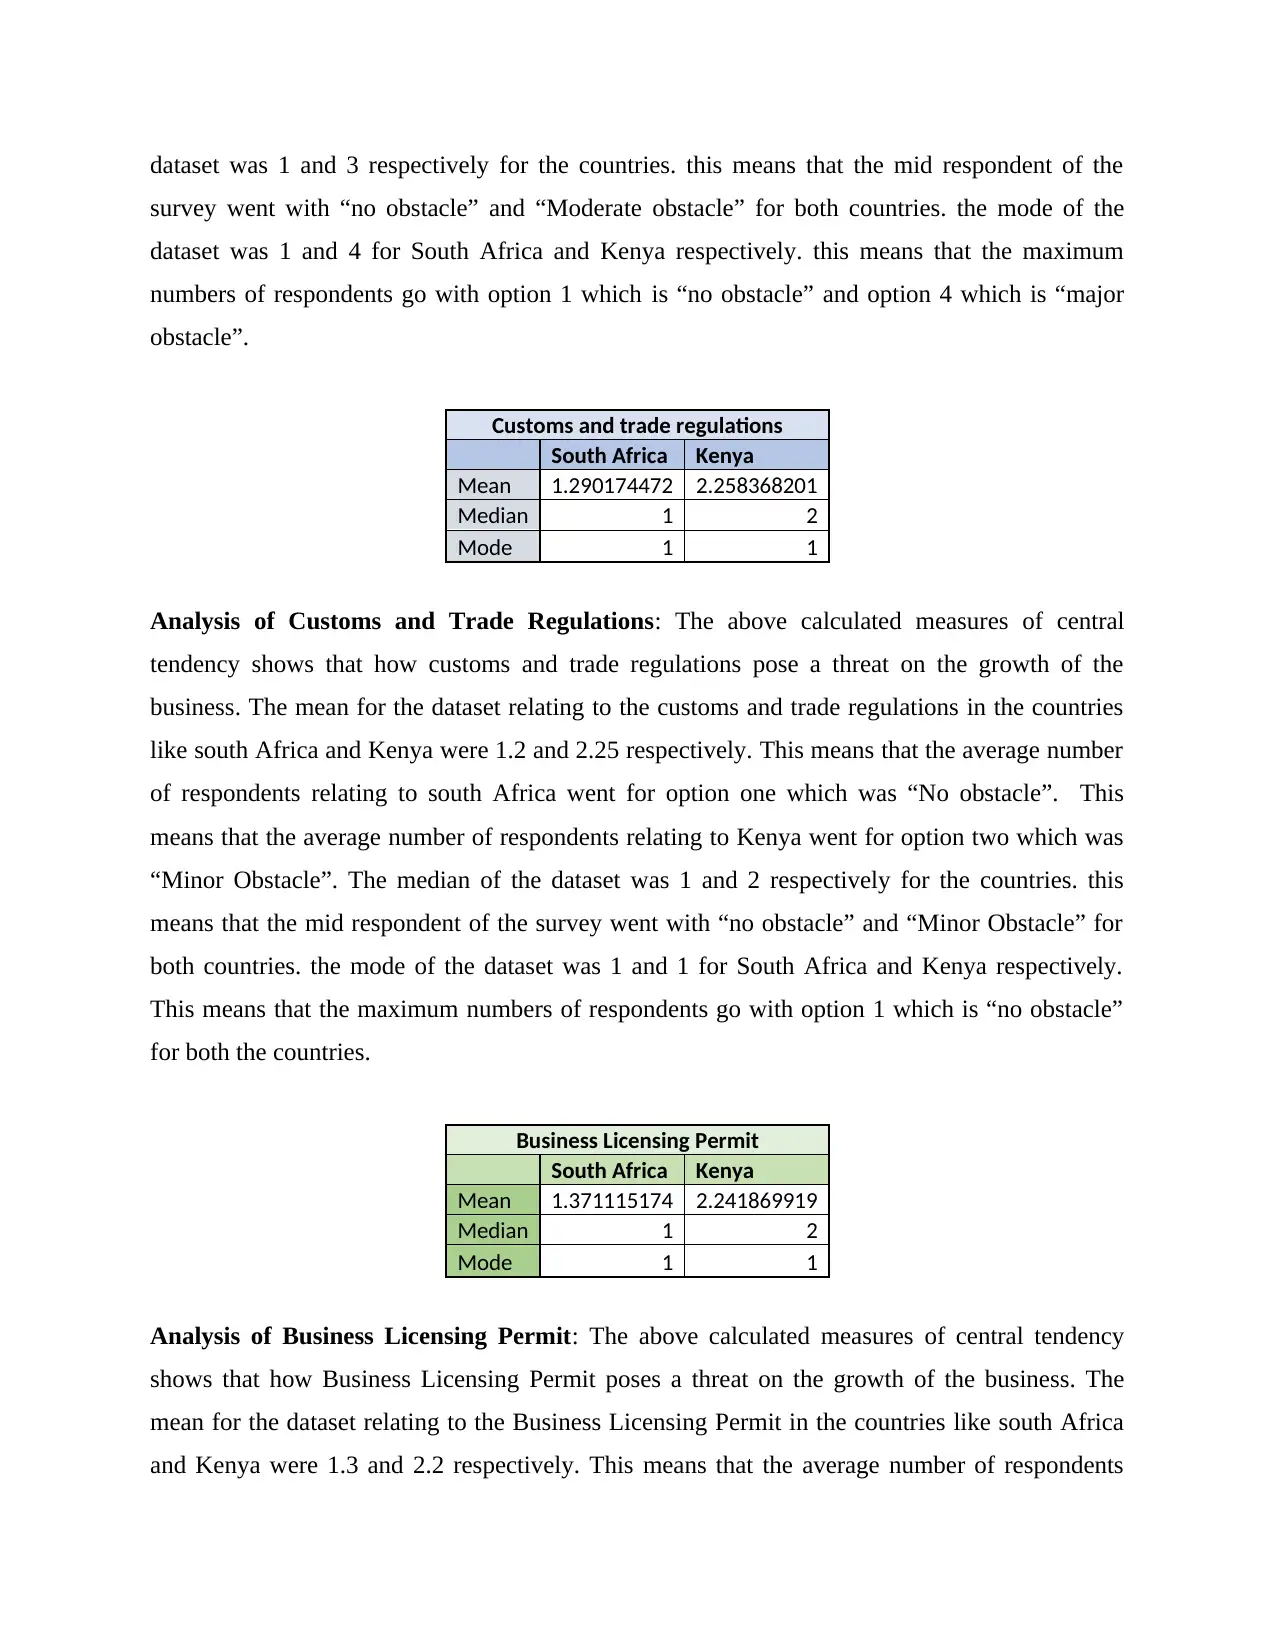
Customs and trade regulations
South Africa Kenya
Mean 1.290174472 2.258368201
Median 1 2
Mode 1 1
Analysis of Customs and Trade Regulations: The above calculated measures of central
tendency shows that how customs and trade regulations pose a threat on the growth of the
business. The mean for the dataset relating to the customs and trade regulations in the countries
like south Africa and Kenya were 1.2 and 2.25 respectively. This means that the average number
of respondents relating to south Africa went for option one which was “No obstacle”. This
means that the average number of respondents relating to Kenya went for option two which was
“Minor Obstacle”. The median of the dataset was 1 and 2 respectively for the countries. this
means that the mid respondent of the survey went with “no obstacle” and “Minor Obstacle” for
both countries. the mode of the dataset was 1 and 1 for South Africa and Kenya respectively.
This means that the maximum numbers of respondents go with option 1 which is “no obstacle”
for both the countries.
Business Licensing Permit
South Africa Kenya
Mean 1.371115174 2.241869919
Median 1 2
Mode 1 1
Analysis of Business Licensing Permit: The above calculated measures of central tendency
shows that how Business Licensing Permit poses a threat on the growth of the business. The
mean for the dataset relating to the Business Licensing Permit in the countries like south Africa
and Kenya were 1.3 and 2.2 respectively. This means that the average number of respondents
survey went with “no obstacle” and “Moderate obstacle” for both countries. the mode of the
dataset was 1 and 4 for South Africa and Kenya respectively. this means that the maximum
numbers of respondents go with option 1 which is “no obstacle” and option 4 which is “major
obstacle”.
Customs and trade regulations
South Africa Kenya
Mean 1.290174472 2.258368201
Median 1 2
Mode 1 1
Analysis of Customs and Trade Regulations: The above calculated measures of central
tendency shows that how customs and trade regulations pose a threat on the growth of the
business. The mean for the dataset relating to the customs and trade regulations in the countries
like south Africa and Kenya were 1.2 and 2.25 respectively. This means that the average number
of respondents relating to south Africa went for option one which was “No obstacle”. This
means that the average number of respondents relating to Kenya went for option two which was
“Minor Obstacle”. The median of the dataset was 1 and 2 respectively for the countries. this
means that the mid respondent of the survey went with “no obstacle” and “Minor Obstacle” for
both countries. the mode of the dataset was 1 and 1 for South Africa and Kenya respectively.
This means that the maximum numbers of respondents go with option 1 which is “no obstacle”
for both the countries.
Business Licensing Permit
South Africa Kenya
Mean 1.371115174 2.241869919
Median 1 2
Mode 1 1
Analysis of Business Licensing Permit: The above calculated measures of central tendency
shows that how Business Licensing Permit poses a threat on the growth of the business. The
mean for the dataset relating to the Business Licensing Permit in the countries like south Africa
and Kenya were 1.3 and 2.2 respectively. This means that the average number of respondents
Paraphrase This Document
Need a fresh take? Get an instant paraphrase of this document with our AI Paraphraser
relating to south Africa went for option one which was “no obstacle”. This means that the
average number of respondents relating to Kenya went for option three which was “Minor
Obstacle”. The median of the dataset was 1 and 2 respectively for the countries. this means that
the mid respondent of the survey went with “no obstacle” and “Minor Obstacle” for both
countries. the mode of the dataset was 1 and 1 for South Africa and Kenya respectively. This
means that the maximum numbers of respondents go with option 1 which is “no obstacle” for
both the countries.
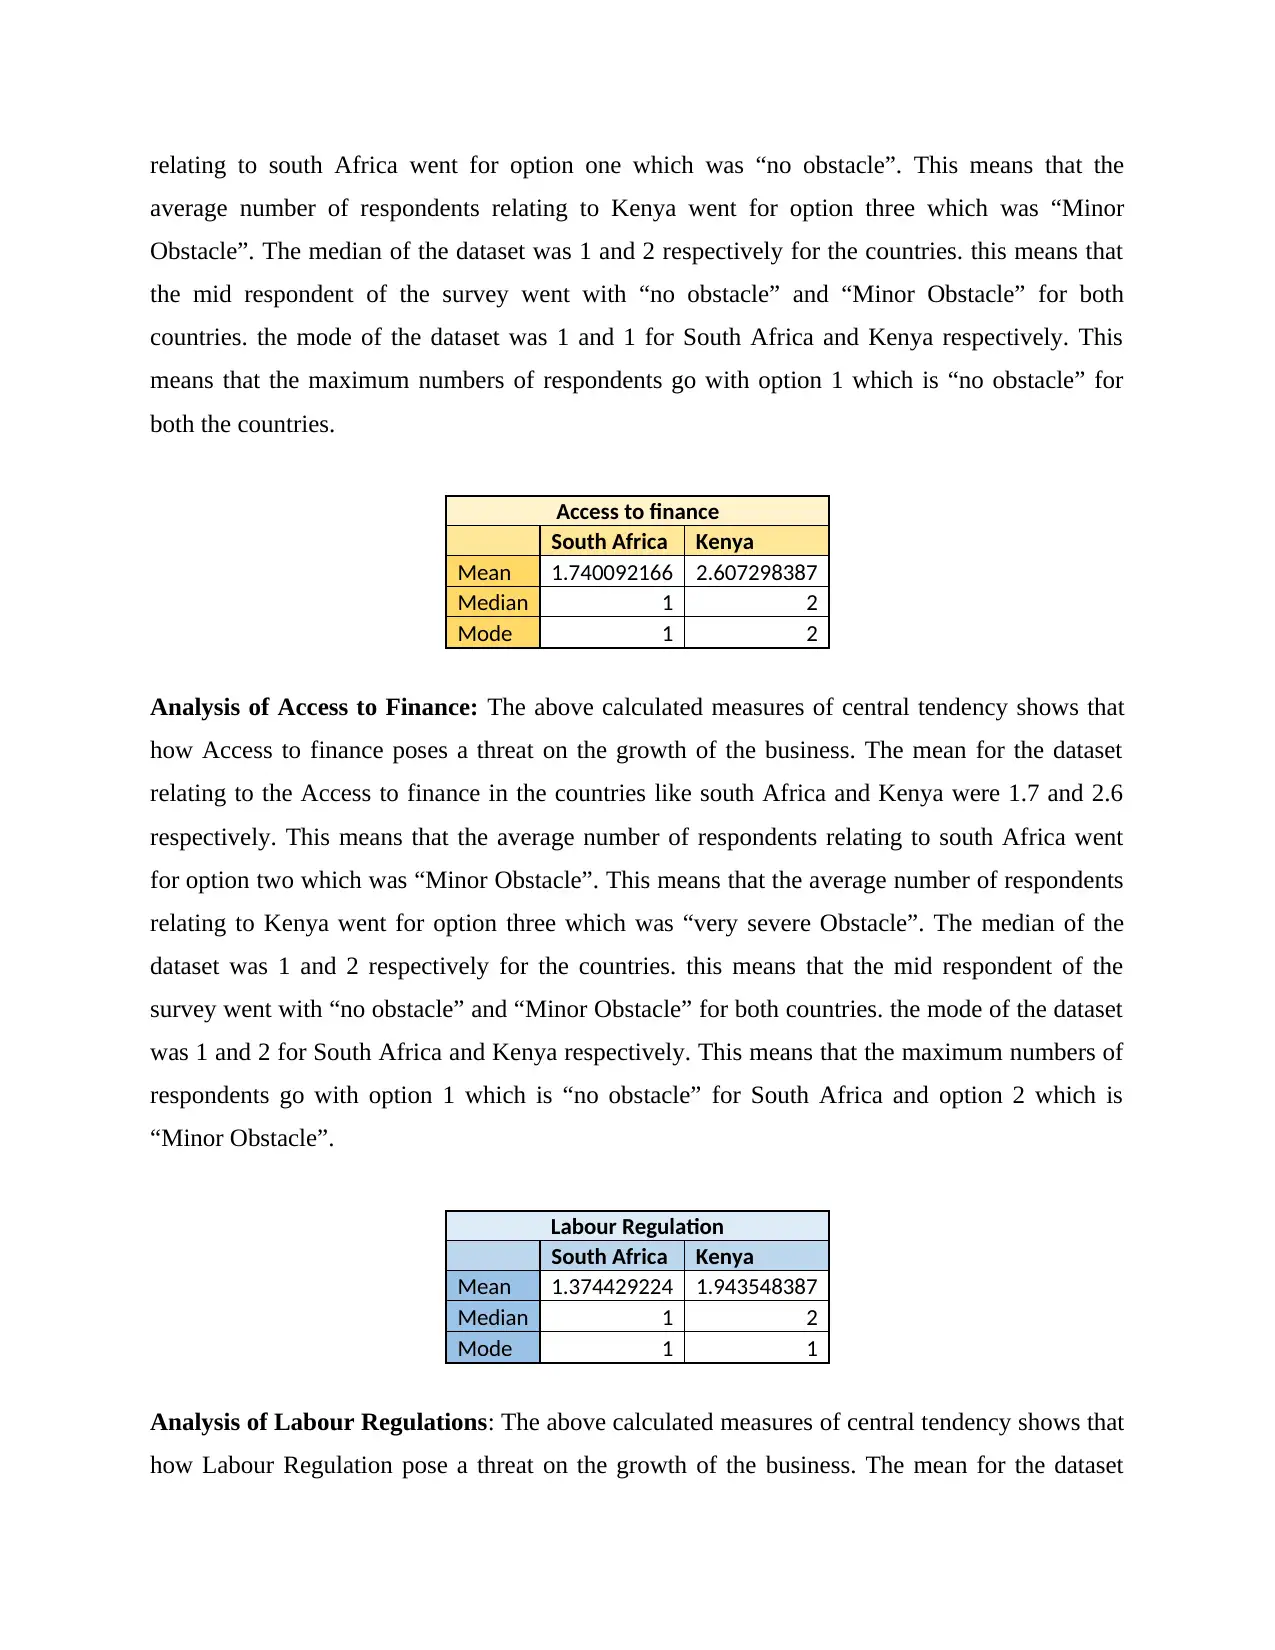
Access to finance
South Africa Kenya
Mean 1.740092166 2.607298387
Median 1 2
Mode 1 2
Analysis of Access to Finance: The above calculated measures of central tendency shows that
how Access to finance poses a threat on the growth of the business. The mean for the dataset
relating to the Access to finance in the countries like south Africa and Kenya were 1.7 and 2.6
respectively. This means that the average number of respondents relating to south Africa went
for option two which was “Minor Obstacle”. This means that the average number of respondents
relating to Kenya went for option three which was “very severe Obstacle”. The median of the
dataset was 1 and 2 respectively for the countries. this means that the mid respondent of the
survey went with “no obstacle” and “Minor Obstacle” for both countries. the mode of the dataset
was 1 and 2 for South Africa and Kenya respectively. This means that the maximum numbers of
respondents go with option 1 which is “no obstacle” for South Africa and option 2 which is
“Minor Obstacle”.
Labour Regulation
South Africa Kenya
Mean 1.374429224 1.943548387
Median 1 2
Mode 1 1
Analysis of Labour Regulations: The above calculated measures of central tendency shows that
how Labour Regulation pose a threat on the growth of the business. The mean for the dataset
average number of respondents relating to Kenya went for option three which was “Minor
Obstacle”. The median of the dataset was 1 and 2 respectively for the countries. this means that
the mid respondent of the survey went with “no obstacle” and “Minor Obstacle” for both
countries. the mode of the dataset was 1 and 1 for South Africa and Kenya respectively. This
means that the maximum numbers of respondents go with option 1 which is “no obstacle” for
both the countries.
Access to finance
South Africa Kenya
Mean 1.740092166 2.607298387
Median 1 2
Mode 1 2
Analysis of Access to Finance: The above calculated measures of central tendency shows that
how Access to finance poses a threat on the growth of the business. The mean for the dataset
relating to the Access to finance in the countries like south Africa and Kenya were 1.7 and 2.6
respectively. This means that the average number of respondents relating to south Africa went
for option two which was “Minor Obstacle”. This means that the average number of respondents
relating to Kenya went for option three which was “very severe Obstacle”. The median of the
dataset was 1 and 2 respectively for the countries. this means that the mid respondent of the
survey went with “no obstacle” and “Minor Obstacle” for both countries. the mode of the dataset
was 1 and 2 for South Africa and Kenya respectively. This means that the maximum numbers of
respondents go with option 1 which is “no obstacle” for South Africa and option 2 which is
“Minor Obstacle”.
Labour Regulation
South Africa Kenya
Mean 1.374429224 1.943548387
Median 1 2
Mode 1 1
Analysis of Labour Regulations: The above calculated measures of central tendency shows that
how Labour Regulation pose a threat on the growth of the business. The mean for the dataset
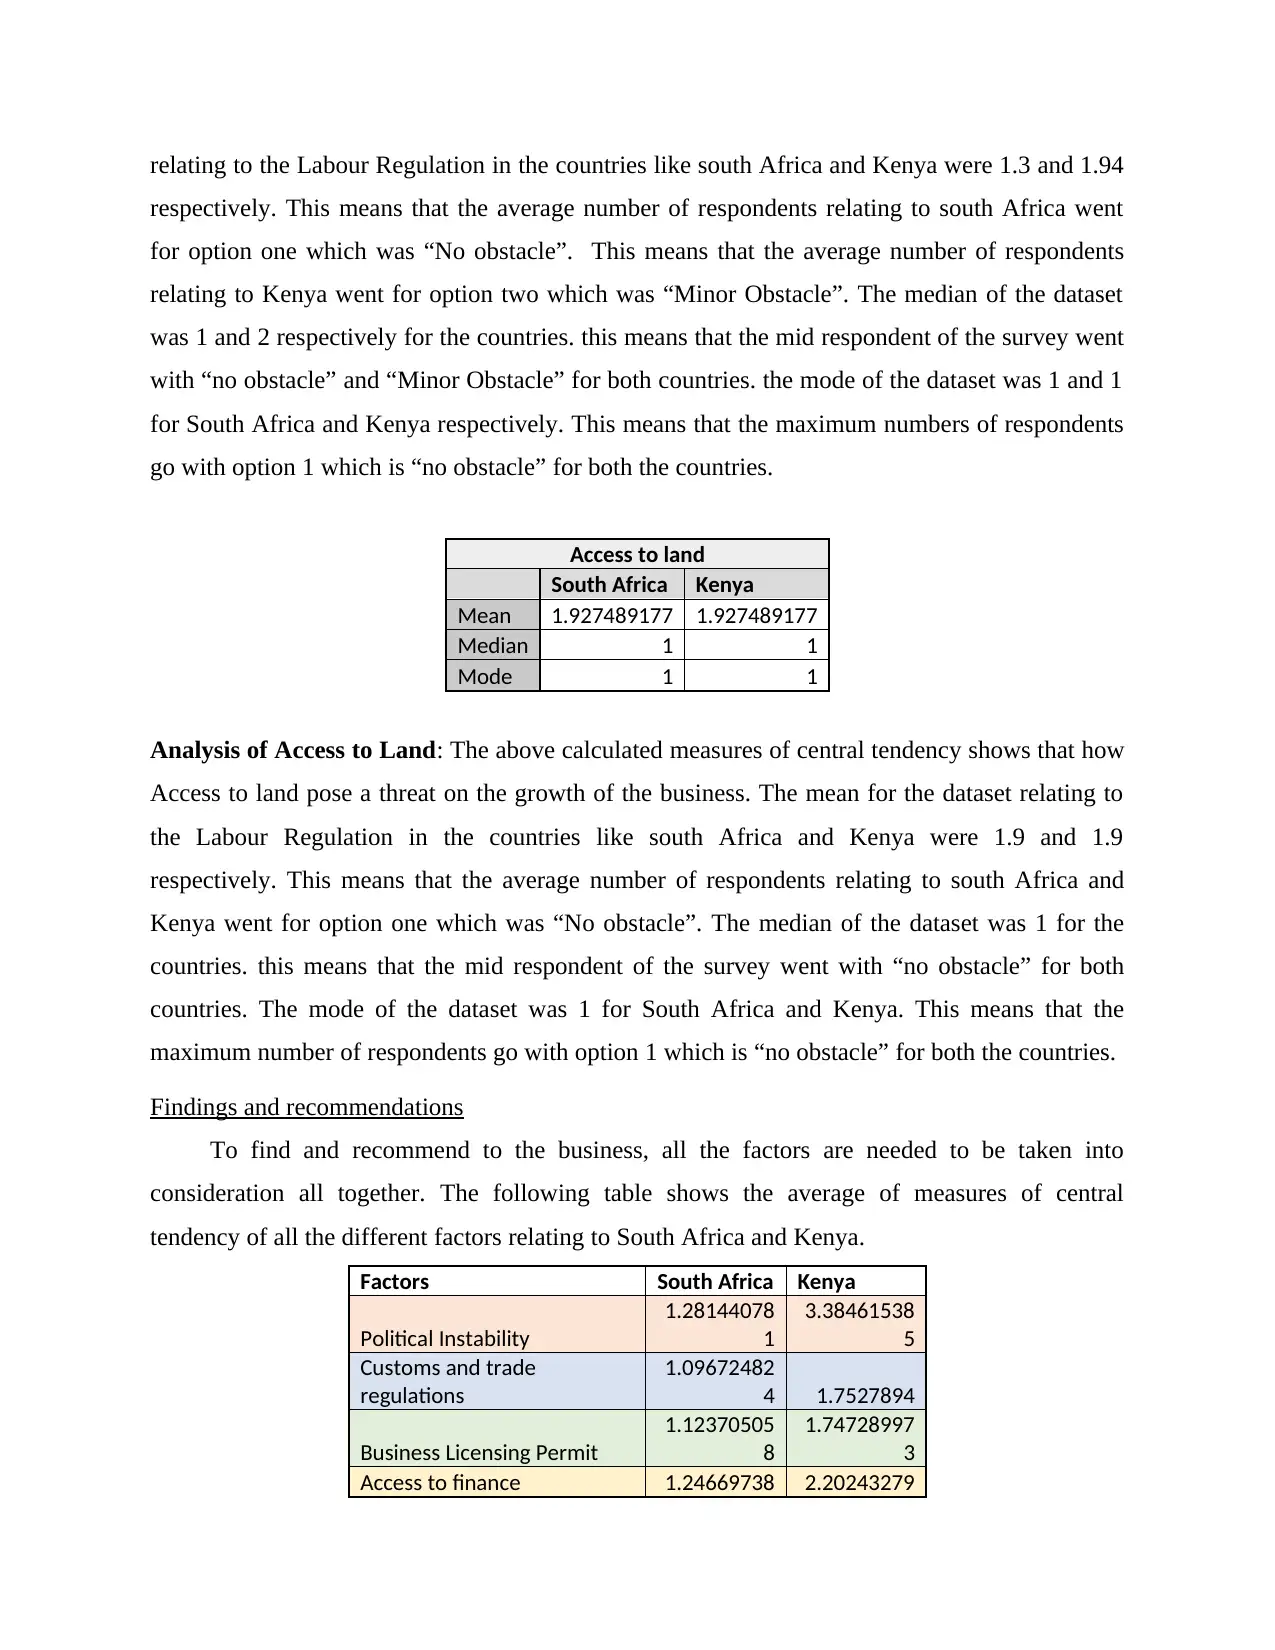
relating to the Labour Regulation in the countries like south Africa and Kenya were 1.3 and 1.94
respectively. This means that the average number of respondents relating to south Africa went
for option one which was “No obstacle”. This means that the average number of respondents
relating to Kenya went for option two which was “Minor Obstacle”. The median of the dataset
was 1 and 2 respectively for the countries. this means that the mid respondent of the survey went
with “no obstacle” and “Minor Obstacle” for both countries. the mode of the dataset was 1 and 1
for South Africa and Kenya respectively. This means that the maximum numbers of respondents
go with option 1 which is “no obstacle” for both the countries.
Access to land
South Africa Kenya
Mean 1.927489177 1.927489177
Median 1 1
Mode 1 1
Analysis of Access to Land: The above calculated measures of central tendency shows that how
Access to land pose a threat on the growth of the business. The mean for the dataset relating to
the Labour Regulation in the countries like south Africa and Kenya were 1.9 and 1.9
respectively. This means that the average number of respondents relating to south Africa and
Kenya went for option one which was “No obstacle”. The median of the dataset was 1 for the
countries. this means that the mid respondent of the survey went with “no obstacle” for both
countries. The mode of the dataset was 1 for South Africa and Kenya. This means that the
maximum number of respondents go with option 1 which is “no obstacle” for both the countries.
Findings and recommendations
To find and recommend to the business, all the factors are needed to be taken into
consideration all together. The following table shows the average of measures of central
tendency of all the different factors relating to South Africa and Kenya.
Factors South Africa Kenya
Political Instability
1.28144078
1
3.38461538
5
Customs and trade
regulations
1.09672482
4 1.7527894
Business Licensing Permit
1.12370505
8
1.74728997
3
Access to finance 1.24669738 2.20243279
⊘ This is a preview!⊘
Do you want full access?
Subscribe today to unlock all pages.
Trusted by 1+ million students worldwide
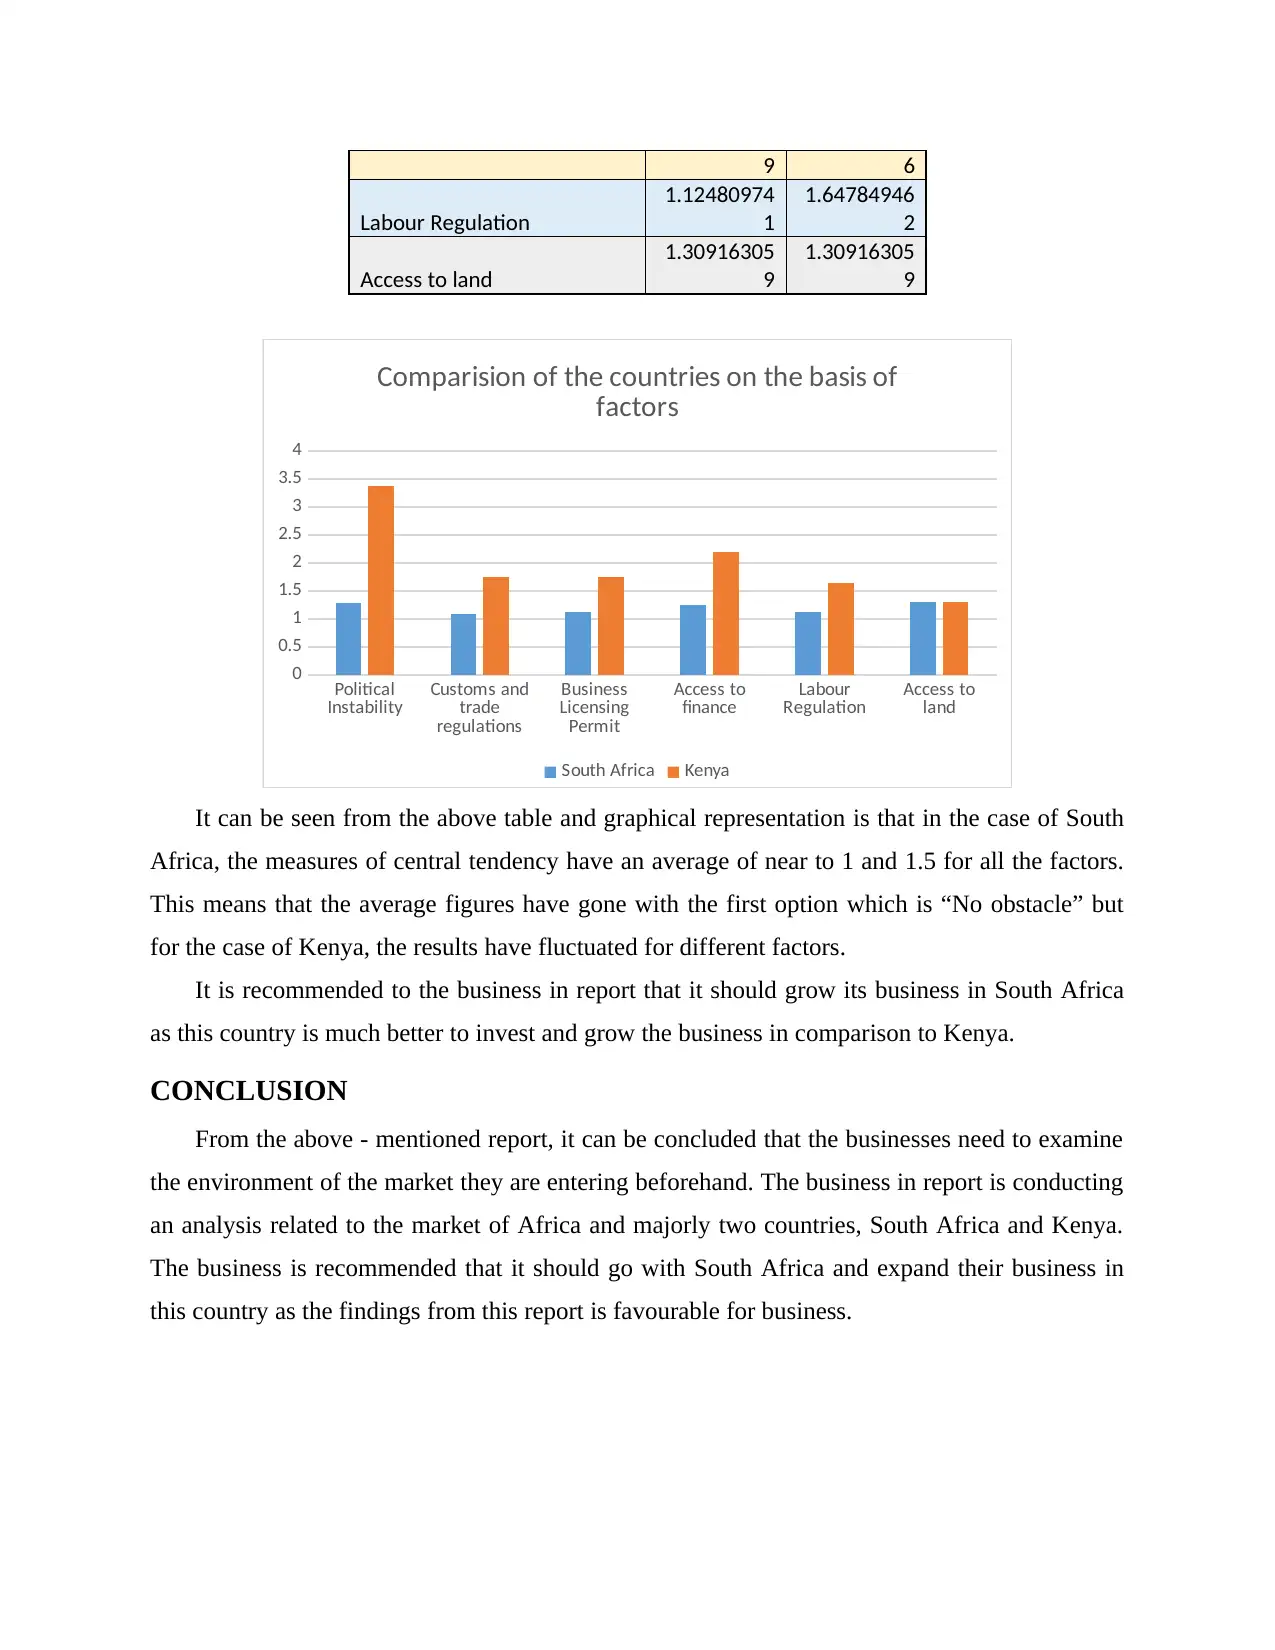
9 6
Labour Regulation
1.12480974
1
1.64784946
2
Access to land
1.30916305
9
1.30916305
9
Political
Instability Customs and
trade
regulations
Business
Licensing
Permit
Access to
finance Labour
Regulation Access to
land
0
0.5
1
1.5
2
2.5
3
3.5
4
Comparision of the countries on the basis of
factors
South Africa Kenya
It can be seen from the above table and graphical representation is that in the case of South
Africa, the measures of central tendency have an average of near to 1 and 1.5 for all the factors.
This means that the average figures have gone with the first option which is “No obstacle” but
for the case of Kenya, the results have fluctuated for different factors.
It is recommended to the business in report that it should grow its business in South Africa
as this country is much better to invest and grow the business in comparison to Kenya.
CONCLUSION
From the above - mentioned report, it can be concluded that the businesses need to examine
the environment of the market they are entering beforehand. The business in report is conducting
an analysis related to the market of Africa and majorly two countries, South Africa and Kenya.
The business is recommended that it should go with South Africa and expand their business in
this country as the findings from this report is favourable for business.
Paraphrase This Document
Need a fresh take? Get an instant paraphrase of this document with our AI Paraphraser
REFERENCES
Books and Journals
Kotu, V. and Deshpande, B., 2018. Data science: concepts and practice. Morgan Kaufmann.
Glass, C. and Cook, A., 2018. Do women leaders promote positive change? Analyzing the effect
of gender on business practices and diversity initiatives. Human Resource
Management, 57(4), pp.823-837.
Fernando, Y., Jabbour, C.J.C. and Wah, W.X., 2019. Pursuing green growth in technology firms
through the connections between environmental innovation and sustainable business
performance: does service capability matter?. Resources, Conservation and
Recycling, 141, pp.8-20.
Kouhizadeh, M., Zhu, Q. and Sarkis, J., 2020. Blockchain and the circular economy: potential
tensions and critical reflections from practice. Production Planning & Control, 31(11-
12), pp.950-966.
Bouwman, H., and et.al., 2018. The impact of digitalization on business models. Digital Policy,
Regulation and Governance.
Rembert, J.H., and et.al., 2021. Using the Collaborative Requirements Development
Methodology to Build Laboratory Capacity for Timely Diagnosis During the Zika
Epidemic in Puerto Rico. Journal of Public Health Management and Practice, 27(3),
pp.E143-E150.
Chan, J.C., and et.al., 2020. The Lancet Commission on diabetes: using data to transform
diabetes care and patient lives. The Lancet, 396(10267), pp.2019-2082.
Pierce, M., and et.al., 2021. Mental health responses to the COVID-19 pandemic: a latent class
trajectory analysis using longitudinal UK data. The Lancet Psychiatry, 8(7), pp.610-
619.
1 out of 11
Related Documents


Your All-in-One AI-Powered Toolkit for Academic Success.
+13062052269
info@desklib.com
Available 24*7 on WhatsApp / Email
![[object Object]](/_next/static/media/star-bottom.7253800d.svg)
Unlock your academic potential
Copyright © 2020–2026 A2Z Services. All Rights Reserved. Developed and managed by ZUCOL.