Financial Management Report: Agathia Group PJSC Financial Analysis
VerifiedAdded on 2020/05/28
|8
|916
|42
Report
AI Summary
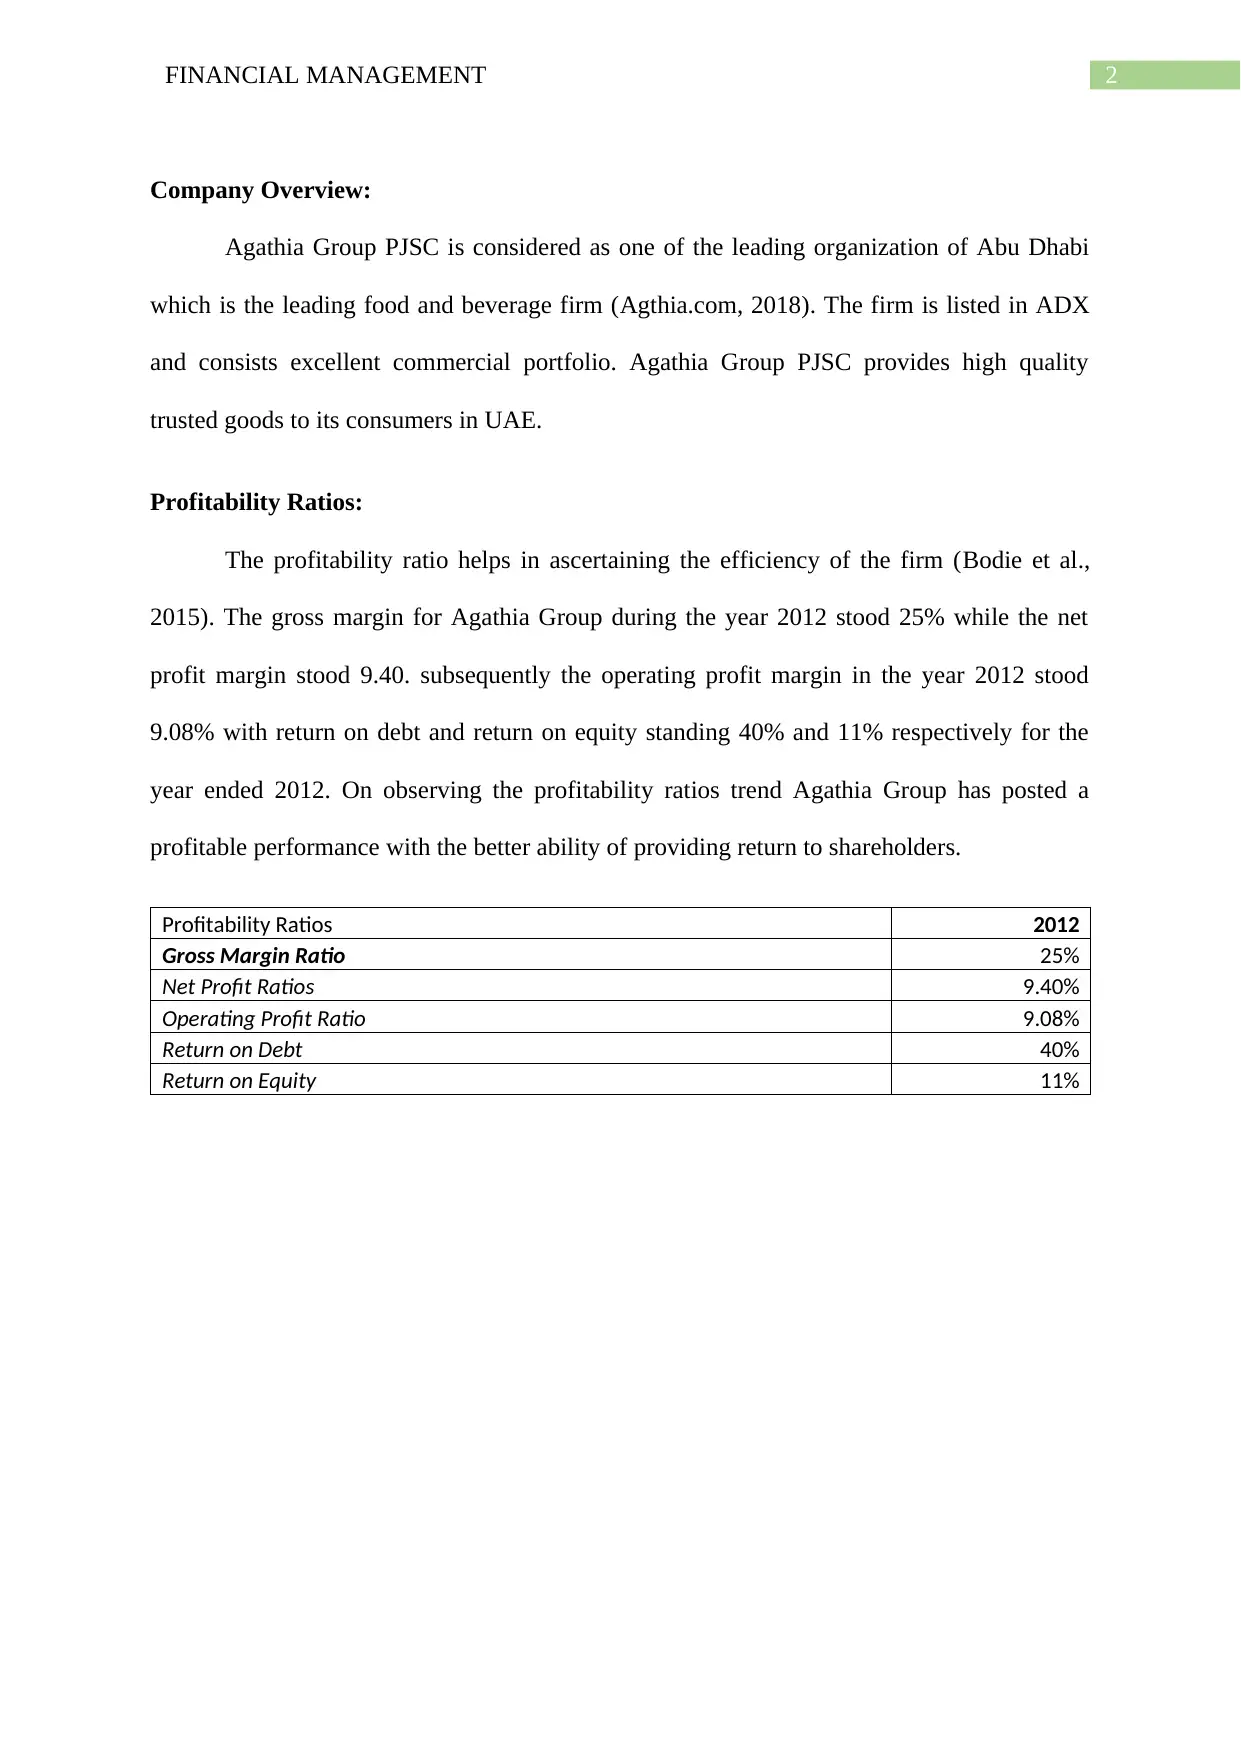
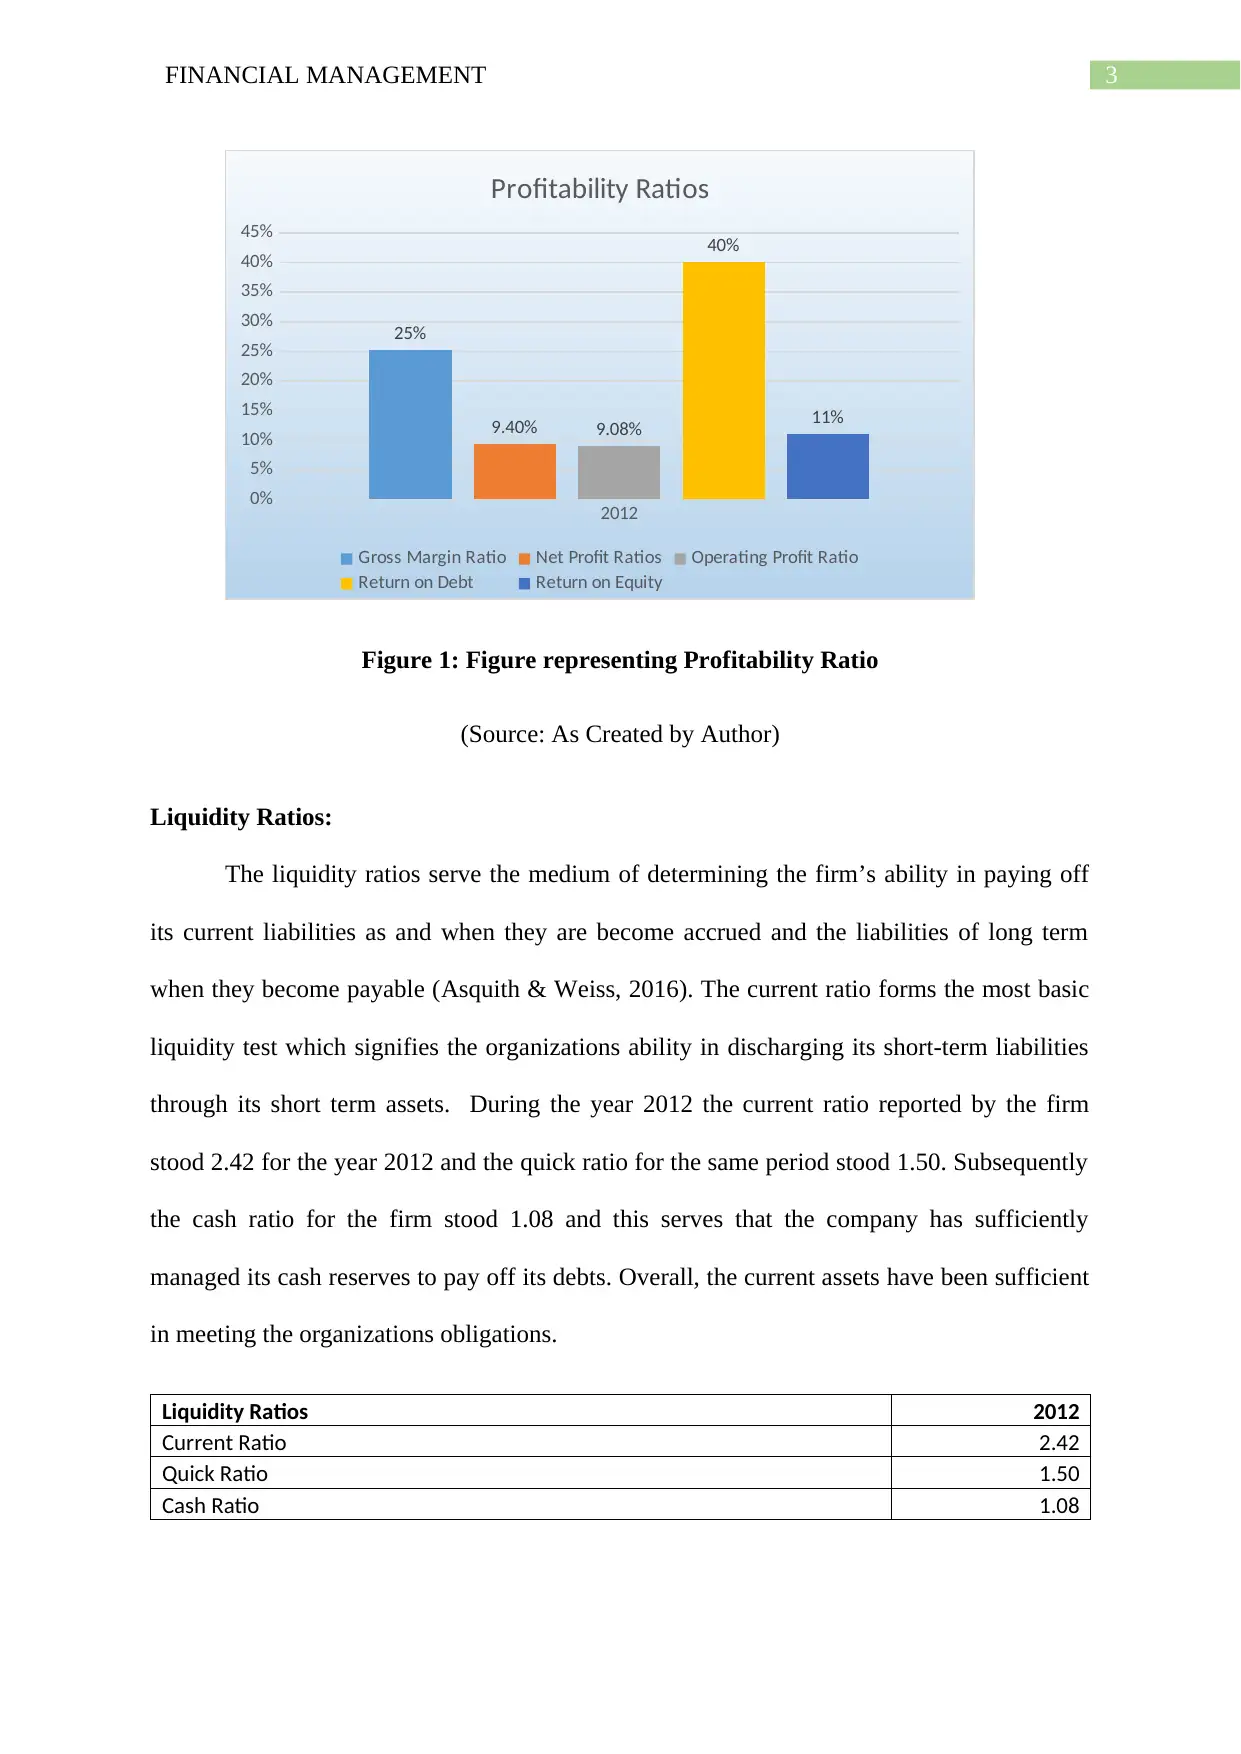
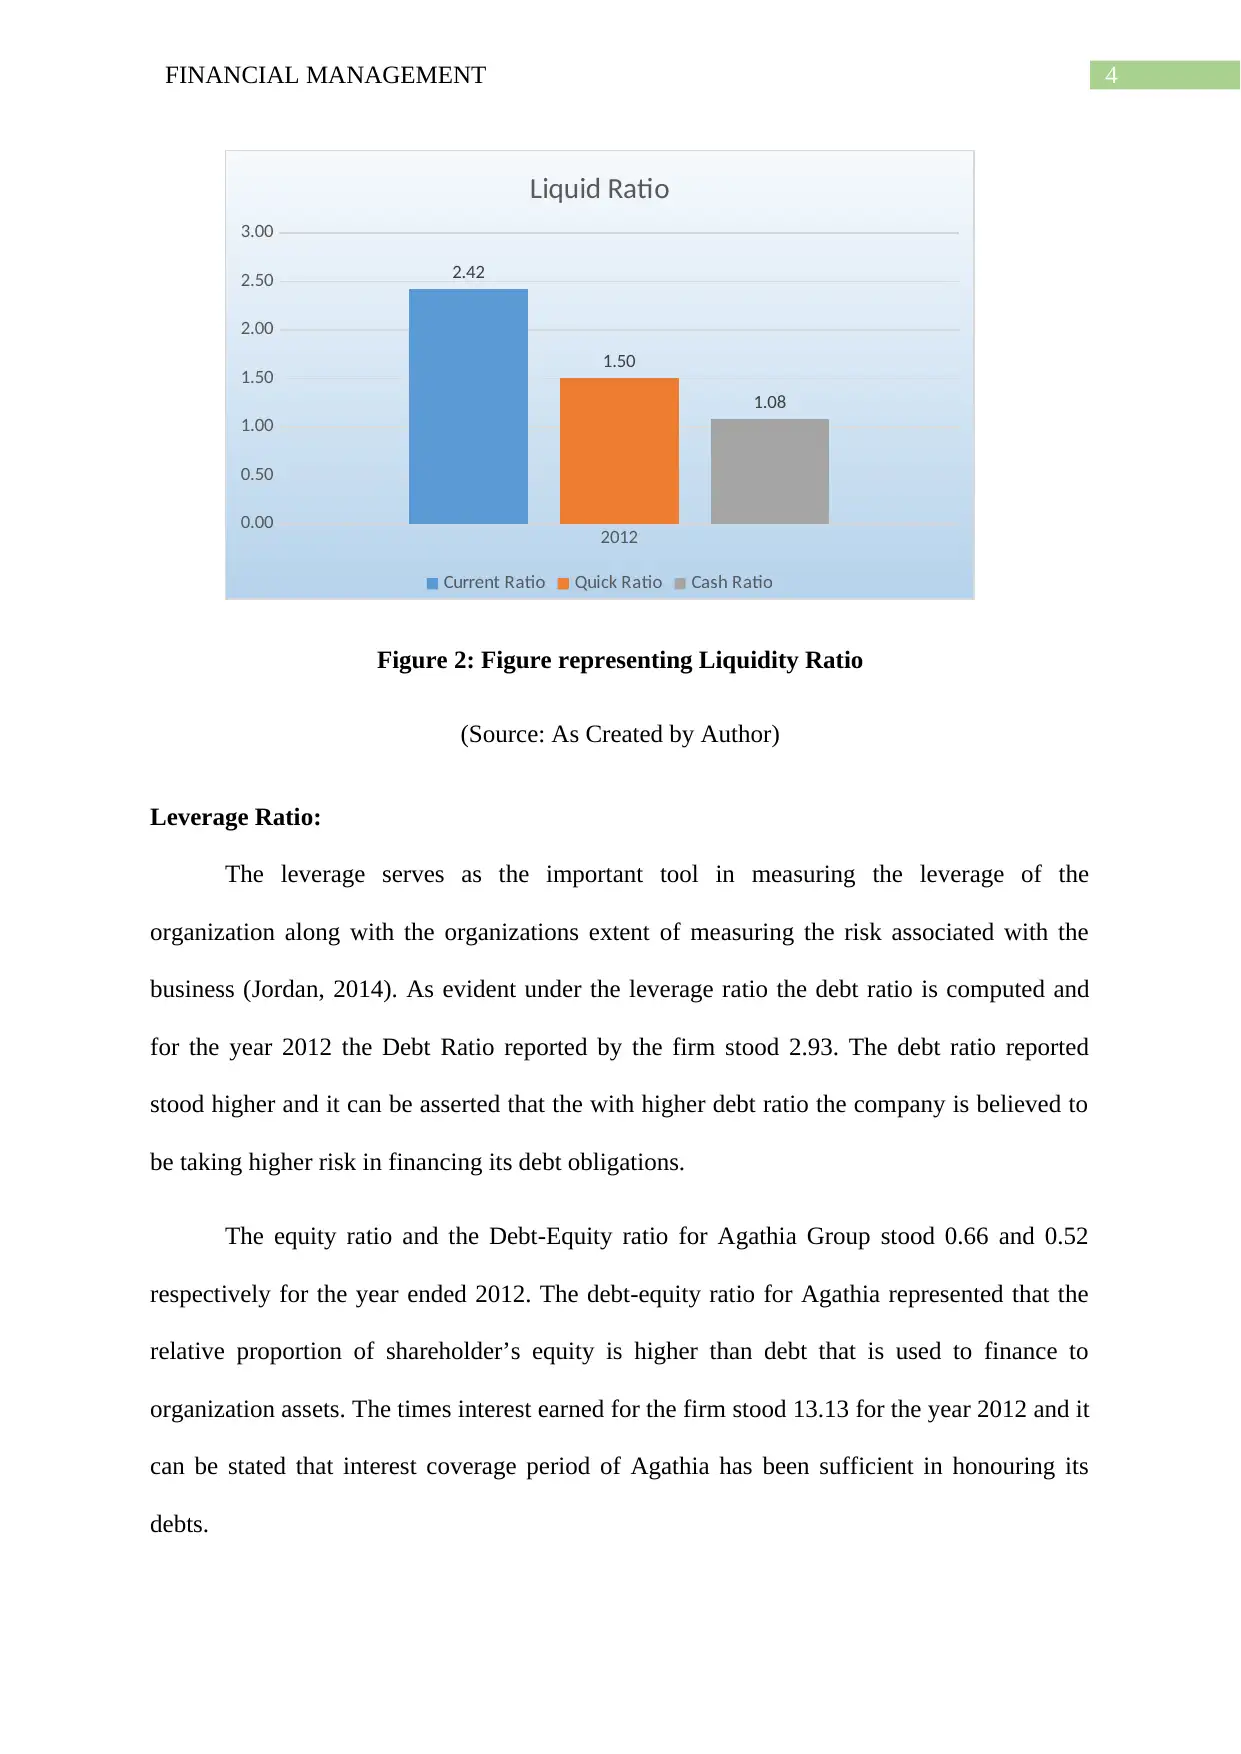
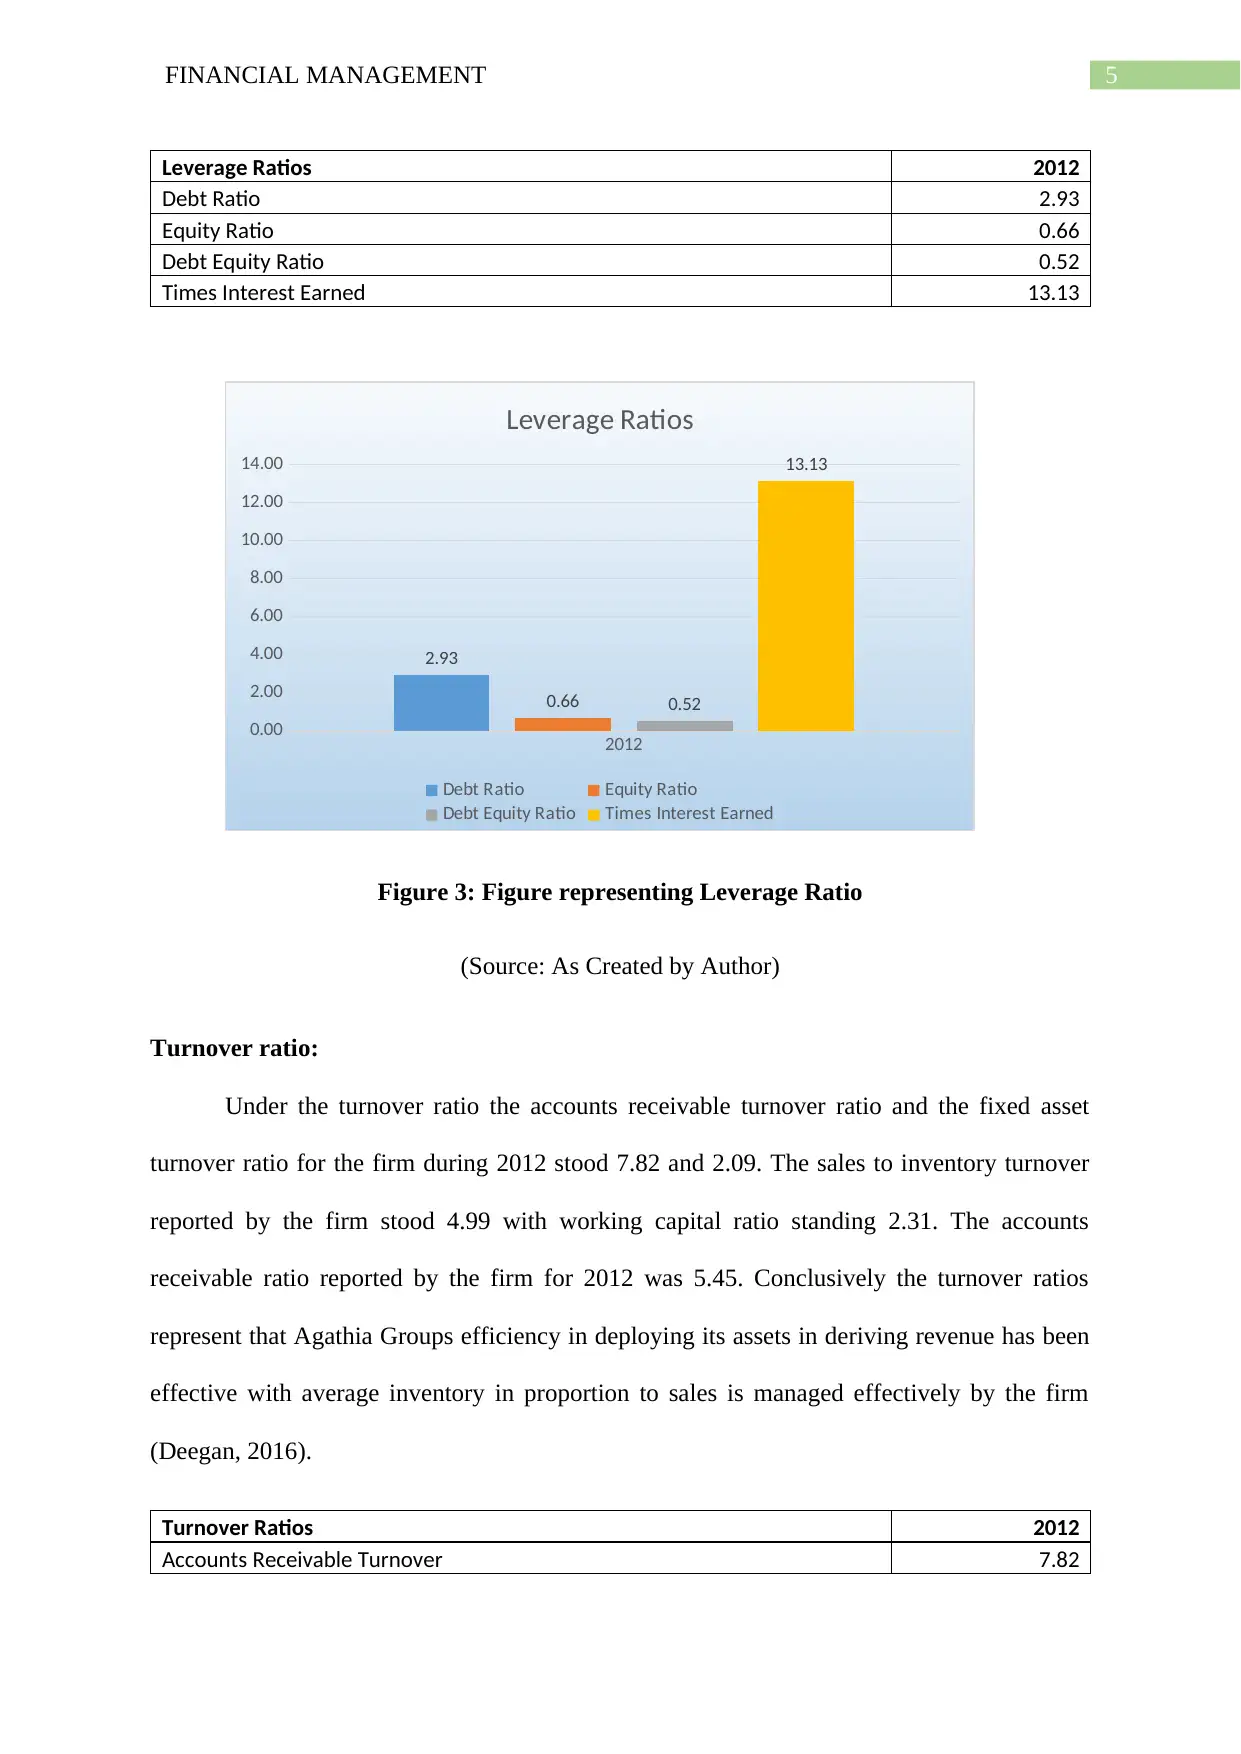
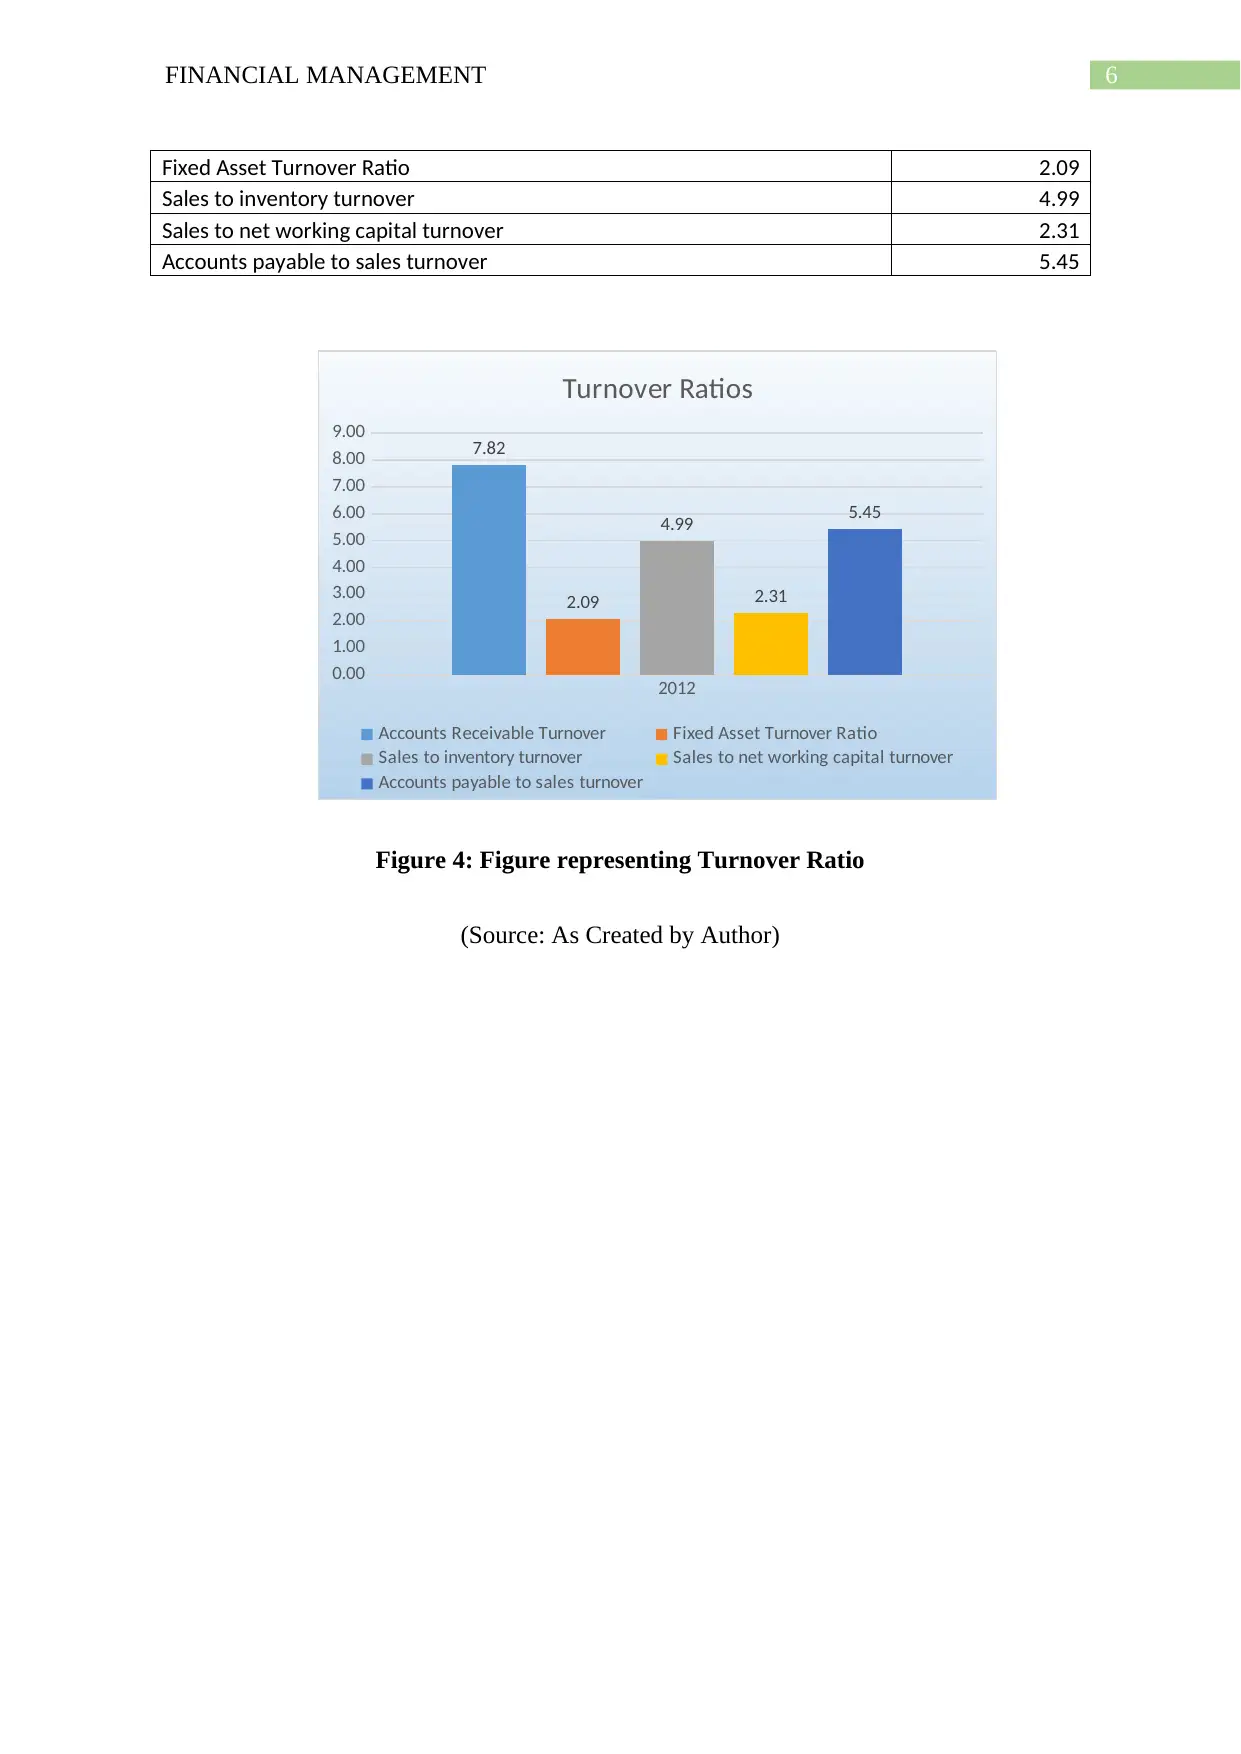
This report presents a comprehensive financial analysis of Agathia Group PJSC, a leading food and beverage company in Abu Dhabi. The analysis focuses on key financial ratios from 2012, categorized into profitability, liquidity, leverage, and turnover ratios. Profitability ratios, including gross margin, net profit margin, and return on equity, indicate the company's efficiency in generating profits and providing returns to shareholders. Liquidity ratios, such as current, quick, and cash ratios, assess the company's ability to meet its short-term obligations. Leverage ratios, including debt ratio, equity ratio, and times interest earned, evaluate the company's financial risk and debt management. Turnover ratios, including accounts receivable turnover and fixed asset turnover, assess the company's efficiency in utilizing its assets to generate revenue and manage inventory. The report concludes that Agathia Group demonstrated a strong financial performance in 2012, effectively managing its assets and obligations.

Running head: FINANCIAL MANAGEMENT
Financial Management
Name of the Student
Name of the University
Authors Note
Course ID
Financial Management
Name of the Student
Name of the University
Authors Note
Course ID
Paraphrase This Document
Need a fresh take? Get an instant paraphrase of this document with our AI Paraphraser

1FINANCIAL MANAGEMENT
Table of Contents
Company Overview:..................................................................................................................2
Profitability Ratios:....................................................................................................................2
Liquidity Ratios:.........................................................................................................................3
Leverage Ratio:..........................................................................................................................4
Turnover ratio:...........................................................................................................................5
Reference List:...........................................................................................................................7

2FINANCIAL MANAGEMENT
Company Overview:
Agathia Group PJSC is considered as one of the leading organization of Abu Dhabi
which is the leading food and beverage firm (Agthia.com, 2018). The firm is listed in ADX
and consists excellent commercial portfolio. Agathia Group PJSC provides high quality
trusted goods to its consumers in UAE.
Profitability Ratios:
The profitability ratio helps in ascertaining the efficiency of the firm (Bodie et al.,
2015). The gross margin for Agathia Group during the year 2012 stood 25% while the net
profit margin stood 9.40. subsequently the operating profit margin in the year 2012 stood
9.08% with return on debt and return on equity standing 40% and 11% respectively for the
year ended 2012. On observing the profitability ratios trend Agathia Group has posted a
profitable performance with the better ability of providing return to shareholders.
Profitability Ratios 2012
Gross Margin Ratio 25%
Net Profit Ratios 9.40%
Operating Profit Ratio 9.08%
Return on Debt 40%
Return on Equity 11%
⊘ This is a preview!⊘
Do you want full access?
Subscribe today to unlock all pages.

Trusted by 1+ million students worldwide

3FINANCIAL MANAGEMENT
2012
0%
5%
10%
15%
20%
25%
30%
35%
40%
45%
25%
9.40% 9.08%
40%
11%
Profitability Ratios
Gross Margin Ratio Net Profit Ratios Operating Profit Ratio
Return on Debt Return on Equity
Figure 1: Figure representing Profitability Ratio
(Source: As Created by Author)
Liquidity Ratios:
The liquidity ratios serve the medium of determining the firm’s ability in paying off
its current liabilities as and when they are become accrued and the liabilities of long term
when they become payable (Asquith & Weiss, 2016). The current ratio forms the most basic
liquidity test which signifies the organizations ability in discharging its short-term liabilities
through its short term assets. During the year 2012 the current ratio reported by the firm
stood 2.42 for the year 2012 and the quick ratio for the same period stood 1.50. Subsequently
the cash ratio for the firm stood 1.08 and this serves that the company has sufficiently
managed its cash reserves to pay off its debts. Overall, the current assets have been sufficient
in meeting the organizations obligations.
Liquidity Ratios 2012
Current Ratio 2.42
Quick Ratio 1.50
Cash Ratio 1.08
Paraphrase This Document
Need a fresh take? Get an instant paraphrase of this document with our AI Paraphraser

4FINANCIAL MANAGEMENT
2012
0.00
0.50
1.00
1.50
2.00
2.50
3.00
2.42
1.50
1.08
Liquid Ratio
Current Ratio Quick Ratio Cash Ratio
Figure 2: Figure representing Liquidity Ratio
(Source: As Created by Author)
Leverage Ratio:
The leverage serves as the important tool in measuring the leverage of the
organization along with the organizations extent of measuring the risk associated with the
business (Jordan, 2014). As evident under the leverage ratio the debt ratio is computed and
for the year 2012 the Debt Ratio reported by the firm stood 2.93. The debt ratio reported
stood higher and it can be asserted that the with higher debt ratio the company is believed to
be taking higher risk in financing its debt obligations.
The equity ratio and the Debt-Equity ratio for Agathia Group stood 0.66 and 0.52
respectively for the year ended 2012. The debt-equity ratio for Agathia represented that the
relative proportion of shareholder’s equity is higher than debt that is used to finance to
organization assets. The times interest earned for the firm stood 13.13 for the year 2012 and it
can be stated that interest coverage period of Agathia has been sufficient in honouring its
debts.

5FINANCIAL MANAGEMENT
Leverage Ratios 2012
Debt Ratio 2.93
Equity Ratio 0.66
Debt Equity Ratio 0.52
Times Interest Earned 13.13
2012
0.00
2.00
4.00
6.00
8.00
10.00
12.00
14.00
2.93
0.66 0.52
13.13
Leverage Ratios
Debt Ratio Equity Ratio
Debt Equity Ratio Times Interest Earned
Figure 3: Figure representing Leverage Ratio
(Source: As Created by Author)
Turnover ratio:
Under the turnover ratio the accounts receivable turnover ratio and the fixed asset
turnover ratio for the firm during 2012 stood 7.82 and 2.09. The sales to inventory turnover
reported by the firm stood 4.99 with working capital ratio standing 2.31. The accounts
receivable ratio reported by the firm for 2012 was 5.45. Conclusively the turnover ratios
represent that Agathia Groups efficiency in deploying its assets in deriving revenue has been
effective with average inventory in proportion to sales is managed effectively by the firm
(Deegan, 2016).
Turnover Ratios 2012
Accounts Receivable Turnover 7.82
⊘ This is a preview!⊘
Do you want full access?
Subscribe today to unlock all pages.

Trusted by 1+ million students worldwide

6FINANCIAL MANAGEMENT
Fixed Asset Turnover Ratio 2.09
Sales to inventory turnover 4.99
Sales to net working capital turnover 2.31
Accounts payable to sales turnover 5.45
2012
0.00
1.00
2.00
3.00
4.00
5.00
6.00
7.00
8.00
9.00 7.82
2.09
4.99
2.31
5.45
Turnover Ratios
Accounts Receivable Turnover Fixed Asset Turnover Ratio
Sales to inventory turnover Sales to net working capital turnover
Accounts payable to sales turnover
Figure 4: Figure representing Turnover Ratio
(Source: As Created by Author)
Paraphrase This Document
Need a fresh take? Get an instant paraphrase of this document with our AI Paraphraser

7FINANCIAL MANAGEMENT
Reference List:
Agthia > Home. (2018). Agthia.com. Retrieved 11 January 2018, from http://agthia.com/en-
us/
Agthia > Investors > Results & Presentations > Results Call Materials. (2018). Agthia.com.
Retrieved 11 January 2018, from http://agthia.com/en-us/Investors/Results-
Presentations/Results-Call-Materials
Asquith, P., & Weiss, L. A. (2016). Determining a Firm's Financial Health (PIPES‐
A). Lessons in Corporate Finance: A Case Studies Approach to Financial Tools, Financial
Policies, and Valuation, 7-25.
Bodie, Z., Kane, A., & Marcus, A. J. (2014). Investments, 10e. McGraw-Hill Education.
Deegan, C. (2016). Financial accounting. McGraw-Hill Education Australia.
Jordan, B. (2014). Fundamentals of investments. McGraw-Hill Higher Education.
1 out of 8
Related Documents

Your All-in-One AI-Powered Toolkit for Academic Success.
+13062052269
info@desklib.com
Available 24*7 on WhatsApp / Email
Unlock your academic potential
Copyright © 2020–2025 A2Z Services. All Rights Reserved. Developed and managed by ZUCOL.