PY0419: A Quantitative Study on Ageing and Memory Retention Skills
VerifiedAdded on 2023/06/05
|19
|4106
|264
Report
AI Summary
This report investigates the relationship between ageing and memory retention. The study recruited younger (18-34 years) and older (65+ years) adults, assessing their ability to retain a list of words through immediate and delayed memory tests, with a spot-the-difference game as a distraction. Independent sample t-tests revealed a significant statistical difference in memory retention scores between the two age groups. Correlation analysis showed a weak negative correlation between memory retention and spot-the-difference game performance in younger adults, while older adults exhibited a strong positive correlation. The overall correlation was moderate. The study concludes that healthy ageing, supported by good nutrition and mental/physical exercise, can positively impact memory retention. The research was approved by the Faculty of Health and Life Sciences Research Ethics Committee (reference number: 2021297).

Psychology
Paraphrase This Document
Need a fresh take? Get an instant paraphrase of this document with our AI Paraphraser
ABSTRACT
Ageing is a process affecting a human body in a such a way which leads to psychological
as well as biological changes in it. Healthy ageing promotes physical and mental wellbeing at
older age which shows positive wellbeing, cognitive functioning and life satisfaction. Usually
younger people are found to be fit in terms of both physical and mental health. In this study, the
researcher has hypothesized that whether there is statistical significance lies among the people’s
ability to retain list of words in their memory by recruiting participants for two different age
groups that is, the younger people (18 – 34 years old) and older people (65 or older). These two
groups have 100 participants each totaling to 200. The percentage retention scores within the two
groups have been compared through independent sample t-test and accordingly, it has been
identified that there is a statistical significance lies within the means of these two groups as the
significance value comes to 0.000. Further, through correlation analysis, it has been determined
that there is a very low and negative relationship among the memory retention score and spot the
difference game performance in younger adults’ (r= -0.008 and p = 0.939) group while in case of
older adults’, there were the positive and strong relationship identified within the performance in
spot the difference game and memory retention scores (r = 0.830, p = 0.000). The overall
relationship was found to be moderately correlated with r = 0.693 and p = 0.000. At last, it has
been concluded that through good nutrition and appropriate physical and mental exercise in daily
lives, healthy ageing can be ensured.
Table of Contents
ABSTRACT....................................................................................................................................2
INTRODUCTION...........................................................................................................................4
METHODS & MATERIALS..........................................................................................................5
RESULTS........................................................................................................................................6
DISCUSSION & CONCLUSION.................................................................................................15
REFERENCES..............................................................................................................................18
⊘ This is a preview!⊘
Do you want full access?
Subscribe today to unlock all pages.
Trusted by 1+ million students worldwide
INTRODUCTION
Healthy ageing is can be defined as the process through which maintenance and development of
mental and physical functionality in such a manner which in turn facilitates wellbeing while
reaching at older age. Healthy ageing usually include survival to a certain higher age that is, 65
years or older along with being free from any kind of chronic disease which makes it possible to
perform daily life activities autonomously which indicates better quality of life, high level of
social participation with no or little disability Aman, et. al. (2021). In several studies it has been
studied that changes that are taking place within the ability to memorize or think is significantly
resulting from the ageing process. The declination resulting from ageing usually shows the signs
of difficulties in retaining or sustaining attention, slowness in thinking, finding words as well as
holding information in mind.
For the purpose of healthy ageing, it is necessary to take care of mental, physical as well as the
cognitive health Kim, & Jazwinski, (2018). Healthy ageing is associated with better brain &
physical health which comes from combination of physical activity, good nutrition and social &
mental engagement because these factors promotes good health for the brain.
Ageing population usually shows the risks of dementia which involves loss of cognitive
functioning that affects people’s ability to think, remember and reason. Accordingly, their ability
to retain something in their memory decreases. It is a rule of thumb that with ageing, one’s
ability to think, remember, hear and see gets affected because of general changes taking place
due to age Stromsnes, et. al (2021).
Measuring how ageing has the effect over mental or physical health could be possible by
performing testing of individuals belonging from two different groups at regular time intervals.
In this study, the effect of ageing has been determined over the mental health of people through
memory retention scores calculated on the basis of immediate and subsequent delayed memory
test Friedman, et. al. (2019). This will provide a base for how healthy ageing affects the ability of
an individual at young or older age in retaining a list of words in their respective episodic long
term memory. People were given with the list of words containing 15 words and then immediate
testing of their retention power was done followed by spot the difference game and then again
the subsequent memory test was performed.
Paraphrase This Document
Need a fresh take? Get an instant paraphrase of this document with our AI Paraphraser
METHODS & MATERIALS
Participants
To conduct the study, a sample of 200 people have been taken which was considered to be a
sufficient number of participants to the test the hypothesis at an alpha value of 0.05, confidence
level 95% and effect size Cohen’s d = 1.59. For the recruitment of participants, an inclusion and
exclusion criteria was fixed, where those aged below 18 years are excluded while those people
who are above the age of 18 years were selected as the sample of the study and again bifurcated
into two groups Ames, (2018). The first group were those who are younger adults that is, aged
between 18 to 34 years while the second group involves those who are older adults that is, aged
65 years or above. The recruitment period is just of approximately 20 minutes during which the
immediate test, spot the difference game and subsequent delayed memory test was performed.
The participants are belonging from UK and accordingly, the ethical approval was taken from
the Faculty of Health and Life Sciences Research Ethics Committee (reference number: 2021-
297). The exclusion criteria were those individuals who are below 18 years of age or having
some abnormality in their mental or physical appearances. Yes, the consent form was filled prior
to the performance of test and accordingly, the demographics of the study includes 100 people in
each age group. The first age group have 40 males and 60 females while the second age group
have 60 males and 40 females which leads to the overall sample of 100 males and 100 females.
Design & measures
An independent group has been designed based on the age of individuals where younger adults
include those between 18 to 34 years while the older adults include those who are 65+. The
independent variable was taken as the age in years while the dependent variables is the memory
retention scores Serna, & Bergwitz, (2020).
The measure includes a list of 15 words presentation and then the participants were asked
to recall the same in the immediate memory test. Further, the spot the difference game was used
for reducing the probability of participants rehearsing the wordlists for the subsequent memory
test. As a primary measure, percentage of words retained between immediate and subsequent test
was calculated to determine the differences in memory retention among younger & older adults.
Procedure
First of all, ethical approval was taken from Faculty of Health and Life Sciences Research Ethics
Committee (reference number: 2021-297) Wingo, et. al. (2020). Two groups of participants were
formed for younger adults (18-34 years) and for older adults (65+ years). A list of 15 words
presented to recall the same in the immediate memory test followed by a 10 minutes spot the
difference game. After this game, a subsequent memory test was performed to recall the same
wordlist and accordingly, percentage of words retained based on the immediate and subsequent
memory test was calculated to determine how older people have less retention power than
younger people.
Statistical analysis
For the analysis of data, the SPSS (version: 20, IBM) was used. Those individuals who are aged
below the 18 years have been excluded while those between the age group of 35 to 64 years are
not taken into account. Due to the Kurtosis value reported for the variables of interest that is, age
in years, spot the difference game performance and memory retention test score was found to be
lower than -1, the data set related to these variables are found to non-normally distributed Lu,
Pikhart, & Sacker, (2019). For identifying whether there is any statistical difference lies between
the means of memory retention score obtained for younger and older adults, the independent
sample t-test was performed. Further, for determining the relationship between the memory
retention test score and spot the difference game performance, the correlation analysis was done.
A p value of <0.05 was defined as the threshold for statistical significance where a significance
value higher than 0.05 means no statistical significance found within the means of two
independent samples or vice versa Kim, et. al. (2021). At last, all the data have been expressed as
the mean + / - standard error of the mean.
RESULTS
Recruitment
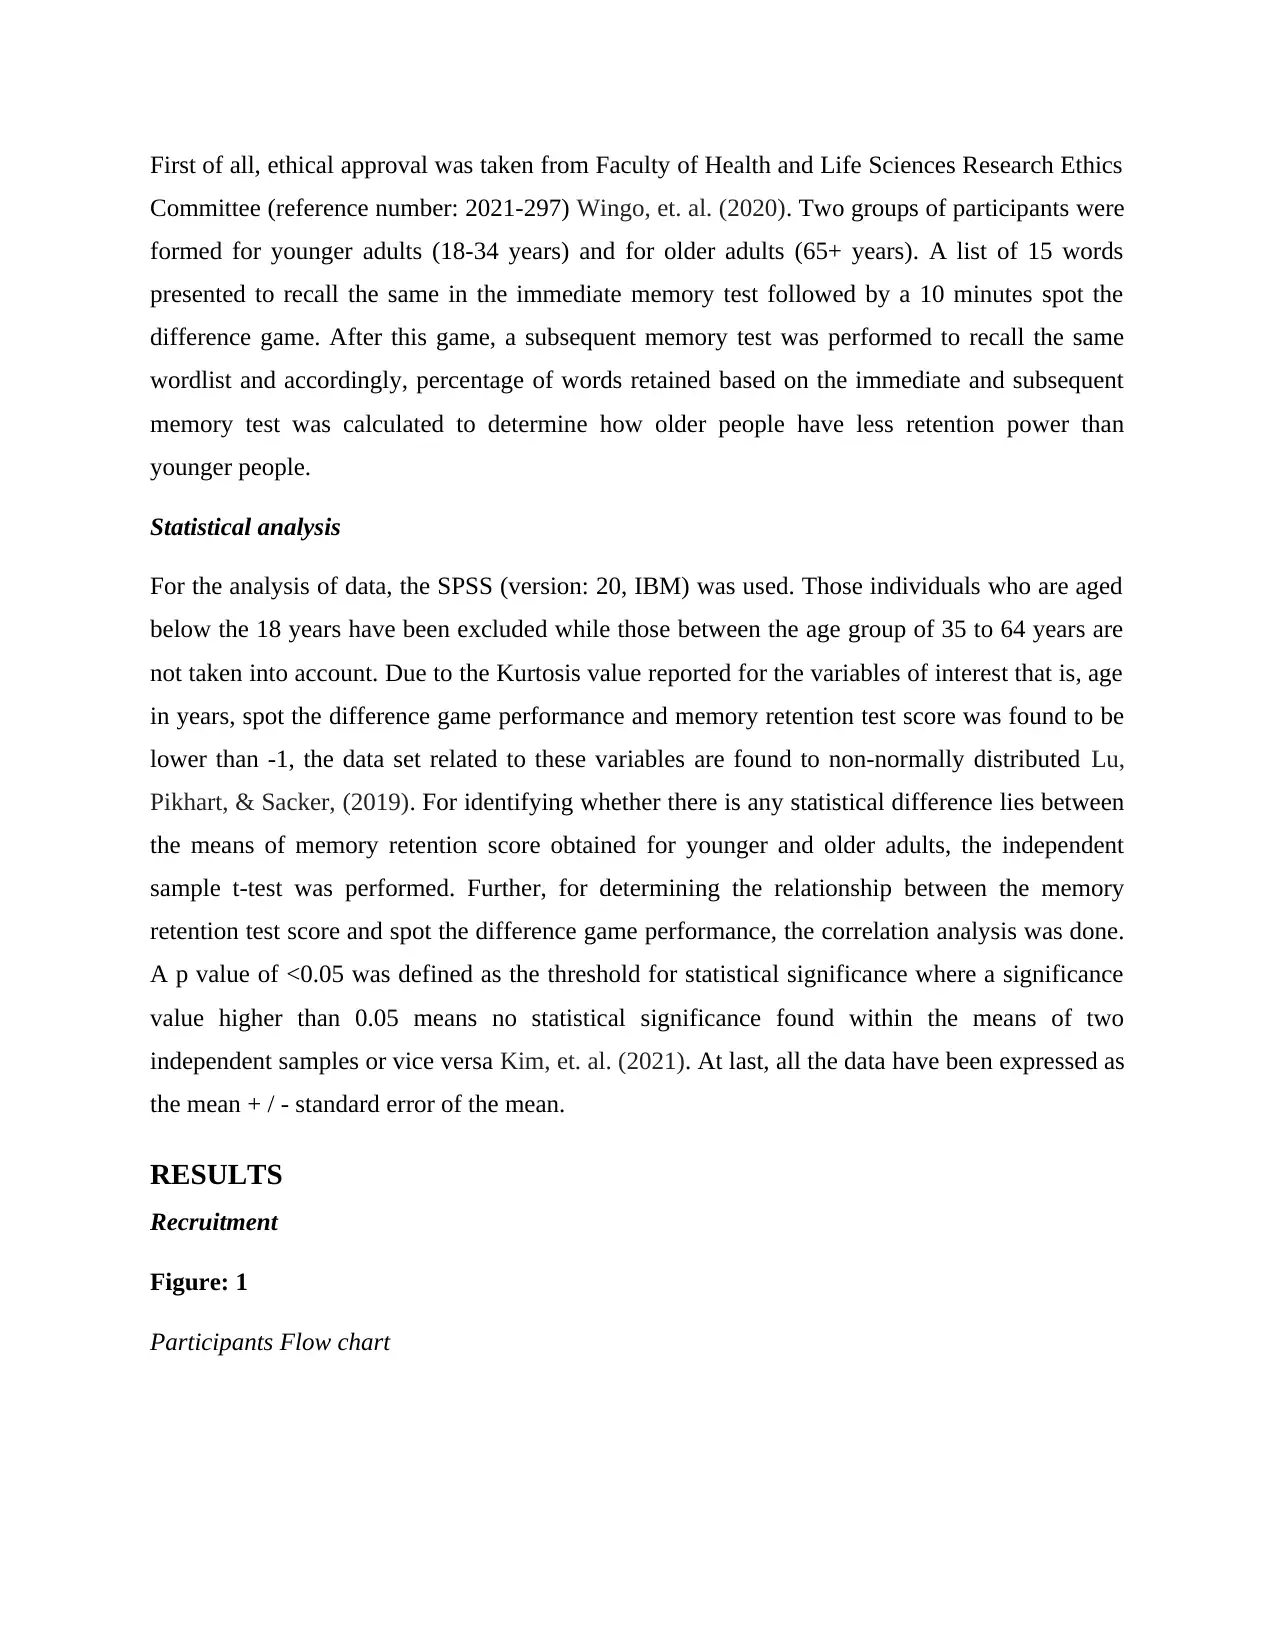
Figure: 1
Participants Flow chart
Committee (reference number: 2021-297) Wingo, et. al. (2020). Two groups of participants were
formed for younger adults (18-34 years) and for older adults (65+ years). A list of 15 words
presented to recall the same in the immediate memory test followed by a 10 minutes spot the
difference game. After this game, a subsequent memory test was performed to recall the same
wordlist and accordingly, percentage of words retained based on the immediate and subsequent
memory test was calculated to determine how older people have less retention power than
younger people.
Statistical analysis
For the analysis of data, the SPSS (version: 20, IBM) was used. Those individuals who are aged
below the 18 years have been excluded while those between the age group of 35 to 64 years are
not taken into account. Due to the Kurtosis value reported for the variables of interest that is, age
in years, spot the difference game performance and memory retention test score was found to be
lower than -1, the data set related to these variables are found to non-normally distributed Lu,
Pikhart, & Sacker, (2019). For identifying whether there is any statistical difference lies between
the means of memory retention score obtained for younger and older adults, the independent
sample t-test was performed. Further, for determining the relationship between the memory
retention test score and spot the difference game performance, the correlation analysis was done.
A p value of <0.05 was defined as the threshold for statistical significance where a significance
value higher than 0.05 means no statistical significance found within the means of two
independent samples or vice versa Kim, et. al. (2021). At last, all the data have been expressed as
the mean + / - standard error of the mean.
RESULTS
Recruitment
Figure: 1
Participants Flow chart
⊘ This is a preview!⊘
Do you want full access?
Subscribe today to unlock all pages.
Trusted by 1+ million students worldwide
Note: Final cohort include 200 participants where 100 were males and 100 were females.
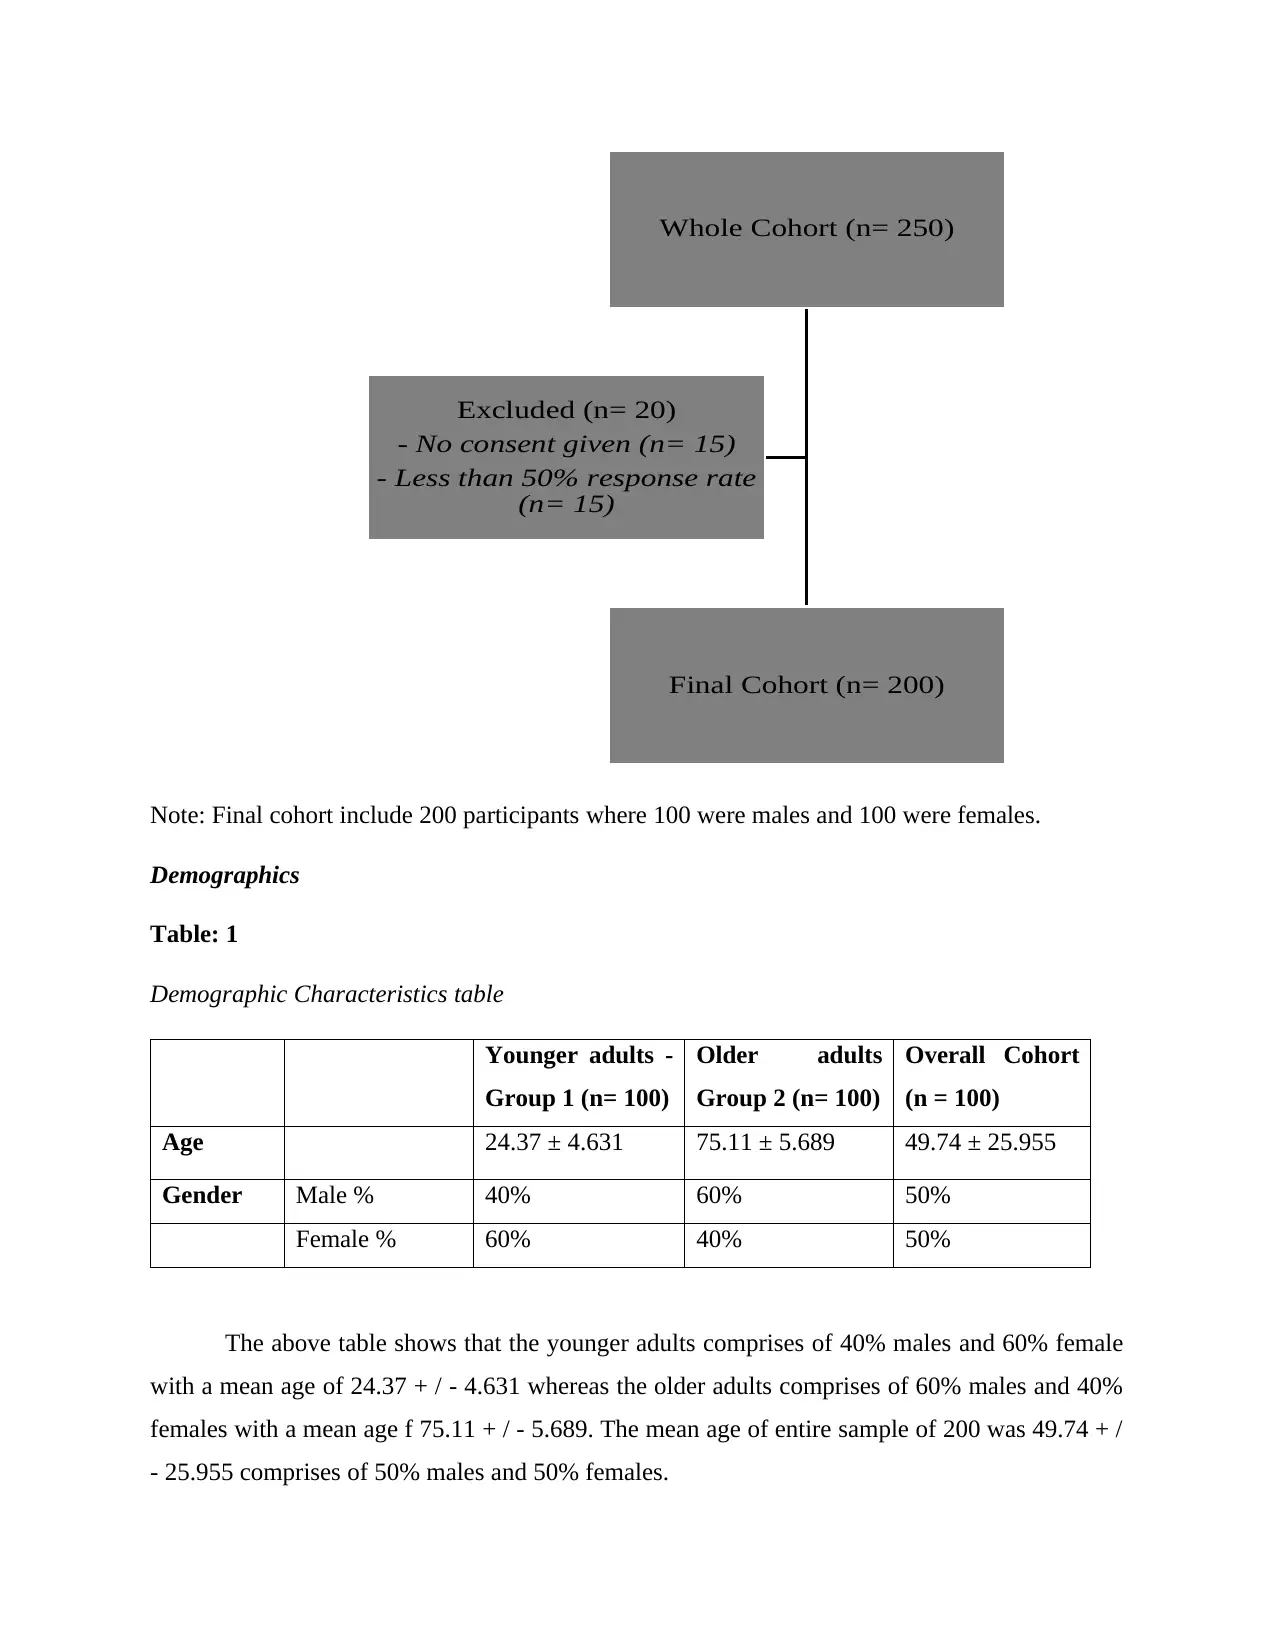
Demographics
Table: 1
Demographic Characteristics table
Younger adults -
Group 1 (n= 100)
Older adults
Group 2 (n= 100)
Overall Cohort
(n = 100)
Age 24.37 ± 4.631 75.11 ± 5.689 49.74 ± 25.955
Gender Male % 40% 60% 50%
Female % 60% 40% 50%
The above table shows that the younger adults comprises of 40% males and 60% female
with a mean age of 24.37 + / - 4.631 whereas the older adults comprises of 60% males and 40%
females with a mean age f 75.11 + / - 5.689. The mean age of entire sample of 200 was 49.74 + /
- 25.955 comprises of 50% males and 50% females.
Whole Cohort (n= 250)
Final Cohort (n= 200)
Excluded (n= 20)
- No consent given (n= 15)
- Less than 50% response rate
(n= 15)
Paraphrase This Document
Need a fresh take? Get an instant paraphrase of this document with our AI Paraphraser
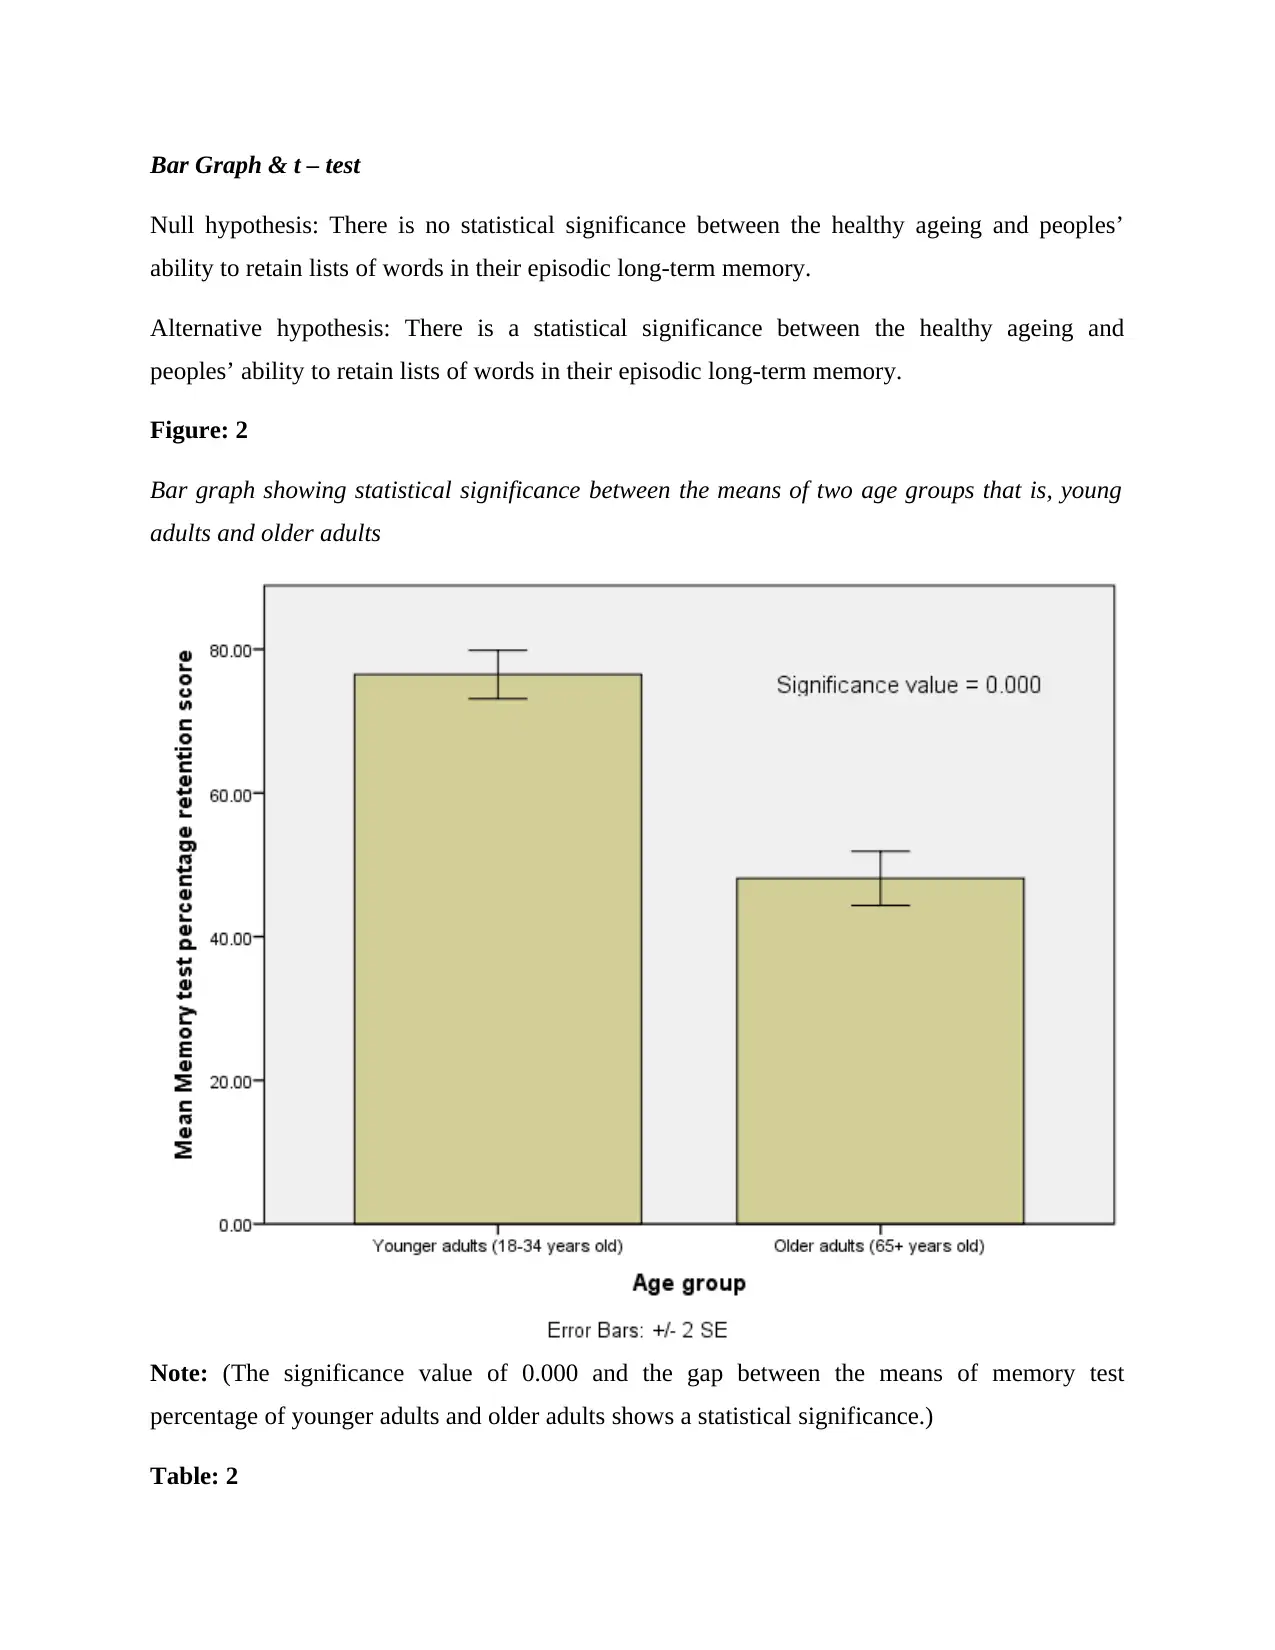
Bar Graph & t – test
Null hypothesis: There is no statistical significance between the healthy ageing and peoples’
ability to retain lists of words in their episodic long-term memory.
Alternative hypothesis: There is a statistical significance between the healthy ageing and
peoples’ ability to retain lists of words in their episodic long-term memory.
Figure: 2
Bar graph showing statistical significance between the means of two age groups that is, young
adults and older adults
Note: (The significance value of 0.000 and the gap between the means of memory test
percentage of younger adults and older adults shows a statistical significance.)
Table: 2
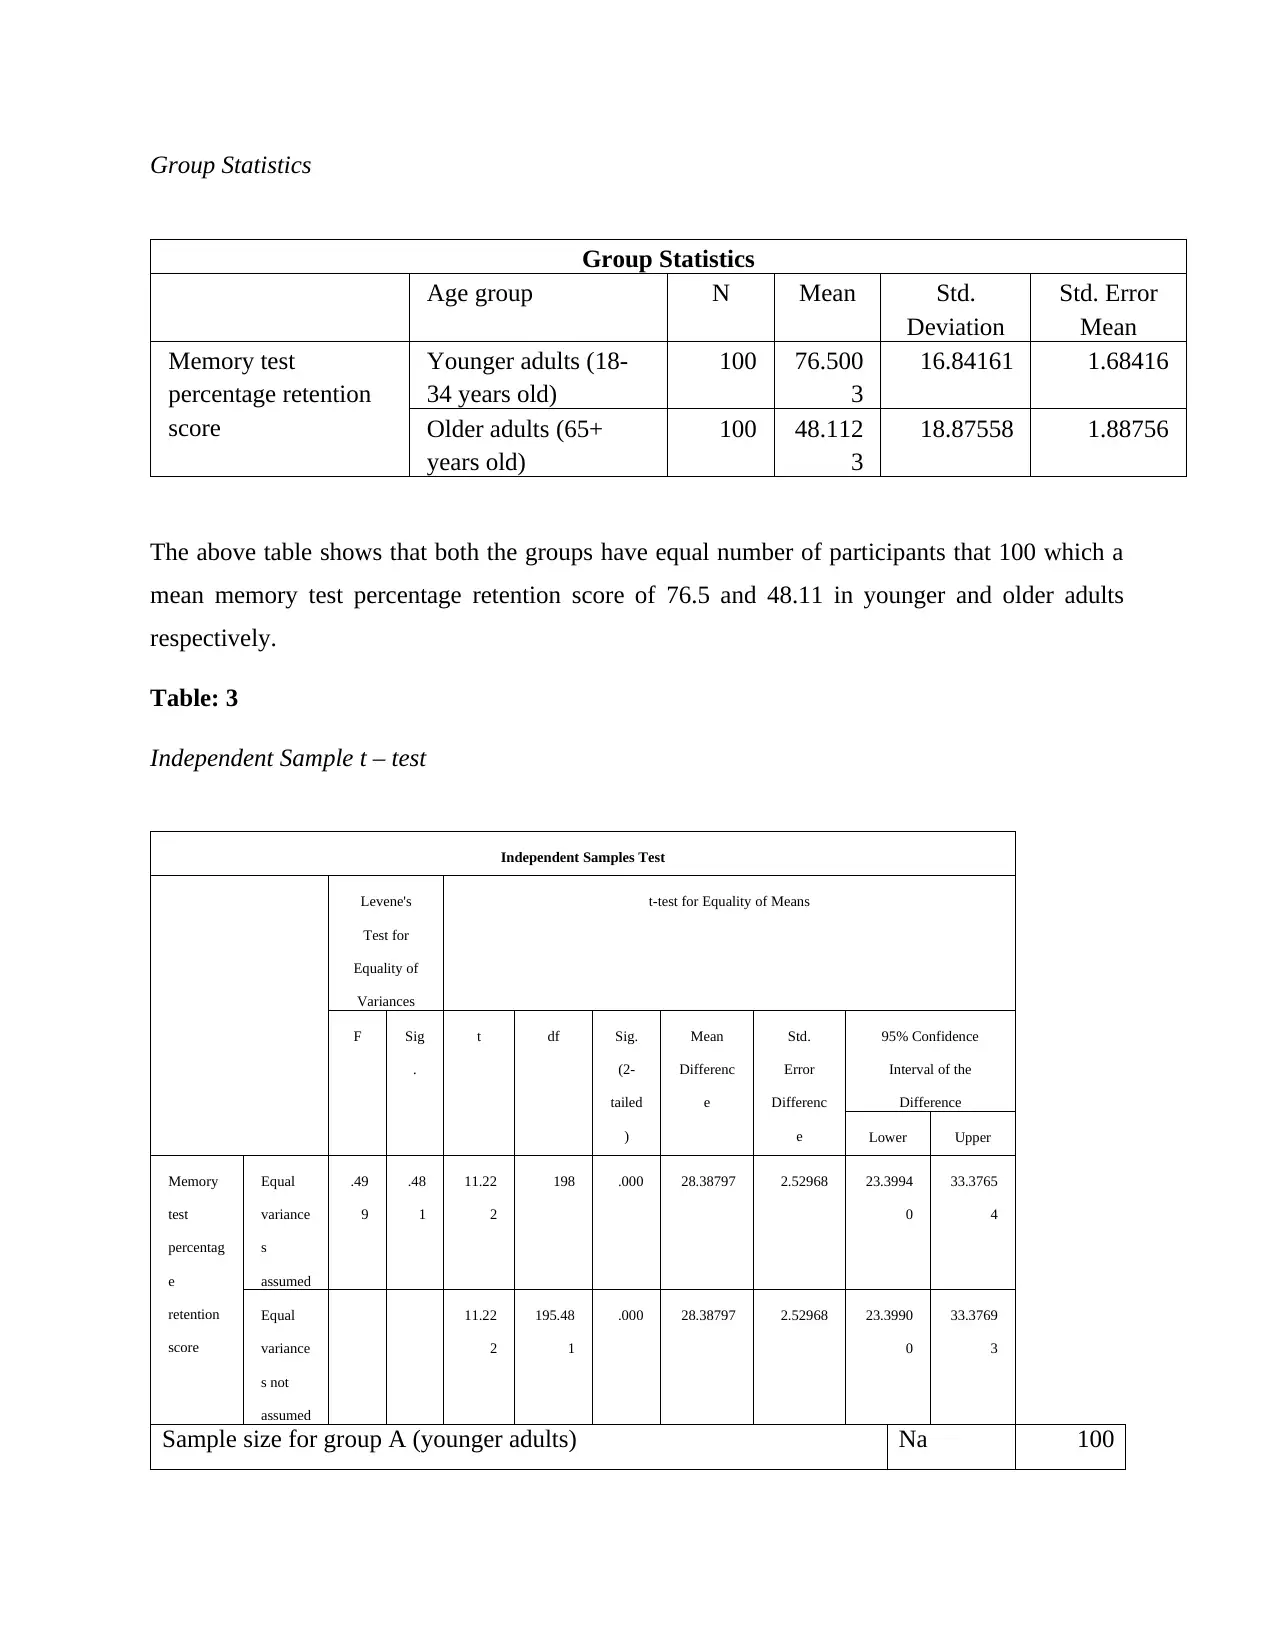
Group Statistics
Group Statistics
Age group N Mean Std.
Deviation
Std. Error
Mean
Memory test
percentage retention
score
Younger adults (18-
34 years old)
100 76.500
3
16.84161 1.68416
Older adults (65+
years old)
100 48.112
3
18.87558 1.88756
The above table shows that both the groups have equal number of participants that 100 which a
mean memory test percentage retention score of 76.5 and 48.11 in younger and older adults
respectively.
Table: 3
Independent Sample t – test
Independent Samples Test
Levene's
Test for
Equality of
Variances
t-test for Equality of Means
F Sig
.
t df Sig.
(2-
tailed
)
Mean
Differenc
e
Std.
Error
Differenc
e
95% Confidence
Interval of the
Difference
Lower Upper
Memory
test
percentag
e
retention
score
Equal
variance
s
assumed
.49
9
.48
1
11.22
2
198 .000 28.38797 2.52968 23.3994
0
33.3765
4
Equal
variance
s not
assumed
11.22
2
195.48
1
.000 28.38797 2.52968 23.3990
0
33.3769
3
Sample size for group A (younger adults) Na 100
⊘ This is a preview!⊘
Do you want full access?
Subscribe today to unlock all pages.
Trusted by 1+ million students worldwide
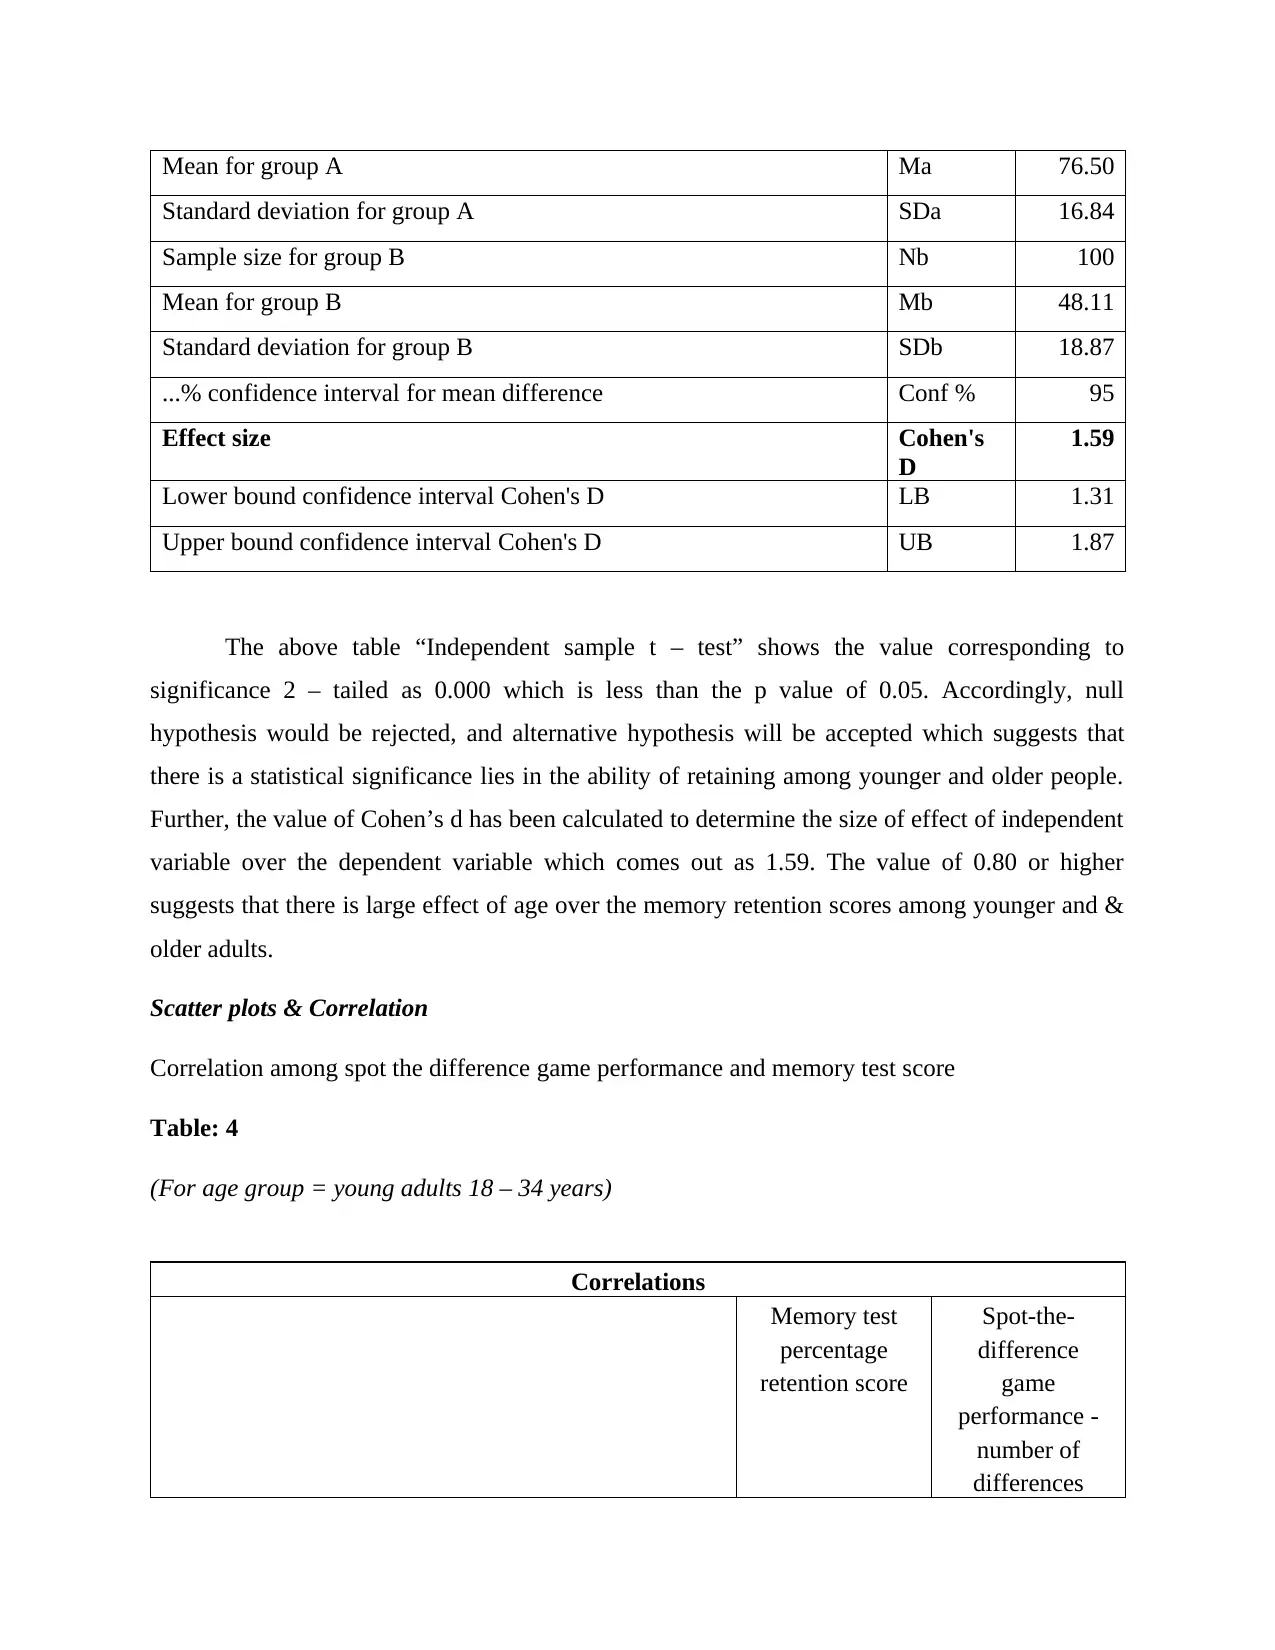
Mean for group A Ma 76.50
Standard deviation for group A SDa 16.84
Sample size for group B Nb 100
Mean for group B Mb 48.11
Standard deviation for group B SDb 18.87
...% confidence interval for mean difference Conf % 95
Effect size Cohen's
D
1.59
Lower bound confidence interval Cohen's D LB 1.31
Upper bound confidence interval Cohen's D UB 1.87
The above table “Independent sample t – test” shows the value corresponding to
significance 2 – tailed as 0.000 which is less than the p value of 0.05. Accordingly, null
hypothesis would be rejected, and alternative hypothesis will be accepted which suggests that
there is a statistical significance lies in the ability of retaining among younger and older people.
Further, the value of Cohen’s d has been calculated to determine the size of effect of independent
variable over the dependent variable which comes out as 1.59. The value of 0.80 or higher
suggests that there is large effect of age over the memory retention scores among younger and &
older adults.
Scatter plots & Correlation
Correlation among spot the difference game performance and memory test score
Table: 4
(For age group = young adults 18 – 34 years)
Correlations
Memory test
percentage
retention score
Spot-the-
difference
game
performance -
number of
differences
Paraphrase This Document
Need a fresh take? Get an instant paraphrase of this document with our AI Paraphraser
found
Memory test percentage
retention score
Pearson Correlation 1 -.008
Sig. (2-tailed) .939
N 100 100
Spot-the-difference game
performance - number of
differences found
Pearson Correlation -.008 1
Sig. (2-tailed) .939
N 100 100
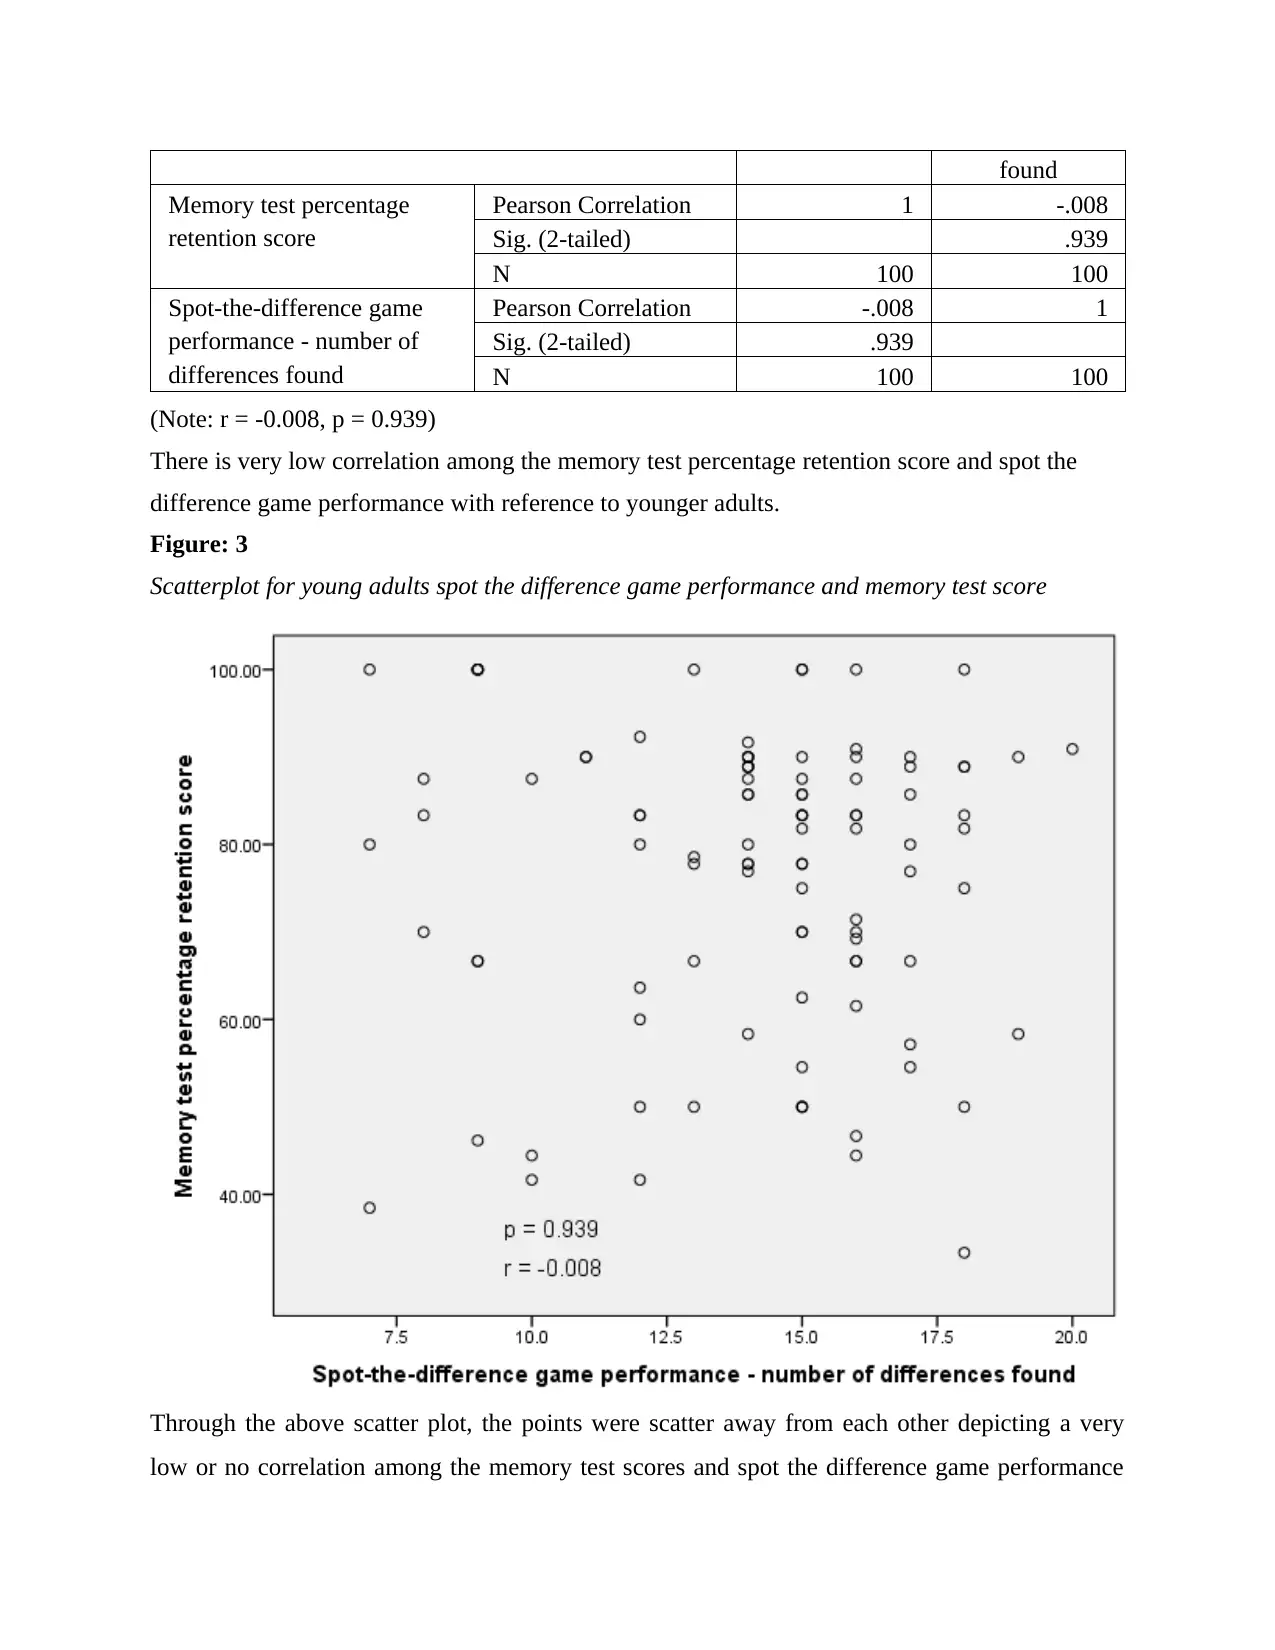
(Note: r = -0.008, p = 0.939)
There is very low correlation among the memory test percentage retention score and spot the
difference game performance with reference to younger adults.
Figure: 3
Scatterplot for young adults spot the difference game performance and memory test score
Through the above scatter plot, the points were scatter away from each other depicting a very
low or no correlation among the memory test scores and spot the difference game performance
Memory test percentage
retention score
Pearson Correlation 1 -.008
Sig. (2-tailed) .939
N 100 100
Spot-the-difference game
performance - number of
differences found
Pearson Correlation -.008 1
Sig. (2-tailed) .939
N 100 100
(Note: r = -0.008, p = 0.939)
There is very low correlation among the memory test percentage retention score and spot the
difference game performance with reference to younger adults.
Figure: 3
Scatterplot for young adults spot the difference game performance and memory test score
Through the above scatter plot, the points were scatter away from each other depicting a very
low or no correlation among the memory test scores and spot the difference game performance
of younger adults. Further, a p value of 0.939, that is higher than 0.05 suggested that there is no
statistical significance between the memory test score and performance in the spot the difference
game.
Table: 5
(For age group = 65+ years old)
Correlations
Memory test
percentage
retention score
Spot-the-
difference
game
performance -
number of
differences
found
Memory test percentage
retention score
Pearson Correlation 1 .830**
Sig. (2-tailed) .000
N 100 100
Spot-the-difference game
performance - number of
differences found
Pearson Correlation .830** 1
Sig. (2-tailed) .000
N 100 100
**. Correlation is significant at the 0.01 level (2-tailed).
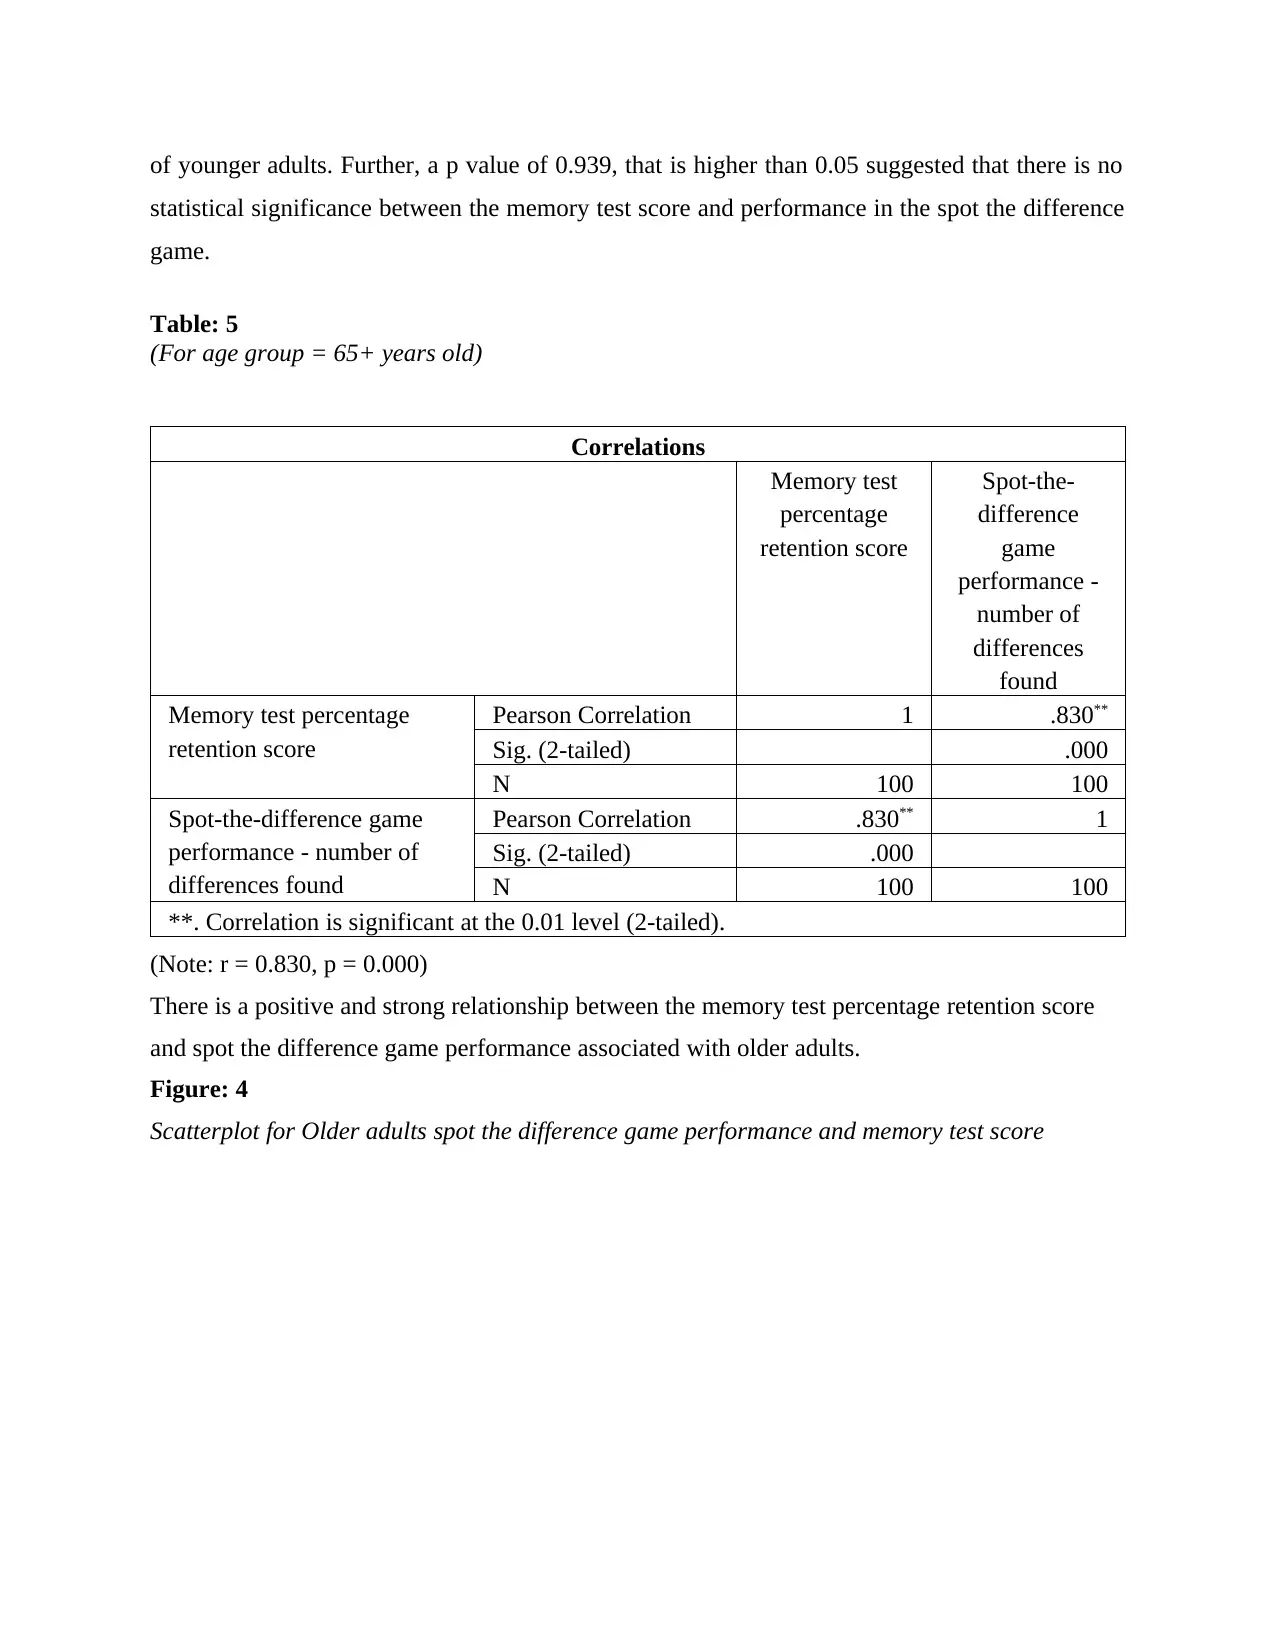
(Note: r = 0.830, p = 0.000)
There is a positive and strong relationship between the memory test percentage retention score
and spot the difference game performance associated with older adults.
Figure: 4
Scatterplot for Older adults spot the difference game performance and memory test score
statistical significance between the memory test score and performance in the spot the difference
game.
Table: 5
(For age group = 65+ years old)
Correlations
Memory test
percentage
retention score
Spot-the-
difference
game
performance -
number of
differences
found
Memory test percentage
retention score
Pearson Correlation 1 .830**
Sig. (2-tailed) .000
N 100 100
Spot-the-difference game
performance - number of
differences found
Pearson Correlation .830** 1
Sig. (2-tailed) .000
N 100 100
**. Correlation is significant at the 0.01 level (2-tailed).
(Note: r = 0.830, p = 0.000)
There is a positive and strong relationship between the memory test percentage retention score
and spot the difference game performance associated with older adults.
Figure: 4
Scatterplot for Older adults spot the difference game performance and memory test score
⊘ This is a preview!⊘
Do you want full access?
Subscribe today to unlock all pages.
Trusted by 1+ million students worldwide
1 out of 19
Related Documents


Your All-in-One AI-Powered Toolkit for Academic Success.
+13062052269
info@desklib.com
Available 24*7 on WhatsApp / Email
![[object Object]](/_next/static/media/star-bottom.7253800d.svg)
Unlock your academic potential
Copyright © 2020–2026 A2Z Services. All Rights Reserved. Developed and managed by ZUCOL.