Analysis of Aggravated Assault Trends in the US: A Criminology Report

Verified

Added on  2023/06/11

|8
|833
|466
Report
AI Summary
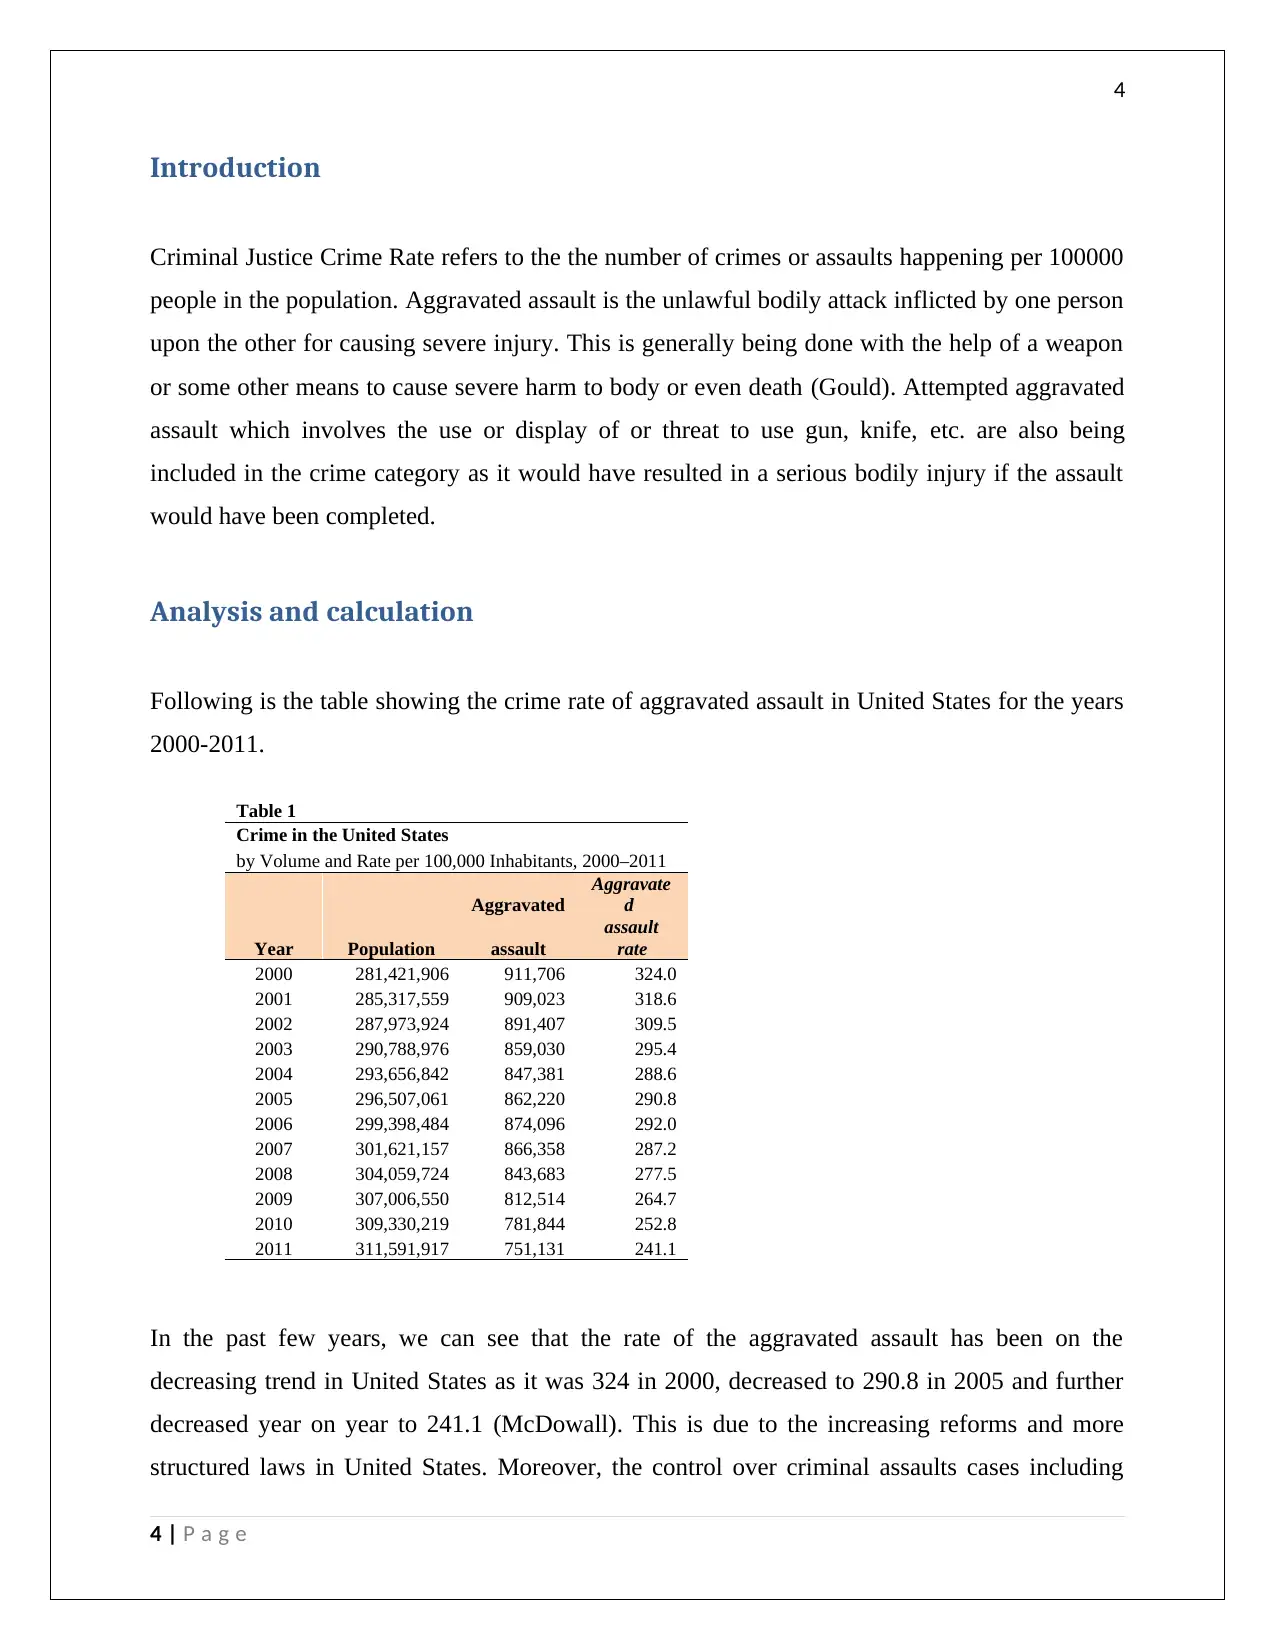
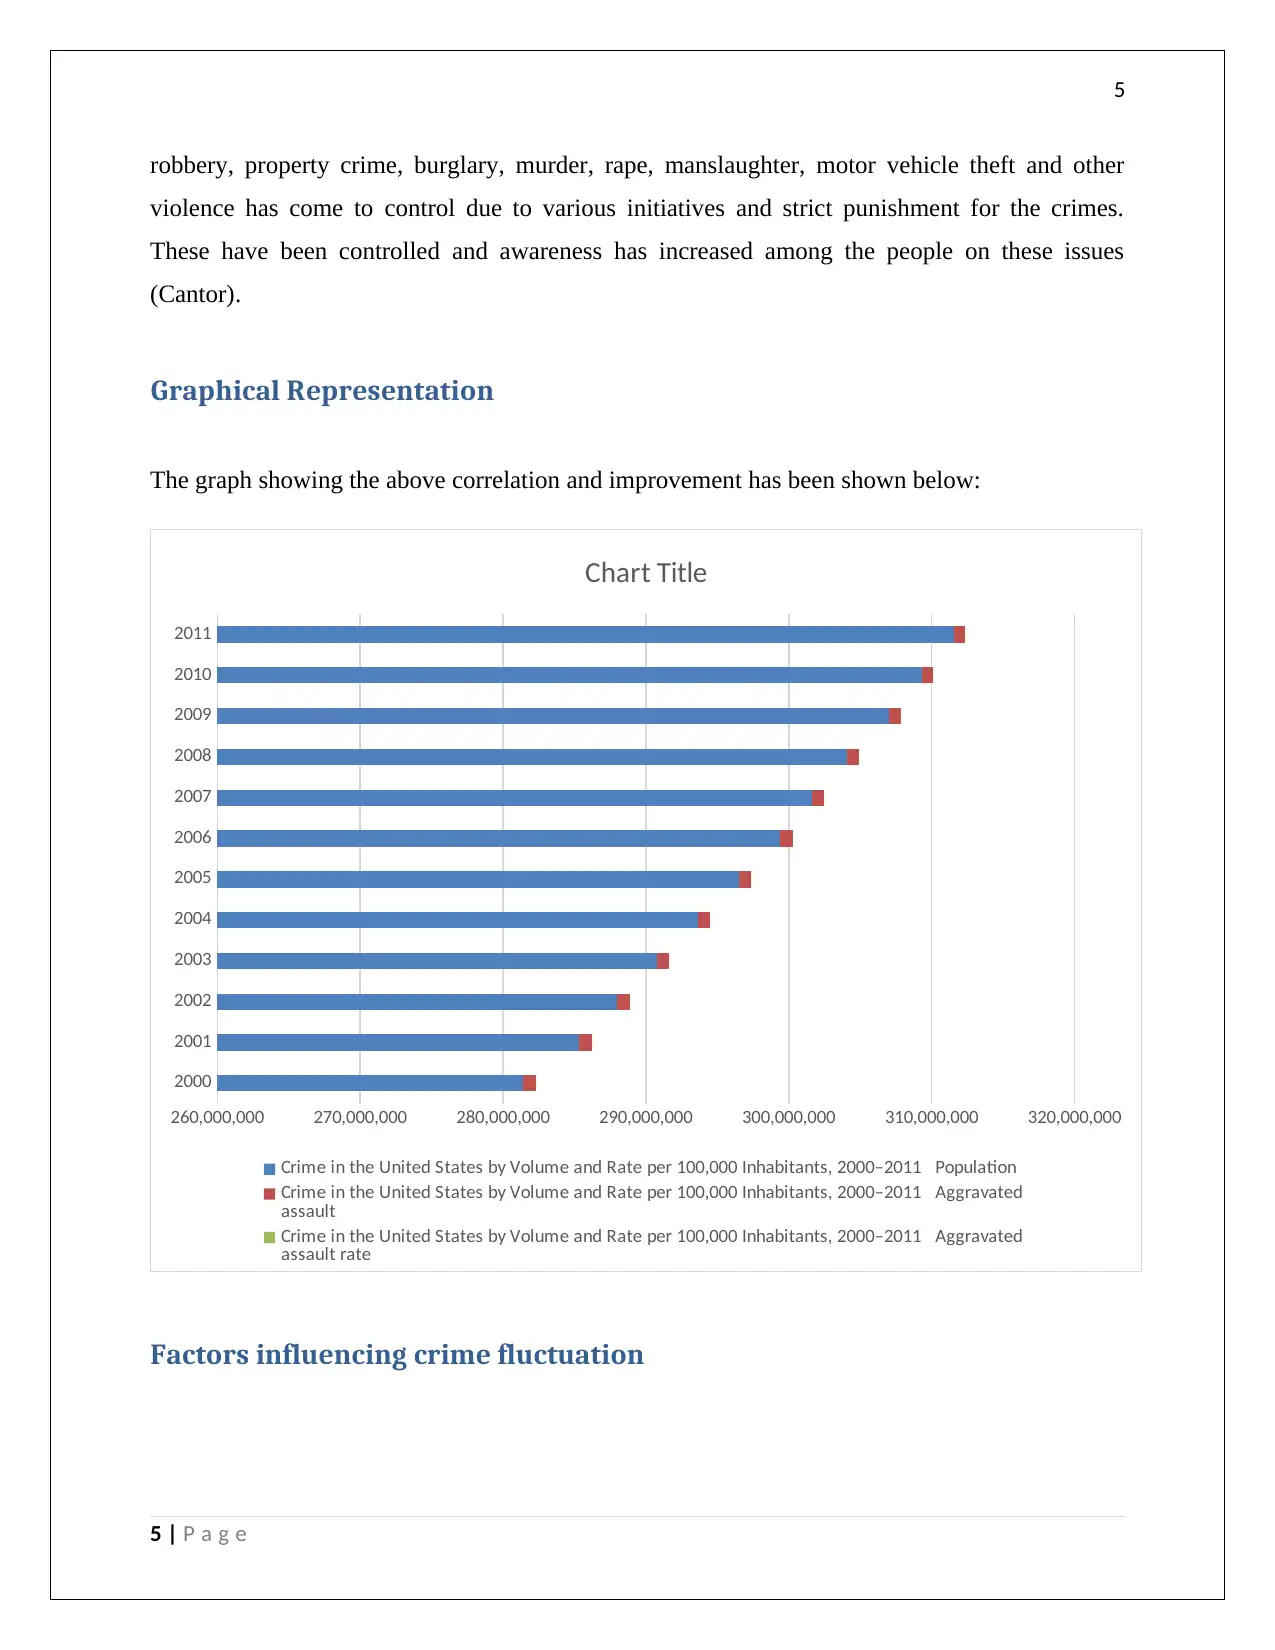
This report examines the trends in aggravated assault rates in the United States between 2000 and 2011, utilizing data from the Uniform Crime Report to calculate crime rates per 100,000 people. The analysis reveals a decreasing trend in aggravated assault rates over the years, attributed to increasing reforms, structured laws, and initiatives aimed at controlling various crimes. Factors influencing these fluctuations include increased public awareness, declining poverty rates, improved neighborhood conditions, and awareness of legal rights. The report also considers the impact of economic growth, decreased alcohol consumption, mass incarceration, and enhanced law enforcement strategies on crime rates. Desklib provides access to similar reports and solved assignments for students.
Document Page
Introduction to
Criminology and
Criminal Justice
tabler-icon-diamond-filled.svg

Paraphrase This Document

Need a fresh take? Get an instant paraphrase of this document with our AI Paraphraser
Document Page
1
By student name
Professor
University
Date: 25 April 2018.
1 | P a g e
Document Page
2
Executive Summary
A report has been prepared on how the rate of aggravated assault has fared in the last 12 years in
United States. Data has been prepared crime rate per 100000 people in a region. The population
and the total number of arrests has been taken from the Uniform Crime Report table. Based on
the above calculation, an analysis has been done as to whether the rate of aggravated assault has
increased or decreased over the years. Finally factors affecting and influencing the crime
fluctuation has also been highlighted.
2 | P a g e
Document Page
3
Contents
Introduction.................................................................................................................................................4
Analysis and calculation...............................................................................................................................4
Graphical Representation............................................................................................................................5
Factors influencing crime fluctuation..........................................................................................................5
References...................................................................................................................................................7
3 | P a g e
tabler-icon-diamond-filled.svg

Paraphrase This Document

Need a fresh take? Get an instant paraphrase of this document with our AI Paraphraser
Document Page
4
Introduction
Criminal Justice Crime Rate refers to the the number of crimes or assaults happening per 100000
people in the population. Aggravated assault is the unlawful bodily attack inflicted by one person
upon the other for causing severe injury. This is generally being done with the help of a weapon
or some other means to cause severe harm to body or even death (Gould). Attempted aggravated
assault which involves the use or display of or threat to use gun, knife, etc. are also being
included in the crime category as it would have resulted in a serious bodily injury if the assault
would have been completed.
Analysis and calculation
Following is the table showing the crime rate of aggravated assault in United States for the years
2000-2011.
Table 1
Crime in the United States
by Volume and Rate per 100,000 Inhabitants, 2000–2011
Year Population
Aggravated
assault
Aggravate
d
assault
rate
2000 281,421,906 911,706 324.0
2001 285,317,559 909,023 318.6
2002 287,973,924 891,407 309.5
2003 290,788,976 859,030 295.4
2004 293,656,842 847,381 288.6
2005 296,507,061 862,220 290.8
2006 299,398,484 874,096 292.0
2007 301,621,157 866,358 287.2
2008 304,059,724 843,683 277.5
2009 307,006,550 812,514 264.7
2010 309,330,219 781,844 252.8
2011 311,591,917 751,131 241.1
In the past few years, we can see that the rate of the aggravated assault has been on the
decreasing trend in United States as it was 324 in 2000, decreased to 290.8 in 2005 and further
decreased year on year to 241.1 (McDowall). This is due to the increasing reforms and more
structured laws in United States. Moreover, the control over criminal assaults cases including
4 | P a g e
Document Page
5
robbery, property crime, burglary, murder, rape, manslaughter, motor vehicle theft and other
violence has come to control due to various initiatives and strict punishment for the crimes.
These have been controlled and awareness has increased among the people on these issues
(Cantor).
Graphical Representation
The graph showing the above correlation and improvement has been shown below:
2000
2001
2002
2003
2004
2005
2006
2007
2008
2009
2010
2011
260,000,000 270,000,000 280,000,000 290,000,000 300,000,000 310,000,000 320,000,000
Chart Title
Crime in the United States by Volume and Rate per 100,000 Inhabitants, 2000–2011 Population
Crime in the United States by Volume and Rate per 100,000 Inhabitants, 2000–2011 Aggravated
assault
Crime in the United States by Volume and Rate per 100,000 Inhabitants, 2000–2011 Aggravated
assault rate
Factors influencing crime fluctuation
5 | P a g e
Document Page
6
There are many factors, which affect the crime rate fluctuation, some of which are awareness
among the people on the impacts and punishments of committing the crime, the rate of poverty
coming down drastically in US in the last 20 years and improvement in the neighbourhood
conditions like ethnicity, race and religion having less great impact on controlling crime rate.
Furthermore, the fluctuations can also be accounted to increase in awareness of the legal rights
like to be informed, to be heard, victim services, etc. (Lynch). Some of the other factors include
economic growth, decrease in the alcohol consumption rate, mass incarnation, law enforcement
and better policing.
6 | P a g e
tabler-icon-diamond-filled.svg

Paraphrase This Document

Need a fresh take? Get an instant paraphrase of this document with our AI Paraphraser
Document Page
7
References
Cantor, David, and Kenneth C. Land. “Unemployment and crime rate fluctuations: A comment on
Greenberg.” Journal of Quantitative Criminology 17.4 (2001): 329-342.
Gould, Eric D., Bruce A. Weinberg, and David B. Mustard. “Crime rates and local labor market
opportunities in the United States: 1979–1997.” Review of Economics and statistics 84.1 (2002):
45-61.
Lynch, Mona. “The culture of control: Crime and social order in contemporary society.” PoLAR: Political
and Legal Anthropology Review 25.2 (2002): 109-112.
McDowall, David, and Colin Loftin. “Are US crime rate trends historically contingent?” Journal of
Research in Crime and Delinquency 42.4 (2005): 359-383.
7 | P a g e
chevron_up_icon
1 out of 8
circle_padding
hide_on_mobile
zoom_out_icon
[object Object]