7251AFE Case Study: Financial Analysis of AGL Energy's Performance
VerifiedAdded on 2023/03/20
|32
|5931
|29
Case Study
AI Summary
This case study provides a comprehensive financial analysis of AGL Energy, an Australian-based company. It examines various aspects, including corporate governance, ownership structure, risk and return profiles, and financing sources. The report assesses AGL's CEO and board of directors, evaluating their roles and responsibilities. It also analyzes the company's social constraints, dividend policies, and historical financial performance. The analysis delves into risk parameters, cost of capital, earnings, and cash flows, providing a detailed valuation using FCFE, DDM, and PE approaches. The study concludes with recommendations regarding investment levels for investors, considering AGL's overall market position and competitive strengths. The study also includes an overview of financing sources, including the benefits and costs of debt, and a peer group analysis to provide a comparative perspective.

Running Head: APPLIED FINANCE 0
Applied Finance
(Student Name)
Applied Finance
(Student Name)
Paraphrase This Document
Need a fresh take? Get an instant paraphrase of this document with our AI Paraphraser
APPLIED FINANCE 1
Executive Summary
AGL energy is an Australian based company. The report focuses over the overall financial and
capital market performance of the company in order to offer a recommendation about the
investment level to investors of the company. The report has been conducted on various aspects
of the company and it has been measured that the investment into the company would offer
better return to the investors. The corporate governance policies have been maintained and
followed by the company properly. Along with that, risk and return level of the company is
average. Further, dividend policies, financial performance and other financial aspects are also in
the favor of the company and depicts that investment into the company would offer huge return
to the company.
APPLIED FINANCE 2
Table of Contents
Executive Summary.....................................................................................................................................1
Introduction.................................................................................................................................................4
Scope of Report.......................................................................................................................................4
Background of Company.........................................................................................................................4
Corporate Governance.................................................................................................................................5
Chief Executive Officer...........................................................................................................................5
Board of Directors...................................................................................................................................5
Ownership Structure................................................................................................................................7
Lenders....................................................................................................................................................8
Financial Market Consideration...............................................................................................................8
Social Constraints....................................................................................................................................9
Risk and return:.........................................................................................................................................10
Historical risk parameters:.........................................................................................................................10
Default risk and cost of debt:.................................................................................................................12
Estimating cost of capital:.....................................................................................................................14
Earnings and cash flows:...........................................................................................................................15
Analyzing the Existing Investment.........................................................................................................15
Assessing the Competitive Strength......................................................................................................18
Evaluating Sustainability of Competitive Strengths...............................................................................20
Financing Sources.....................................................................................................................................20
Current financing...................................................................................................................................20
Benefit of debt.......................................................................................................................................21
Costs of debt..........................................................................................................................................21
Dividend policy.........................................................................................................................................22
Dividend policy analysis.......................................................................................................................22
Firm characteristics:..............................................................................................................................23
Cash/ trust nexus:..................................................................................................................................23
Peer group analysis................................................................................................................................23
⊘ This is a preview!⊘
Do you want full access?
Subscribe today to unlock all pages.
Trusted by 1+ million students worldwide
APPLIED FINANCE 3
Valuation:..................................................................................................................................................24
FCFE approach:.....................................................................................................................................24
DDM approach:.....................................................................................................................................27
PE approach:..........................................................................................................................................28
Conclusion.................................................................................................................................................28
References:................................................................................................................................................29
Appendix...................................................................................................................................................31
Paraphrase This Document
Need a fresh take? Get an instant paraphrase of this document with our AI Paraphraser
APPLIED FINANCE 4
Introduction
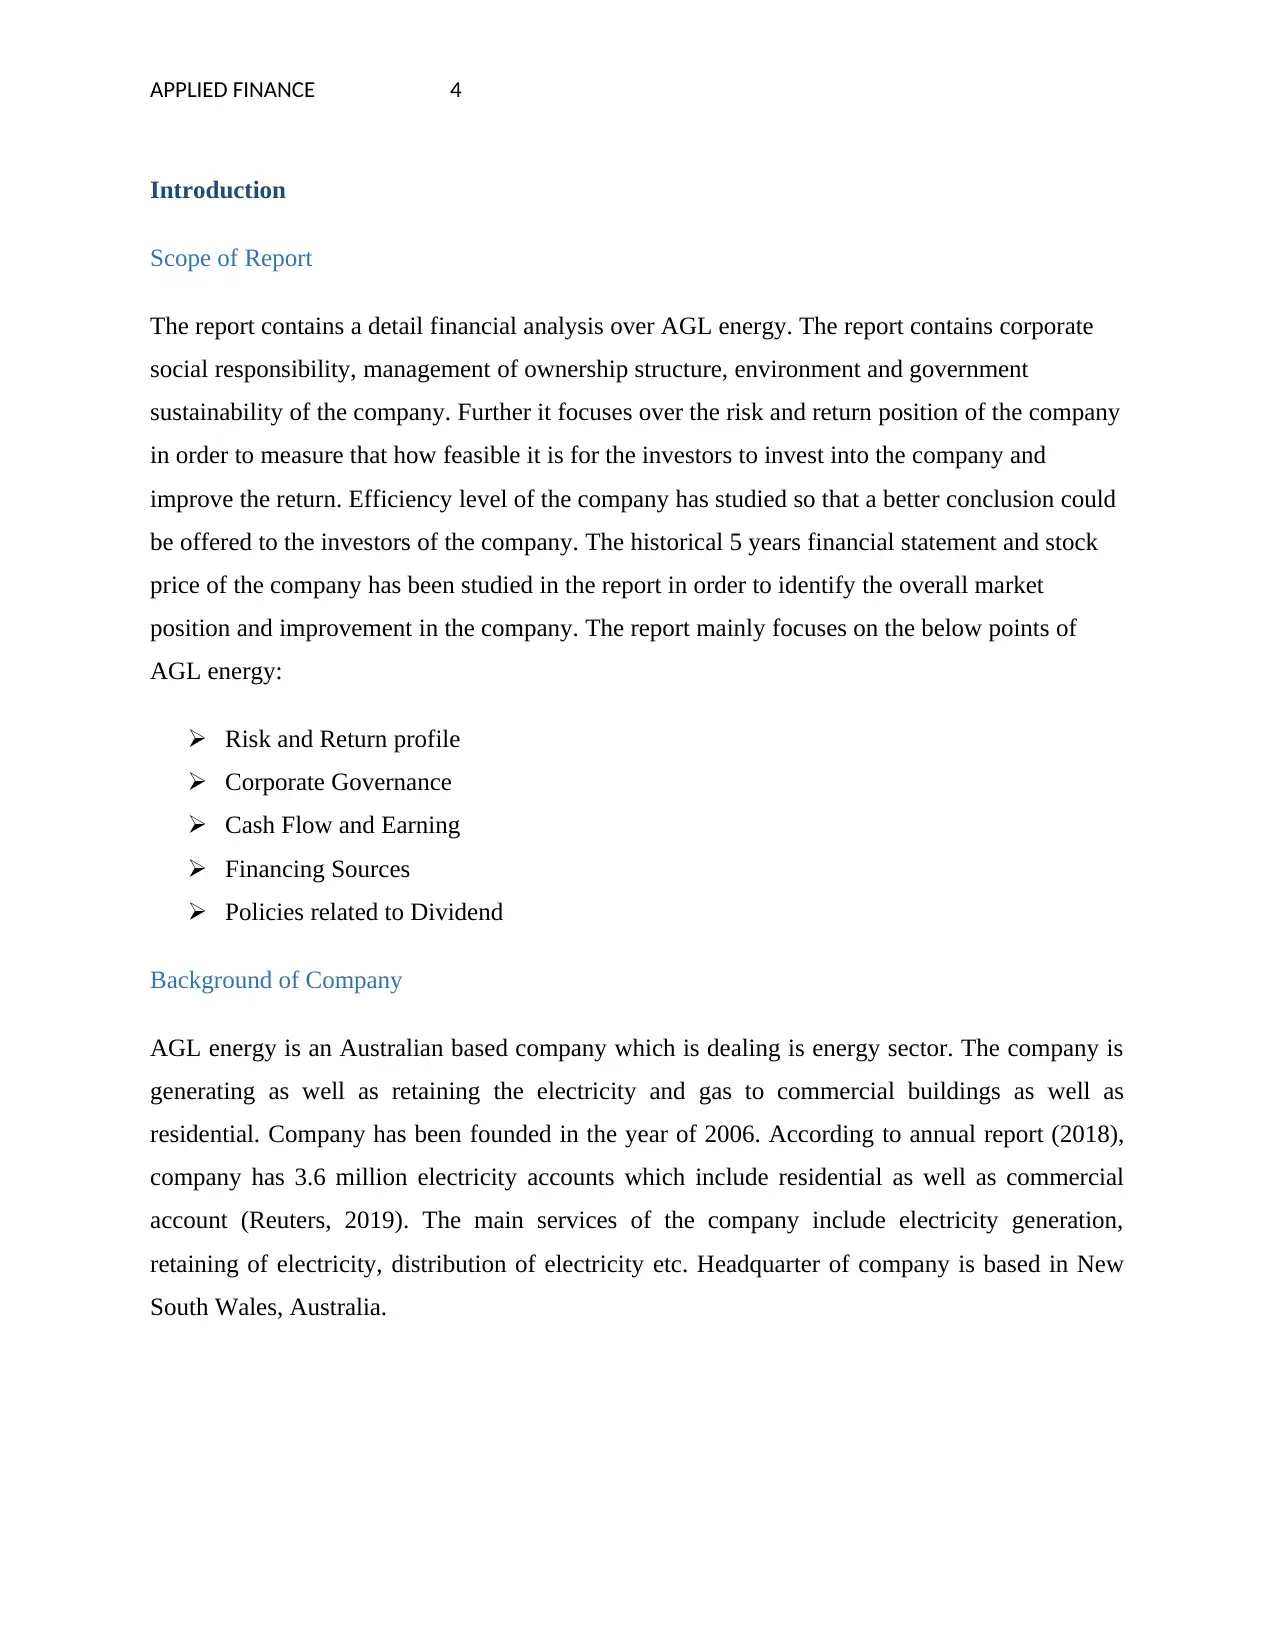
Scope of Report
The report contains a detail financial analysis over AGL energy. The report contains corporate
social responsibility, management of ownership structure, environment and government
sustainability of the company. Further it focuses over the risk and return position of the company
in order to measure that how feasible it is for the investors to invest into the company and
improve the return. Efficiency level of the company has studied so that a better conclusion could
be offered to the investors of the company. The historical 5 years financial statement and stock
price of the company has been studied in the report in order to identify the overall market
position and improvement in the company. The report mainly focuses on the below points of
AGL energy:
Risk and Return profile
Corporate Governance
Cash Flow and Earning
Financing Sources
Policies related to Dividend
Background of Company
AGL energy is an Australian based company which is dealing is energy sector. The company is
generating as well as retaining the electricity and gas to commercial buildings as well as
residential. Company has been founded in the year of 2006. According to annual report (2018),
company has 3.6 million electricity accounts which include residential as well as commercial
account (Reuters, 2019). The main services of the company include electricity generation,
retaining of electricity, distribution of electricity etc. Headquarter of company is based in New
South Wales, Australia.
Introduction
Scope of Report
The report contains a detail financial analysis over AGL energy. The report contains corporate
social responsibility, management of ownership structure, environment and government
sustainability of the company. Further it focuses over the risk and return position of the company
in order to measure that how feasible it is for the investors to invest into the company and
improve the return. Efficiency level of the company has studied so that a better conclusion could
be offered to the investors of the company. The historical 5 years financial statement and stock
price of the company has been studied in the report in order to identify the overall market
position and improvement in the company. The report mainly focuses on the below points of
AGL energy:
Risk and Return profile
Corporate Governance
Cash Flow and Earning
Financing Sources
Policies related to Dividend
Background of Company
AGL energy is an Australian based company which is dealing is energy sector. The company is
generating as well as retaining the electricity and gas to commercial buildings as well as
residential. Company has been founded in the year of 2006. According to annual report (2018),
company has 3.6 million electricity accounts which include residential as well as commercial
account (Reuters, 2019). The main services of the company include electricity generation,
retaining of electricity, distribution of electricity etc. Headquarter of company is based in New
South Wales, Australia.
APPLIED FINANCE 5
Corporate Governance
Chief Executive Officer
Andy Vesey is the CEO of the company. He has been appointed as CEO in the year of
2017. Study explains that AGL is a public limited company and it is not run by a family. Andy
doesn’t have any connection with the entrepreneurs of the company. Andy holds the degree of
BA (Econ), BSc (Mec. Eng.) and MS Managing Director. Over 30 years experience of different
organizations in energy sector is held by him who helped him to get the position of CEO in AGL
energy. He has come from different organization in AGL to grab the opportunity of top level
management. Andy is also the managing director of the company since 2017.
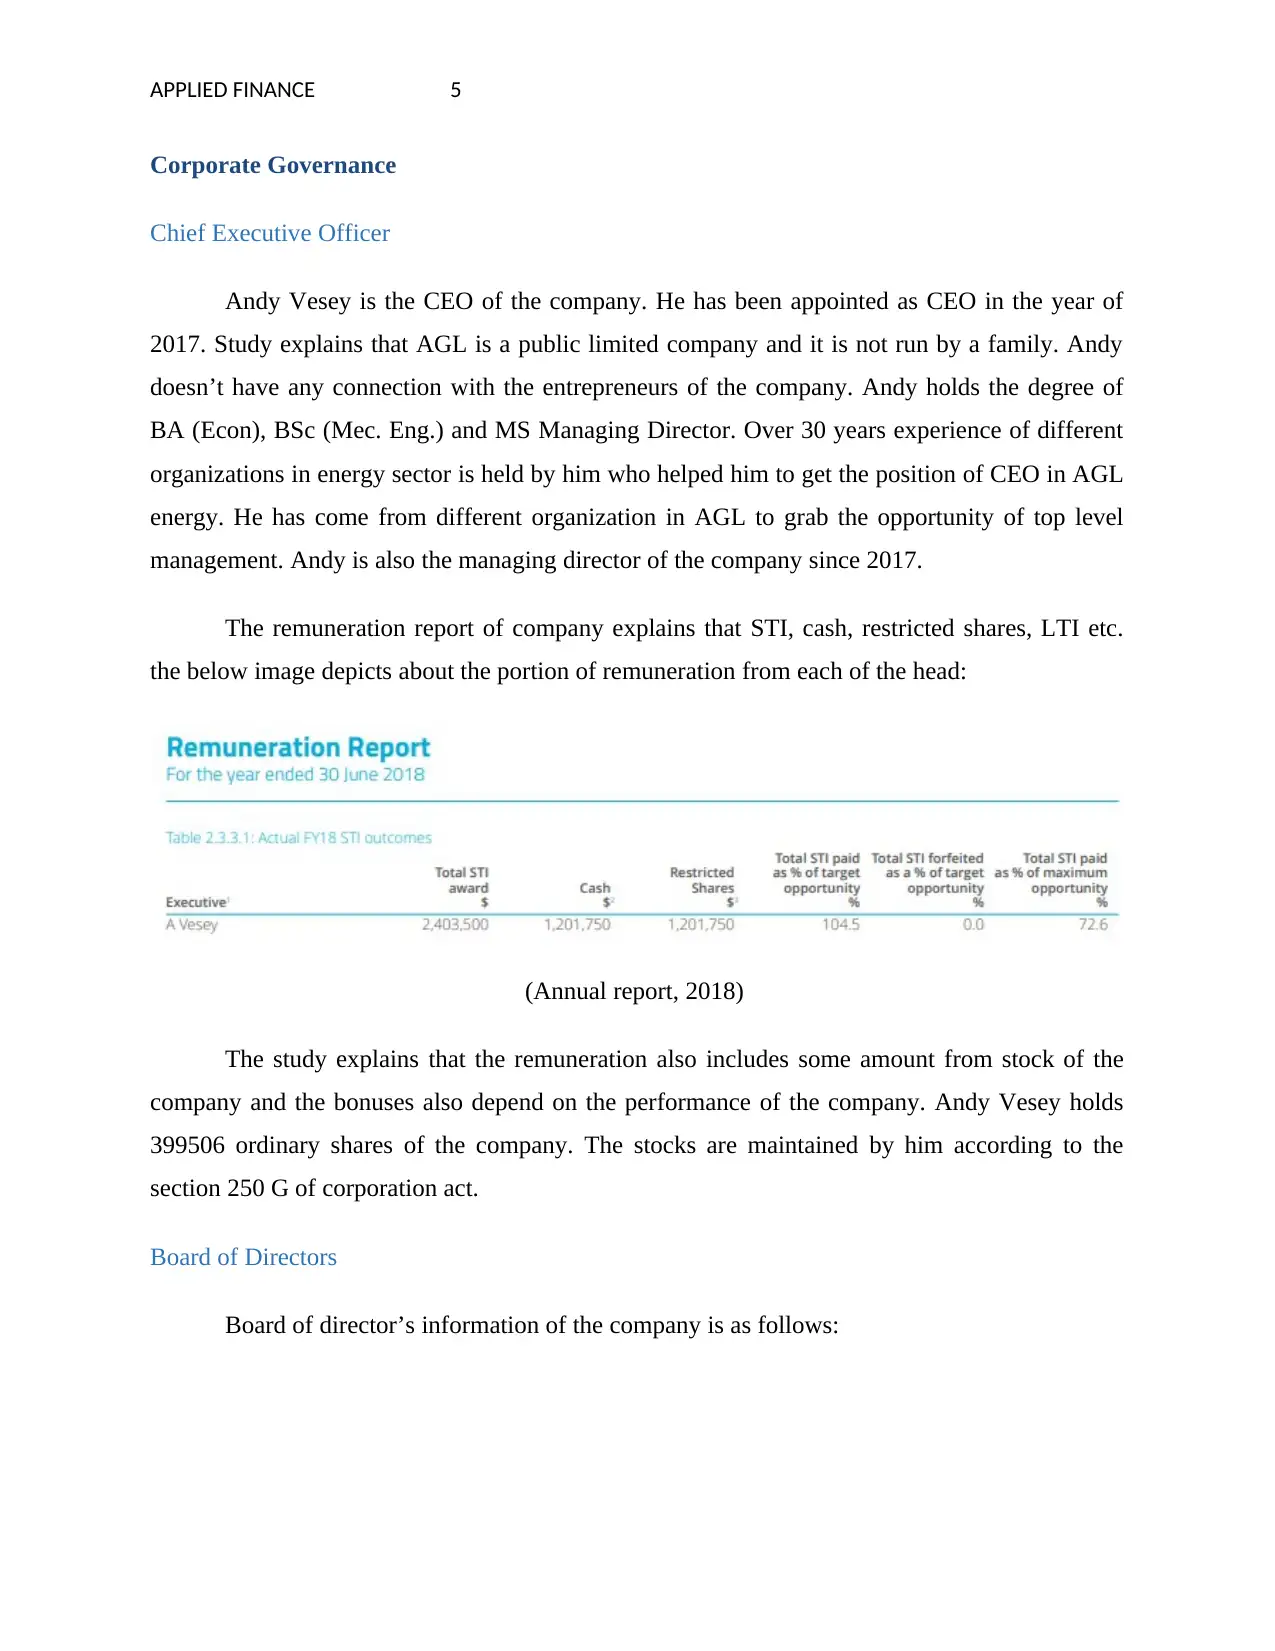
The remuneration report of company explains that STI, cash, restricted shares, LTI etc.
the below image depicts about the portion of remuneration from each of the head:
(Annual report, 2018)
The study explains that the remuneration also includes some amount from stock of the
company and the bonuses also depend on the performance of the company. Andy Vesey holds
399506 ordinary shares of the company. The stocks are maintained by him according to the
section 250 G of corporation act.
Board of Directors
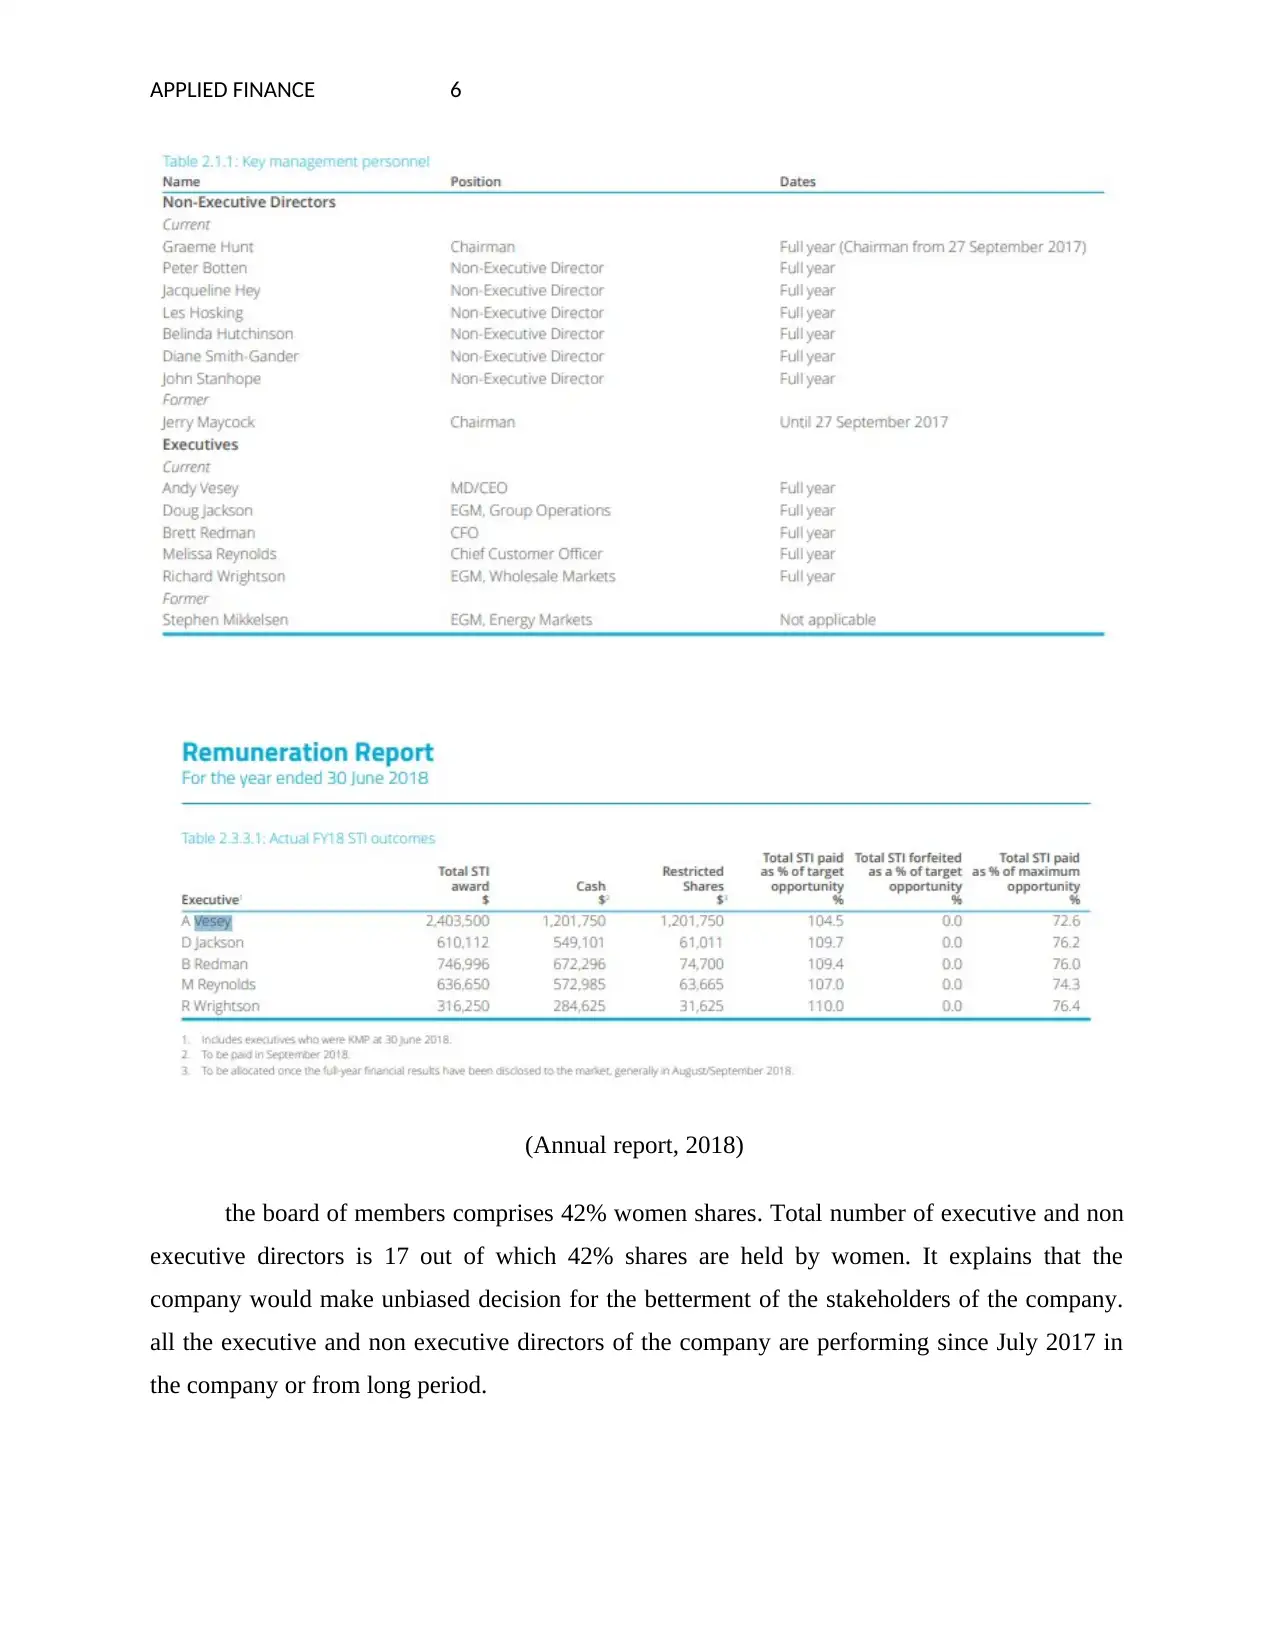
Board of director’s information of the company is as follows:
Corporate Governance
Chief Executive Officer
Andy Vesey is the CEO of the company. He has been appointed as CEO in the year of
2017. Study explains that AGL is a public limited company and it is not run by a family. Andy
doesn’t have any connection with the entrepreneurs of the company. Andy holds the degree of
BA (Econ), BSc (Mec. Eng.) and MS Managing Director. Over 30 years experience of different
organizations in energy sector is held by him who helped him to get the position of CEO in AGL
energy. He has come from different organization in AGL to grab the opportunity of top level
management. Andy is also the managing director of the company since 2017.
The remuneration report of company explains that STI, cash, restricted shares, LTI etc.
the below image depicts about the portion of remuneration from each of the head:
(Annual report, 2018)
The study explains that the remuneration also includes some amount from stock of the
company and the bonuses also depend on the performance of the company. Andy Vesey holds
399506 ordinary shares of the company. The stocks are maintained by him according to the
section 250 G of corporation act.
Board of Directors
Board of director’s information of the company is as follows:
⊘ This is a preview!⊘
Do you want full access?
Subscribe today to unlock all pages.
Trusted by 1+ million students worldwide
APPLIED FINANCE 6
(Annual report, 2018)
the board of members comprises 42% women shares. Total number of executive and non
executive directors is 17 out of which 42% shares are held by women. It explains that the
company would make unbiased decision for the betterment of the stakeholders of the company.
all the executive and non executive directors of the company are performing since July 2017 in
the company or from long period.
Paraphrase This Document
Need a fresh take? Get an instant paraphrase of this document with our AI Paraphraser
APPLIED FINANCE 7
All non-executive directors and executive director’s background have been checked and found
that they don’t have any connection with the client, supplier and customers directly. Further, the
study briefs each department head have substantial qualification and knowledge about that
department such as law committee is handled by a law expert. 3 exceptive and non executive
directors of the company are CEO in other firm. The stocks are maintained by him according to
the section 250 G of corporation act (Annual report, 2018). there is in total 11 meeting of
directors in the year to maintain the performance and make better decisions for the company.
Ownership Structure
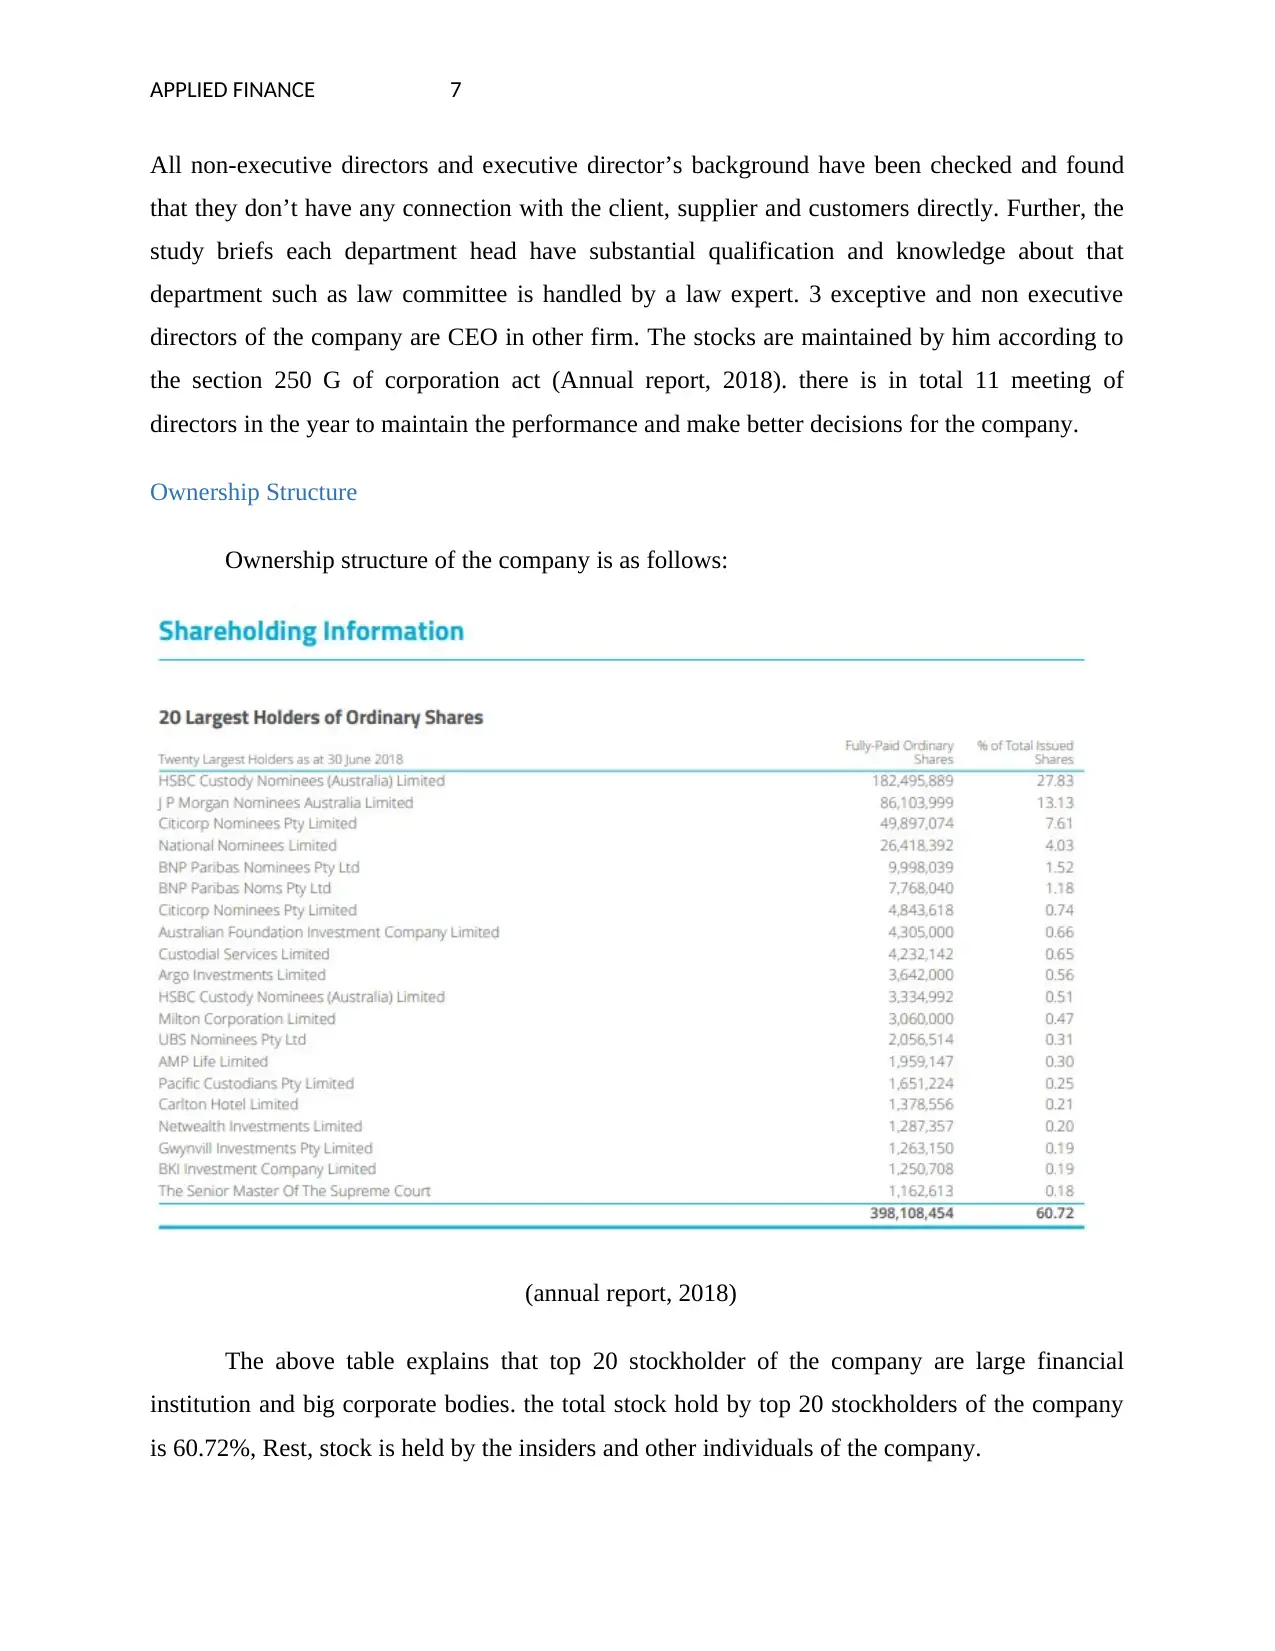
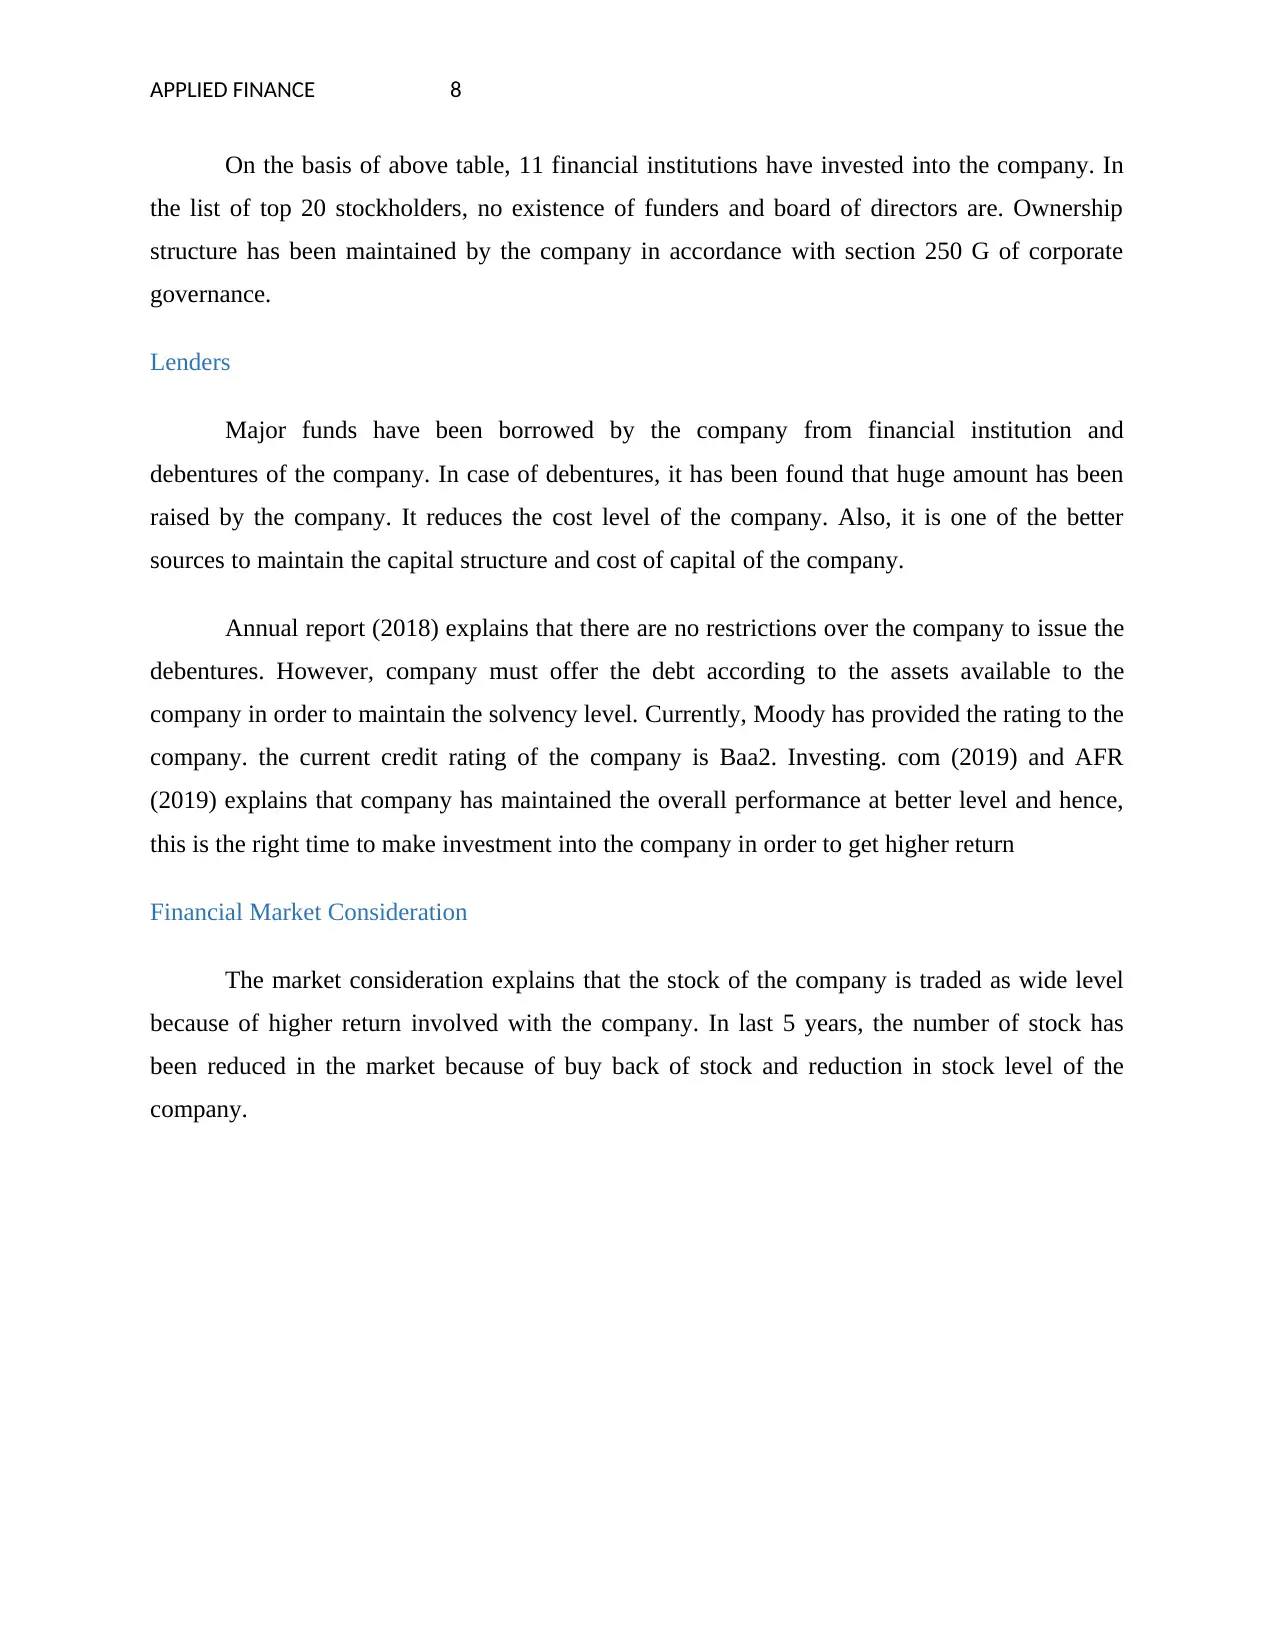
Ownership structure of the company is as follows:
(annual report, 2018)
The above table explains that top 20 stockholder of the company are large financial
institution and big corporate bodies. the total stock hold by top 20 stockholders of the company
is 60.72%, Rest, stock is held by the insiders and other individuals of the company.
All non-executive directors and executive director’s background have been checked and found
that they don’t have any connection with the client, supplier and customers directly. Further, the
study briefs each department head have substantial qualification and knowledge about that
department such as law committee is handled by a law expert. 3 exceptive and non executive
directors of the company are CEO in other firm. The stocks are maintained by him according to
the section 250 G of corporation act (Annual report, 2018). there is in total 11 meeting of
directors in the year to maintain the performance and make better decisions for the company.
Ownership Structure
Ownership structure of the company is as follows:
(annual report, 2018)
The above table explains that top 20 stockholder of the company are large financial
institution and big corporate bodies. the total stock hold by top 20 stockholders of the company
is 60.72%, Rest, stock is held by the insiders and other individuals of the company.
APPLIED FINANCE 8
On the basis of above table, 11 financial institutions have invested into the company. In
the list of top 20 stockholders, no existence of funders and board of directors are. Ownership
structure has been maintained by the company in accordance with section 250 G of corporate
governance.
Lenders
Major funds have been borrowed by the company from financial institution and
debentures of the company. In case of debentures, it has been found that huge amount has been
raised by the company. It reduces the cost level of the company. Also, it is one of the better
sources to maintain the capital structure and cost of capital of the company.
Annual report (2018) explains that there are no restrictions over the company to issue the
debentures. However, company must offer the debt according to the assets available to the
company in order to maintain the solvency level. Currently, Moody has provided the rating to the
company. the current credit rating of the company is Baa2. Investing. com (2019) and AFR
(2019) explains that company has maintained the overall performance at better level and hence,
this is the right time to make investment into the company in order to get higher return
Financial Market Consideration
The market consideration explains that the stock of the company is traded as wide level
because of higher return involved with the company. In last 5 years, the number of stock has
been reduced in the market because of buy back of stock and reduction in stock level of the
company.
On the basis of above table, 11 financial institutions have invested into the company. In
the list of top 20 stockholders, no existence of funders and board of directors are. Ownership
structure has been maintained by the company in accordance with section 250 G of corporate
governance.
Lenders
Major funds have been borrowed by the company from financial institution and
debentures of the company. In case of debentures, it has been found that huge amount has been
raised by the company. It reduces the cost level of the company. Also, it is one of the better
sources to maintain the capital structure and cost of capital of the company.
Annual report (2018) explains that there are no restrictions over the company to issue the
debentures. However, company must offer the debt according to the assets available to the
company in order to maintain the solvency level. Currently, Moody has provided the rating to the
company. the current credit rating of the company is Baa2. Investing. com (2019) and AFR
(2019) explains that company has maintained the overall performance at better level and hence,
this is the right time to make investment into the company in order to get higher return
Financial Market Consideration
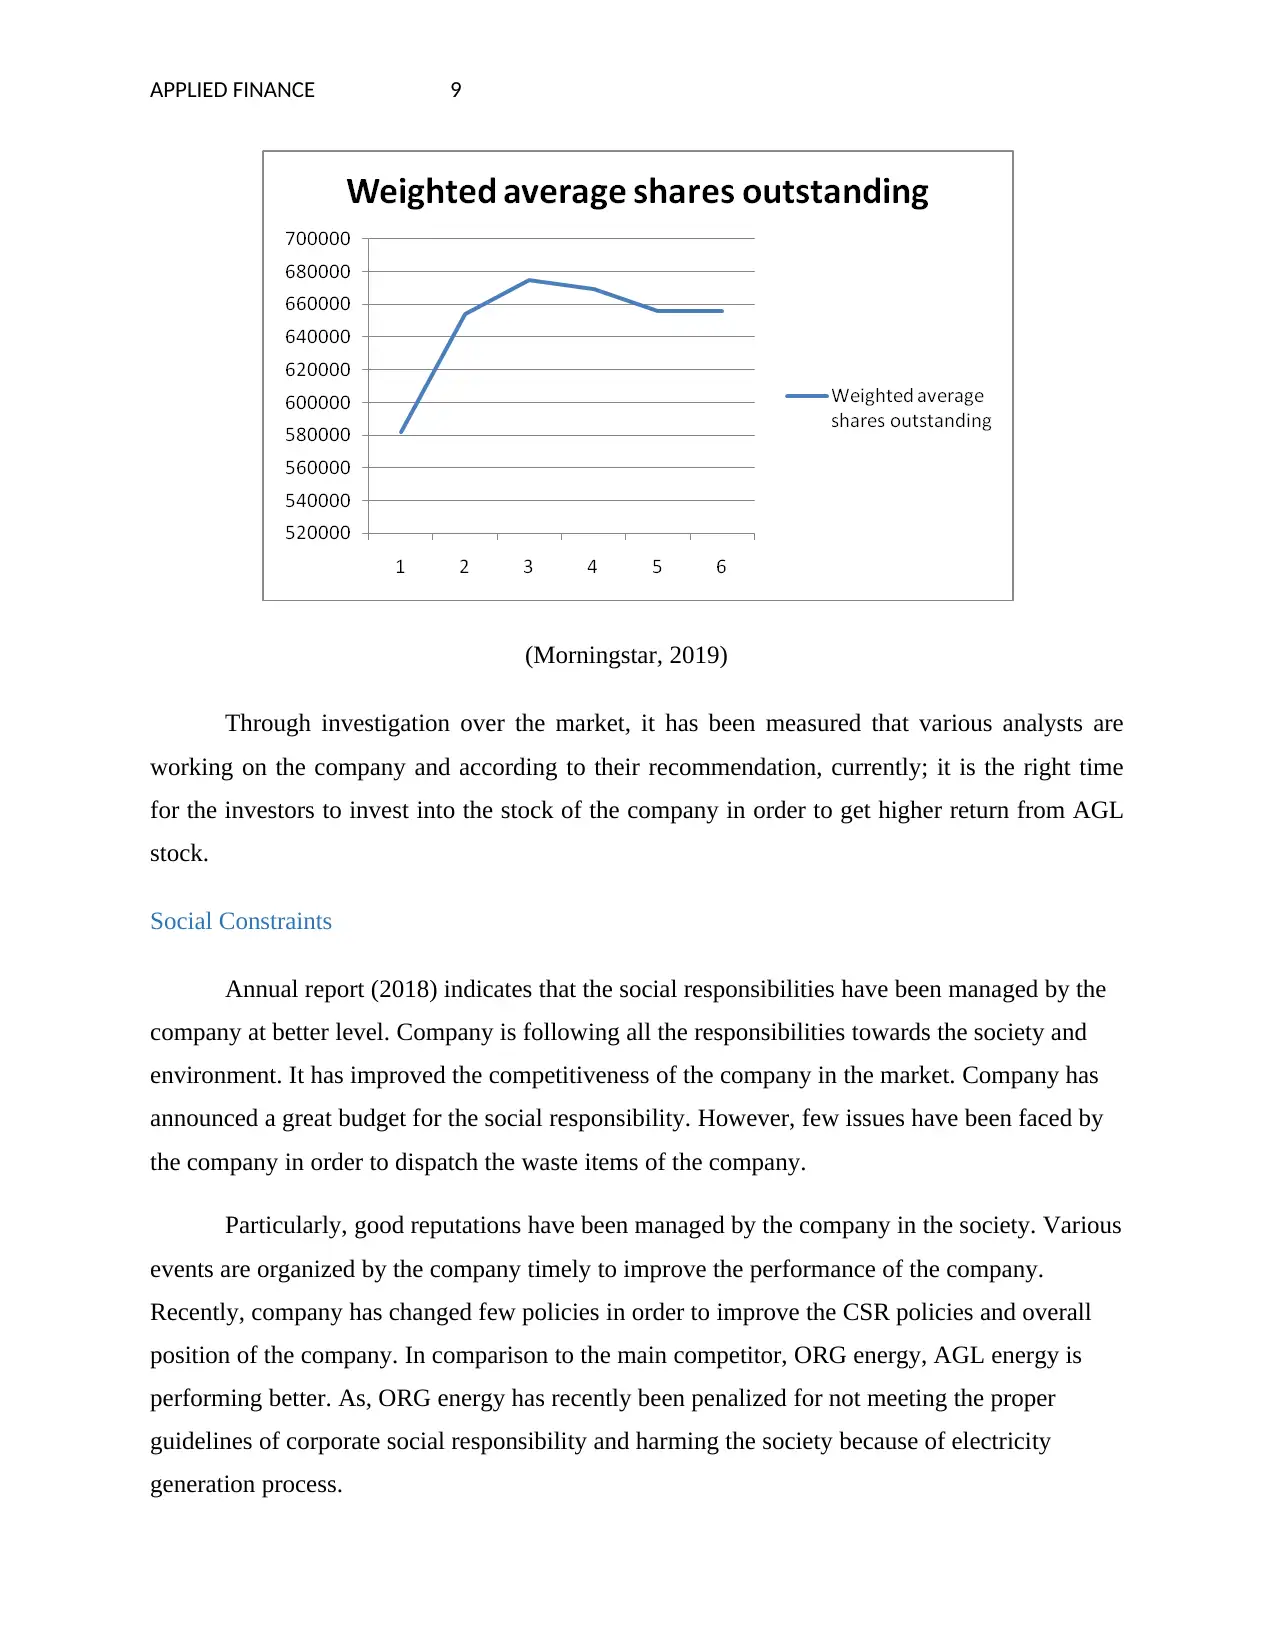
The market consideration explains that the stock of the company is traded as wide level
because of higher return involved with the company. In last 5 years, the number of stock has
been reduced in the market because of buy back of stock and reduction in stock level of the
company.
⊘ This is a preview!⊘
Do you want full access?
Subscribe today to unlock all pages.
Trusted by 1+ million students worldwide
APPLIED FINANCE 9
(Morningstar, 2019)
Through investigation over the market, it has been measured that various analysts are
working on the company and according to their recommendation, currently; it is the right time
for the investors to invest into the stock of the company in order to get higher return from AGL
stock.
Social Constraints
Annual report (2018) indicates that the social responsibilities have been managed by the
company at better level. Company is following all the responsibilities towards the society and
environment. It has improved the competitiveness of the company in the market. Company has
announced a great budget for the social responsibility. However, few issues have been faced by
the company in order to dispatch the waste items of the company.
Particularly, good reputations have been managed by the company in the society. Various
events are organized by the company timely to improve the performance of the company.
Recently, company has changed few policies in order to improve the CSR policies and overall
position of the company. In comparison to the main competitor, ORG energy, AGL energy is
performing better. As, ORG energy has recently been penalized for not meeting the proper
guidelines of corporate social responsibility and harming the society because of electricity
generation process.
Paraphrase This Document
Need a fresh take? Get an instant paraphrase of this document with our AI Paraphraser
APPLIED FINANCE 10
Risk and return:
Historical risk parameters:
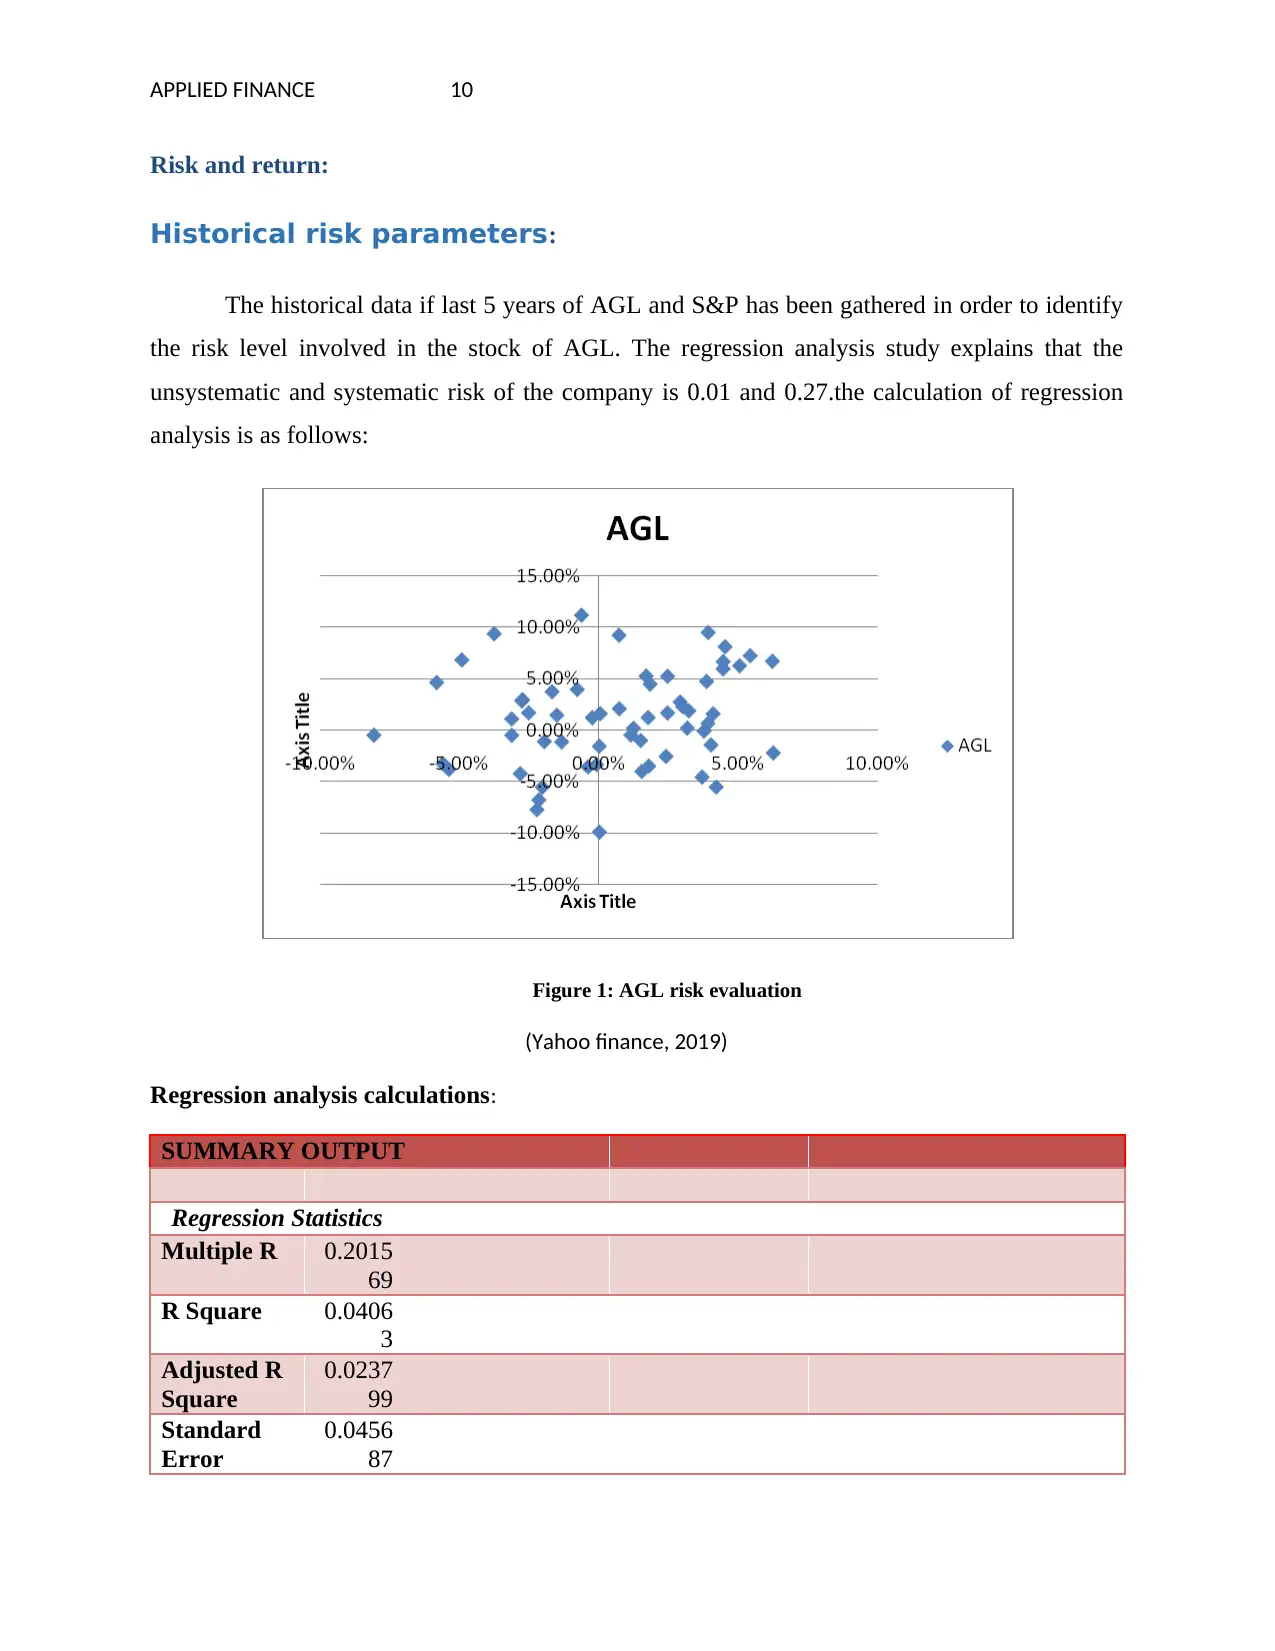
The historical data if last 5 years of AGL and S&P has been gathered in order to identify
the risk level involved in the stock of AGL. The regression analysis study explains that the
unsystematic and systematic risk of the company is 0.01 and 0.27.the calculation of regression
analysis is as follows:
Figure 1: AGL risk evaluation
(Yahoo finance, 2019)
Regression analysis calculations:
SUMMARY OUTPUT
Regression Statistics
Multiple R 0.2015
69
R Square 0.0406
3
Adjusted R
Square
0.0237
99
Standard
Error
0.0456
87
Risk and return:
Historical risk parameters:
The historical data if last 5 years of AGL and S&P has been gathered in order to identify
the risk level involved in the stock of AGL. The regression analysis study explains that the
unsystematic and systematic risk of the company is 0.01 and 0.27.the calculation of regression
analysis is as follows:
Figure 1: AGL risk evaluation
(Yahoo finance, 2019)
Regression analysis calculations:
SUMMARY OUTPUT
Regression Statistics
Multiple R 0.2015
69
R Square 0.0406
3
Adjusted R
Square
0.0237
99
Standard
Error
0.0456
87
APPLIED FINANCE 11
Observation
s
59
ANOVA
df SS MS F Significa
nce F
Regression 1 0.005039 0.005
039
2.414
002
0.12579
Residual 57 0.118976 0.002
087
Total 58 0.124014
Coeffic
ients
Standard
Error
t Stat P-
value
Lower
95%
Upper
95%
Lower
95.0%
Upper
95.0%
Intercept 0.0101
21
0.006051 1.672
755
0.099
856
-0.00199 0.0222
37
-
0.00199
0.02223
7
X Variable
1
0.2787
51
0.179411 1.553
706
0.125
79
-0.08051 0.6380
15
-
0.08051
0.63801
5
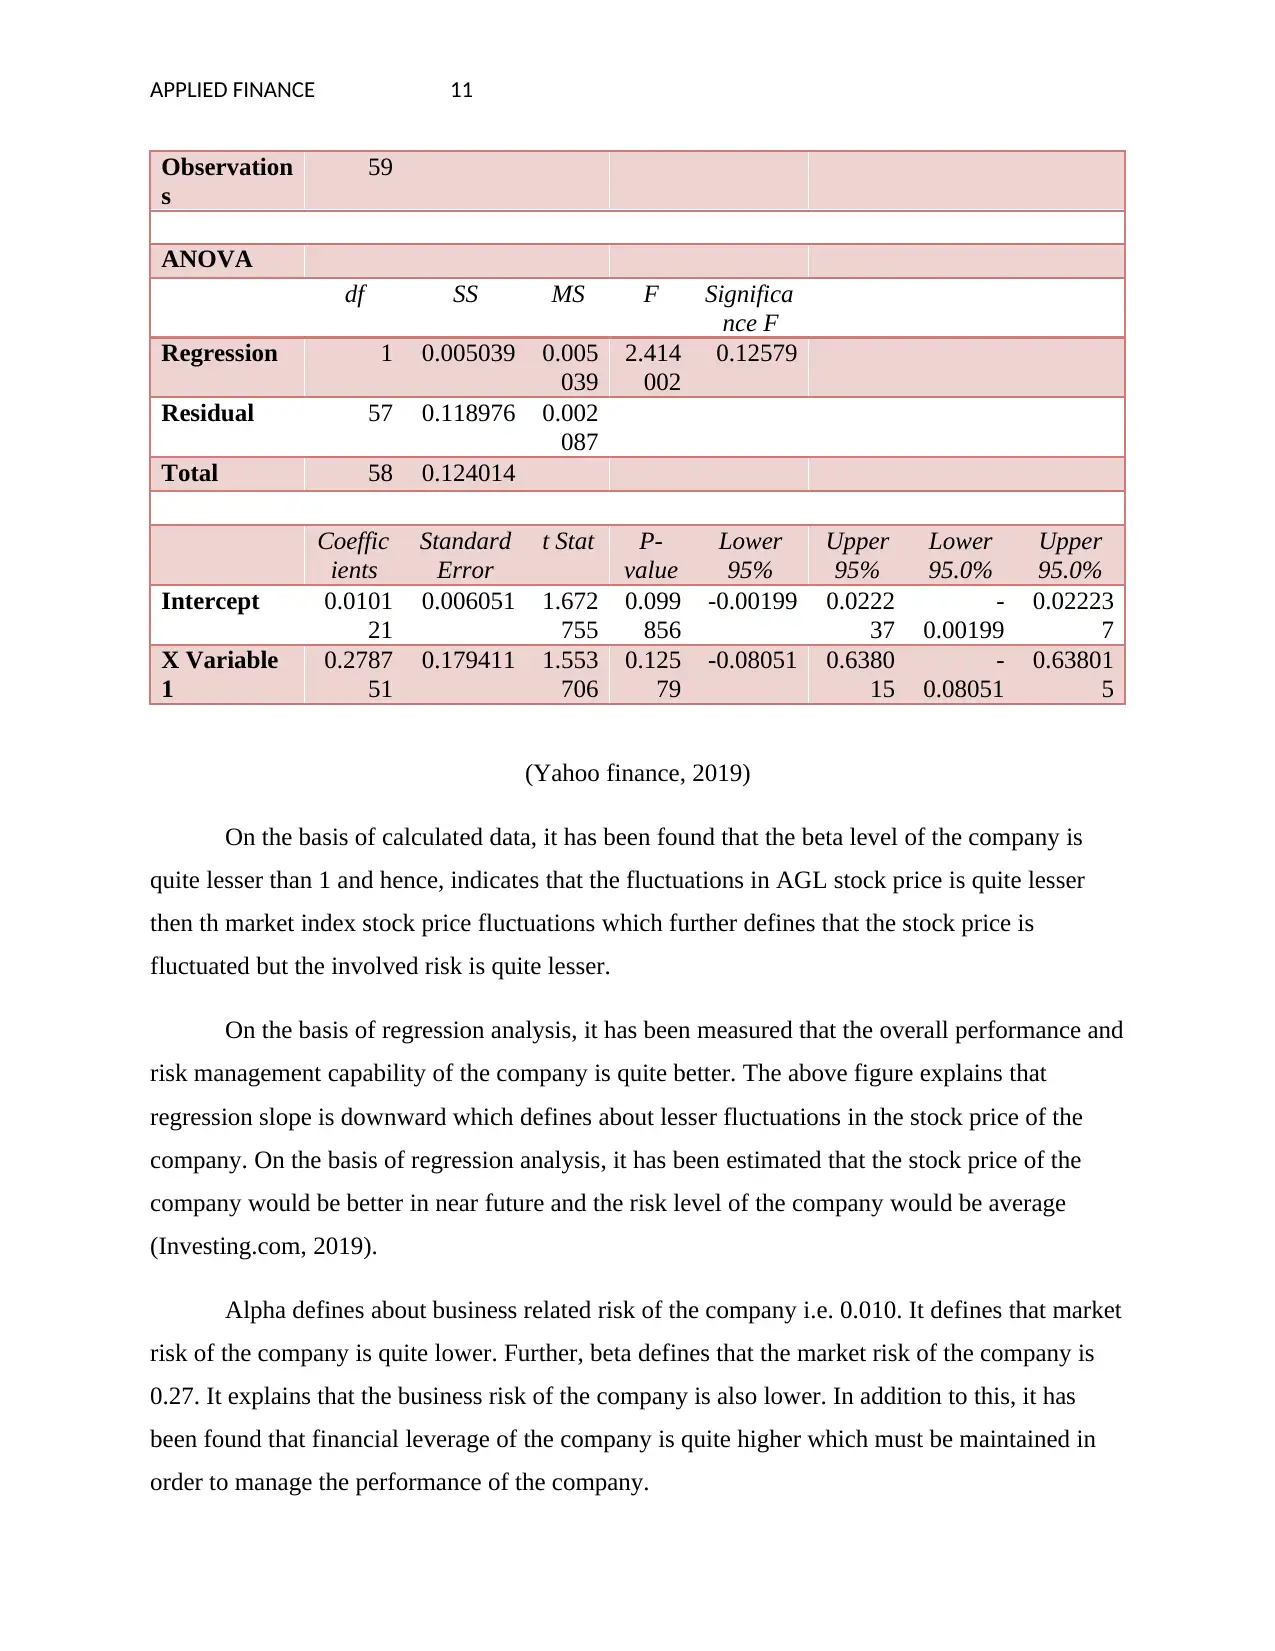
(Yahoo finance, 2019)
On the basis of calculated data, it has been found that the beta level of the company is
quite lesser than 1 and hence, indicates that the fluctuations in AGL stock price is quite lesser
then th market index stock price fluctuations which further defines that the stock price is
fluctuated but the involved risk is quite lesser.
On the basis of regression analysis, it has been measured that the overall performance and
risk management capability of the company is quite better. The above figure explains that
regression slope is downward which defines about lesser fluctuations in the stock price of the
company. On the basis of regression analysis, it has been estimated that the stock price of the
company would be better in near future and the risk level of the company would be average
(Investing.com, 2019).
Alpha defines about business related risk of the company i.e. 0.010. It defines that market
risk of the company is quite lower. Further, beta defines that the market risk of the company is
0.27. It explains that the business risk of the company is also lower. In addition to this, it has
been found that financial leverage of the company is quite higher which must be maintained in
order to manage the performance of the company.
Observation
s
59
ANOVA
df SS MS F Significa
nce F
Regression 1 0.005039 0.005
039
2.414
002
0.12579
Residual 57 0.118976 0.002
087
Total 58 0.124014
Coeffic
ients
Standard
Error
t Stat P-
value
Lower
95%
Upper
95%
Lower
95.0%
Upper
95.0%
Intercept 0.0101
21
0.006051 1.672
755
0.099
856
-0.00199 0.0222
37
-
0.00199
0.02223
7
X Variable
1
0.2787
51
0.179411 1.553
706
0.125
79
-0.08051 0.6380
15
-
0.08051
0.63801
5
(Yahoo finance, 2019)
On the basis of calculated data, it has been found that the beta level of the company is
quite lesser than 1 and hence, indicates that the fluctuations in AGL stock price is quite lesser
then th market index stock price fluctuations which further defines that the stock price is
fluctuated but the involved risk is quite lesser.
On the basis of regression analysis, it has been measured that the overall performance and
risk management capability of the company is quite better. The above figure explains that
regression slope is downward which defines about lesser fluctuations in the stock price of the
company. On the basis of regression analysis, it has been estimated that the stock price of the
company would be better in near future and the risk level of the company would be average
(Investing.com, 2019).
Alpha defines about business related risk of the company i.e. 0.010. It defines that market
risk of the company is quite lower. Further, beta defines that the market risk of the company is
0.27. It explains that the business risk of the company is also lower. In addition to this, it has
been found that financial leverage of the company is quite higher which must be maintained in
order to manage the performance of the company.
⊘ This is a preview!⊘
Do you want full access?
Subscribe today to unlock all pages.
Trusted by 1+ million students worldwide
1 out of 32
Related Documents


Your All-in-One AI-Powered Toolkit for Academic Success.
+13062052269
info@desklib.com
Available 24*7 on WhatsApp / Email
![[object Object]](/_next/static/media/star-bottom.7253800d.svg)
Unlock your academic potential
Copyright © 2020–2026 A2Z Services. All Rights Reserved. Developed and managed by ZUCOL.