Comprehensive Financial Analysis Report: AGL Energy Ltd (2017-2018)
VerifiedAdded on 2022/10/03
|6
|1244
|77
Report
AI Summary
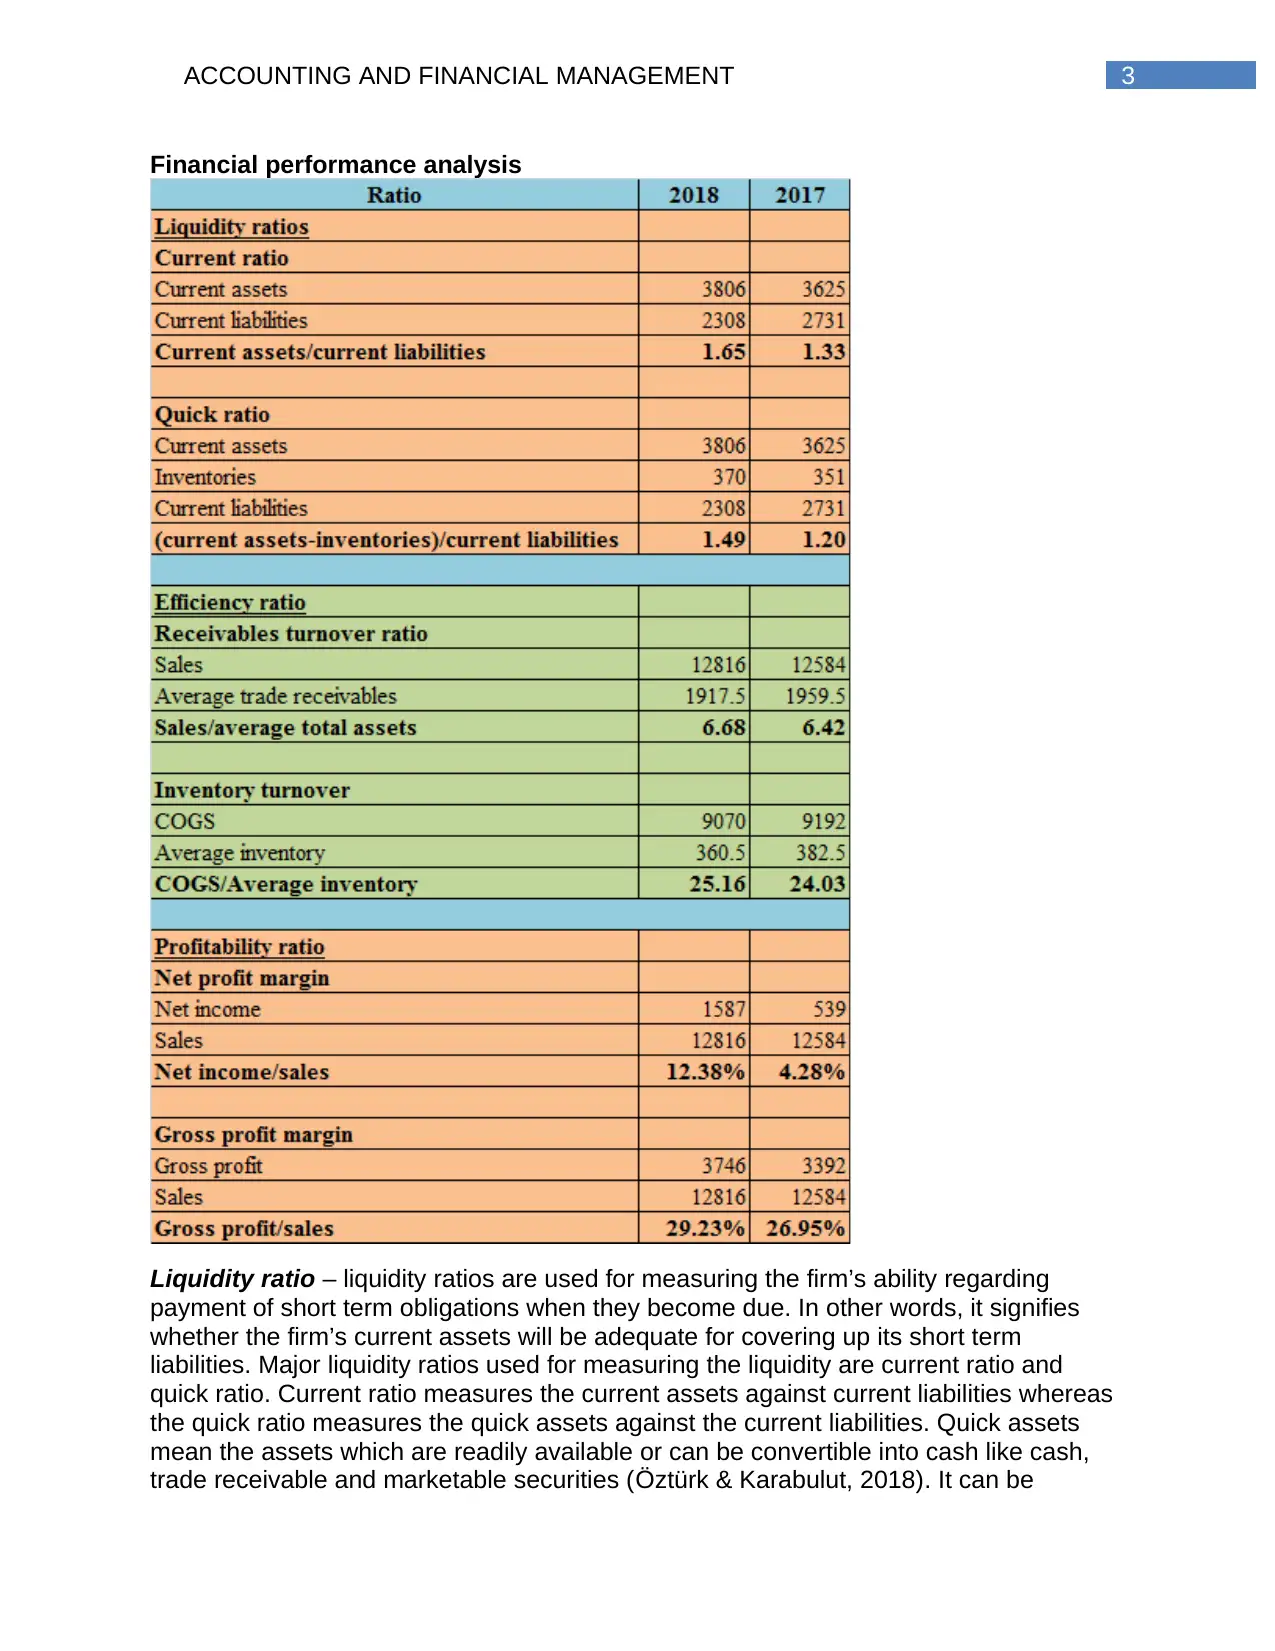
This report provides a comprehensive financial analysis of AGL Energy Ltd. The analysis begins with an introduction to AGL Energy, followed by an examination of key items in the financial statements, including borrowings, cash and cash equivalents, and property, plant, and equipment. The report then delves into the measurement of key assets, specifically focusing on the historical cost convention used by AGL Energy. A significant portion of the report is dedicated to financial performance analysis, utilizing liquidity, efficiency, and profitability ratios to assess the company's financial health. The analysis reveals improvements in liquidity, efficiency, and profitability from 2017 to 2018. The report concludes by summarizing the key findings and highlighting the company's improved financial position. References to the annual reports and relevant research papers are included to support the analysis.

Running head: ACCOUNTING AND FINANCIAL MANAGEMENT
Accounting and financial management
Name of the student
Name of the university
Student ID
Author note
Accounting and financial management
Name of the student
Name of the university
Student ID
Author note
Paraphrase This Document
Need a fresh take? Get an instant paraphrase of this document with our AI Paraphraser

1ACCOUNTING AND FINANCIAL MANAGEMENT
Table of Contents
Introduction........................................................................................................................2
Key items in the financial statements................................................................................2
Measurement of key assets...............................................................................................2
Financial performance analysis.........................................................................................2
Conclusion.........................................................................................................................3
Reference..........................................................................................................................4

2ACCOUNTING AND FINANCIAL MANAGEMENT
Introduction
AGL Energy Ltd is the integrated leading energy business and operates for more
than 180 years with proud heritage for innovation. It is engaged in selling and buying of
electricity and gas and associated products as well as services, operation and
construction of the power generation. The company operates largest private portfolio for
electricity generation in Australia with total capacity of 10,143 MW that accounts for
almost 20% of total generation capacity in Australian national electricity market. Further,
the company is active participant in electricity and gas wholesale market with the
customer accounts of 3.7 million those include large and small business group,
wholesale customers and residential customers (Agl.com.au, 2019).
Key items in the financial statements
Some of the key items including assets, liabilities, incomes and expenses those
have significant impact on the reported position of the firm, its performance and decision
making process are as follows –
Borrowings – it is identified that the long term borrowing of the company has
been reduced from $3173 million in 2017 to $2822 million in 2018. It is signifying
financial strength of the company as it is competent to pay off the debt on time
and was not required new debt for its operation (Agl.com.au, 2019).
Cash and cash equivalents – cash plays significant role in company’s business
and is required to pay off the short term obligations. Increase in amount of cash
from $154 million to $463 million over the period of 2017 to 2018 is signifying that
the company’s is strong in terms of its liquidity.
Property, plant and equipment – PPE is crucial for the business operations as it
provides required resources for producing the products. Increase in the amount
of PPE from $6447 million to $6685 over the years from 2017 to 2018 is
signifying that the company has required resources for its operation (Agl.com.au,
2019).
Measurement of key assets
Accounting conventions are basic accounting rules that become acceptable
procedures over the time and are considered as the basis accounting rules. Most
commonly used convention is historical cost convention. It requires that the transactions
shall be recorded at the cost at which the item is acquired. Hence, under this approach
no account for changing prices is taken into consideration. AGL Energy Ltd follows the
historical cost convention approach for valuing reporting its asset that is the PPE are
measured at cost reduced by accumulated depreciation and accumulated impairment
losses (Annualreport.agl.com.au, 2019).
⊘ This is a preview!⊘
Do you want full access?
Subscribe today to unlock all pages.

Trusted by 1+ million students worldwide

3ACCOUNTING AND FINANCIAL MANAGEMENT
Financial performance analysis
Liquidity ratio – liquidity ratios are used for measuring the firm’s ability regarding
payment of short term obligations when they become due. In other words, it signifies
whether the firm’s current assets will be adequate for covering up its short term
liabilities. Major liquidity ratios used for measuring the liquidity are current ratio and
quick ratio. Current ratio measures the current assets against current liabilities whereas
the quick ratio measures the quick assets against the current liabilities. Quick assets
mean the assets which are readily available or can be convertible into cash like cash,
trade receivable and marketable securities (Öztürk & Karabulut, 2018). It can be
Paraphrase This Document
Need a fresh take? Get an instant paraphrase of this document with our AI Paraphraser

4ACCOUNTING AND FINANCIAL MANAGEMENT
identified that that both current ratio as well as quick ratio of the company in 2018 has
been increased as compared to previous year. Hence, the company has improved its
liquidity position. In quantitative terms, current ratio has been gone up from 1.33 to 1.65
and quick ratio has been increased from 1.20 to 1.49.
Efficiency ratio – efficiency ratios are utilised to measure the efficiency of the firm in
terms of converting its balance sheet items like trade receivables and inventories into
cash. Major liquidity ratios used for measuring the firm’s efficiency are receivable
turnover ratio and inventory turnover ratio. Receivable turnover ratio measures the time
taken by the company in collecting the dues from its debtors whereas inventory turnover
ratio measures time the firm takes in replacing or selling its entire stock of inventories
on an average. Both the ratios of the company in 2018 have been enhanced as
compared to the previous year (Olesen, Petersen & Podinovski, 2015). Hence, the
company has improved its efficiencies. In quantitative terms, receivable turnover has
been increased from 6.42 times to 6.68 times and inventory turnover has been
increased from 24.03 times to 25.16 times.
Profitability ratios – profitability ratios measure the company’s ability in terms of
generating earning from its revenues after meeting all the business expenses. Major
profitability ratios used for measuring the profitability of the firm are net profit margin and
gross profit margin. Net profit margin is the earning generated by the firma after paying
all the expenses whereas gross profit margin is the profit generated by the firm after
paying cost of sales (Sari, Nurlaela & Titisari, 2018). Both net profit margin as well as
gross profit margin has been increased in 2918 as against 2017. In quantitative terms,
net profit margin has been increased from 4.23% to 12.38% and gross profit margin has
been increased from 26.95% to 29.23%.
Conclusion
From above discussion it is concluded that in financial terms the company has
improved in all aspects like liquidity, profitability and efficiency. Various items that have
notable impact on its financial statements include ling-term borrowing, cash and cash
equivalents and plant, property and equipments. As per the accounting convention, the
major key asset of the company that is for instance PPE is reported in accordance with
historical cost convention that is the asset is recorded at the cost at which the item is
acquired less accumulated depreciation and impairment.

5ACCOUNTING AND FINANCIAL MANAGEMENT
Reference
Agl.com.au. (2019). AGL Energy | An Electricity Provider & Gas Supplier | AGL.
Retrieved 15 August 2019, from https://www.agl.com.au/
Annualreport.agl.com.au. (2019). 2018 Retrieved 15 August 2019, from
https://www.2018annualreport.agl.com.au/xmlpages/resources/TXP/agl_energy/
finrep/pdf/AGL_Energy_Annual_Report_2018.pdf
Olesen, O. B., Petersen, N. C., & Podinovski, V. V. (2015). Efficiency analysis with ratio
measures. European Journal of Operational Research, 245(2), 446-462.
Öztürk, H., & Karabulut, T. A. (2018). The Relationship between Earnings-to-Price,
Current Ratio, Profit Margin and Return: An Empirical Analysis on Istanbul Stock
Exchange. Accounting and Finance Research, 7(1), 109-115.
Sari, R. K., Nurlaela, S., & Titisari, K. H. (2018). The Effect of Liquidity Ratio, Profitability
Ratio, Company Size, and Leverage on Bond Rating in Construction and Real
Estate Company.
⊘ This is a preview!⊘
Do you want full access?
Subscribe today to unlock all pages.

Trusted by 1+ million students worldwide
1 out of 6
Related Documents

Your All-in-One AI-Powered Toolkit for Academic Success.
+13062052269
info@desklib.com
Available 24*7 on WhatsApp / Email
Unlock your academic potential
Copyright © 2020–2025 A2Z Services. All Rights Reserved. Developed and managed by ZUCOL.