Finance Report: Agthia Group Stock Analysis and ADI General Index

Verified

Added on  2023/05/27

|8
|792
|159
Report
AI Summary
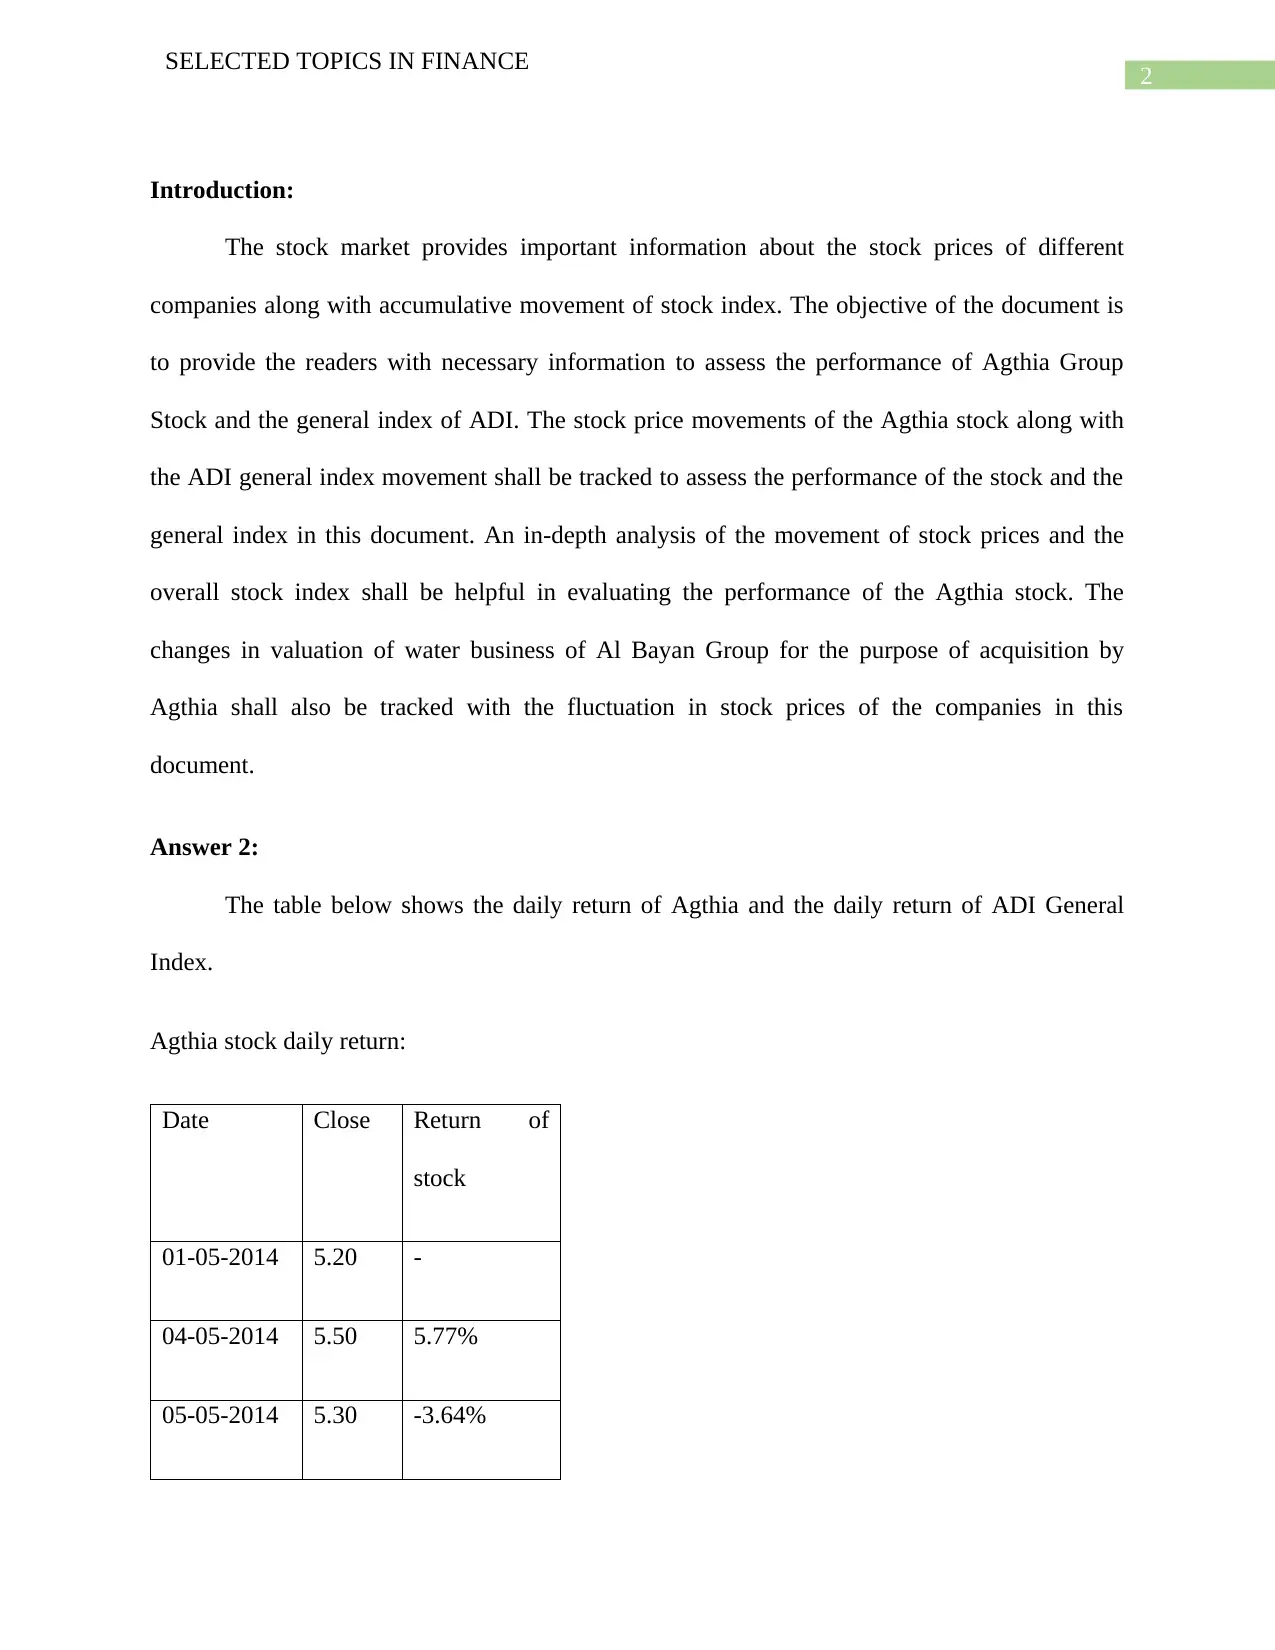
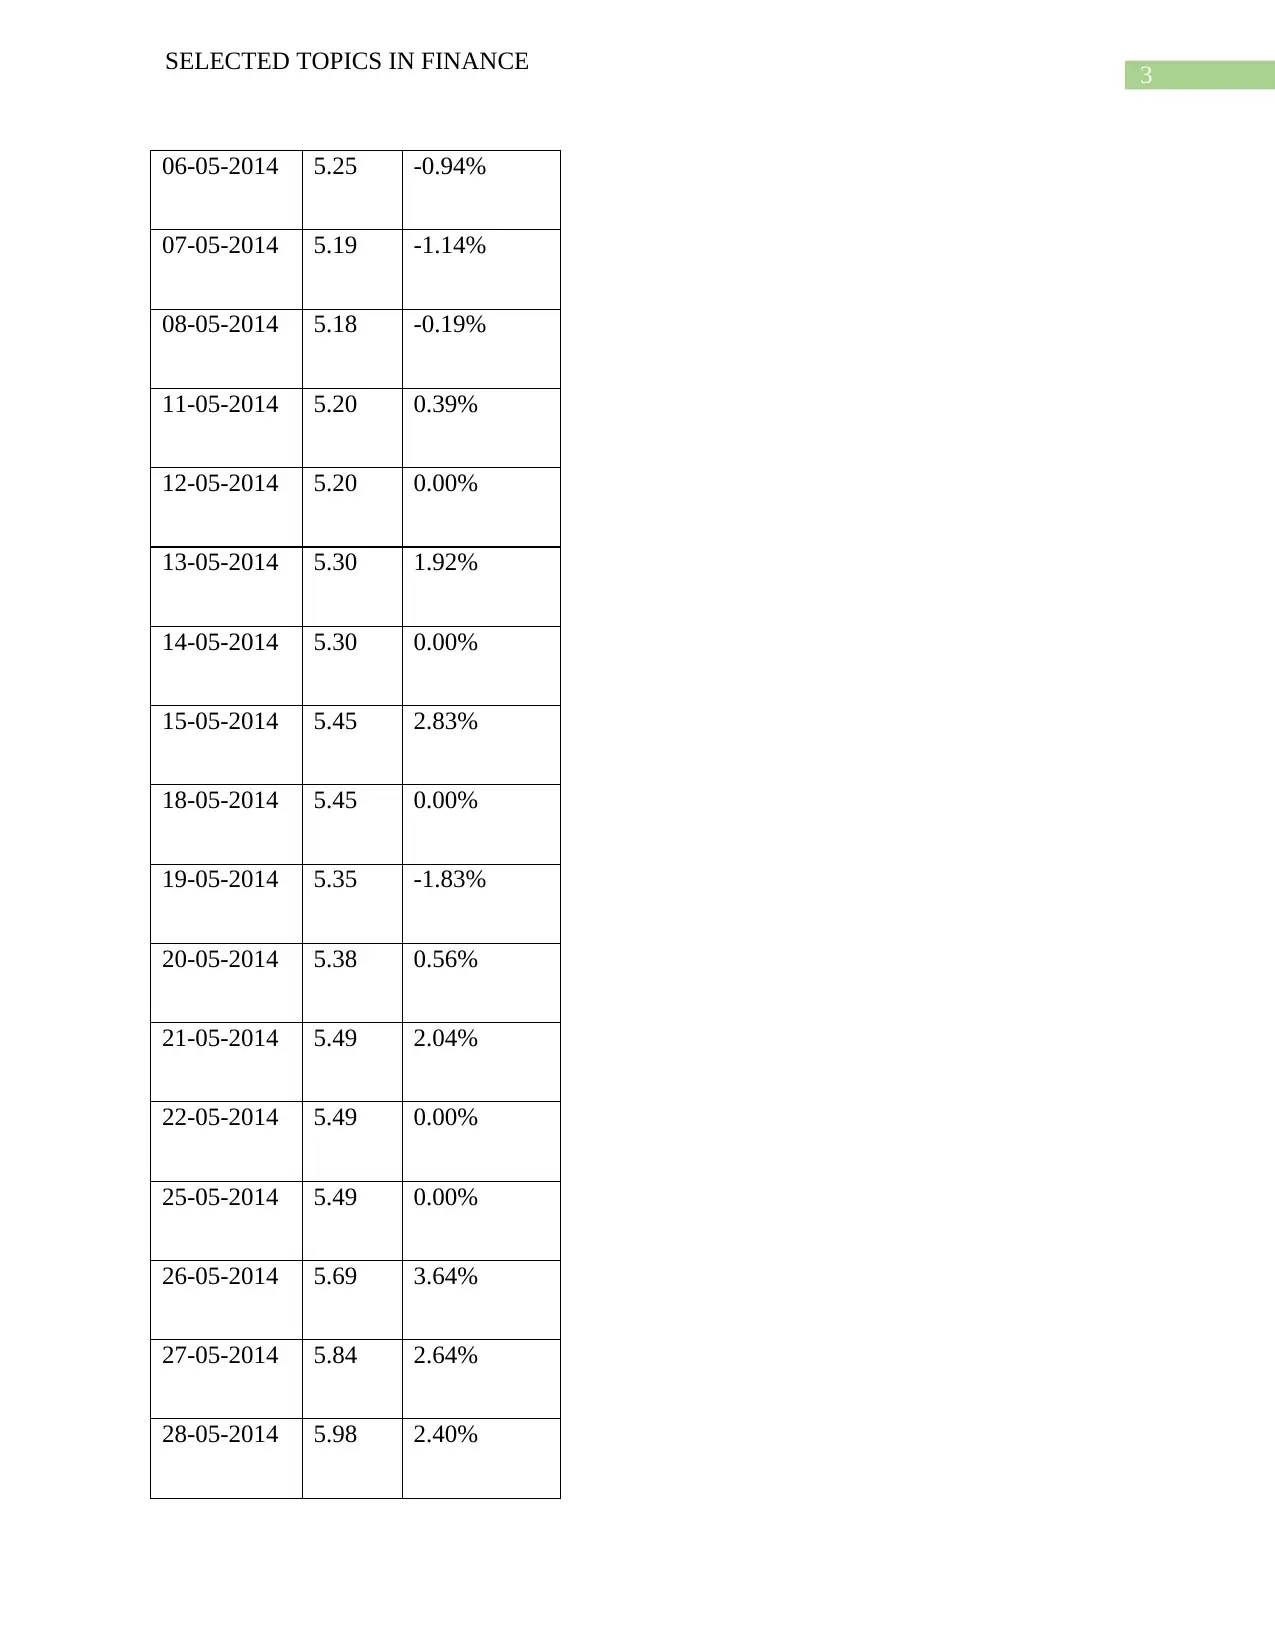
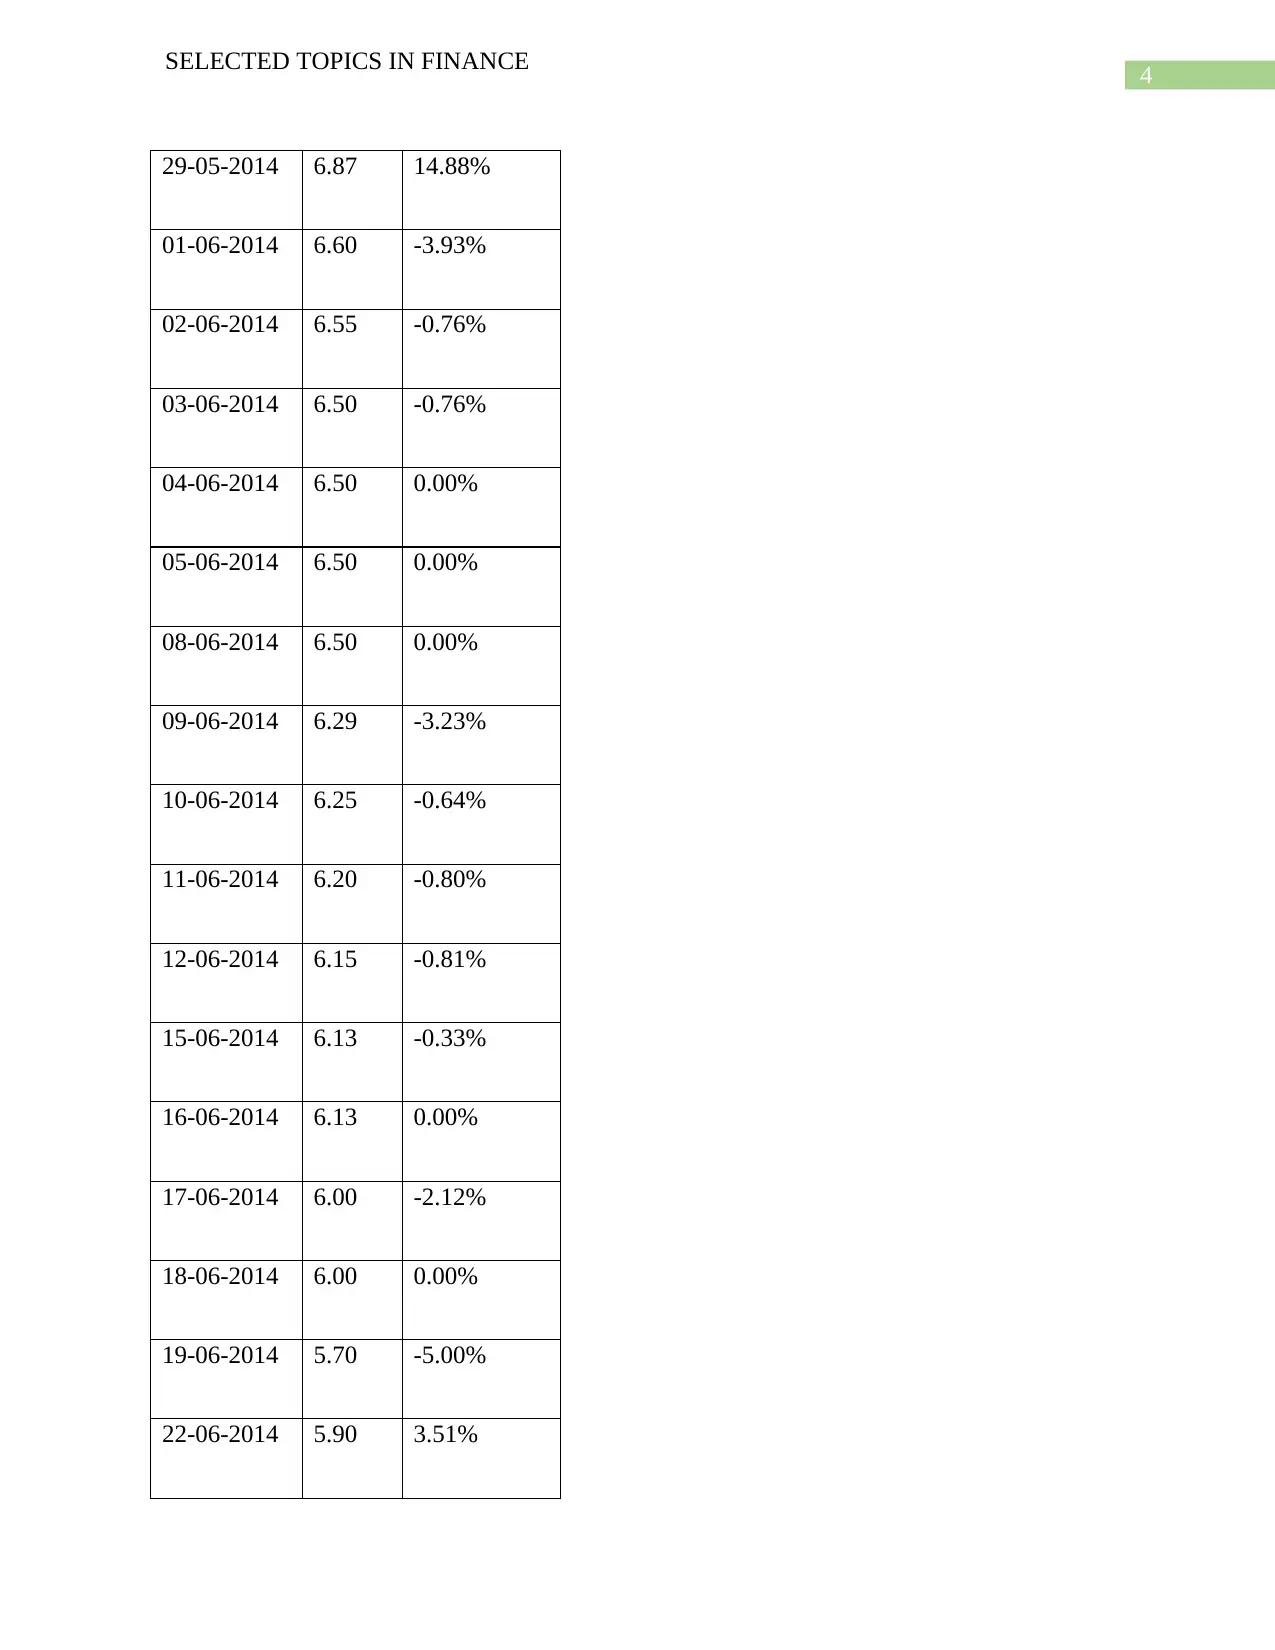
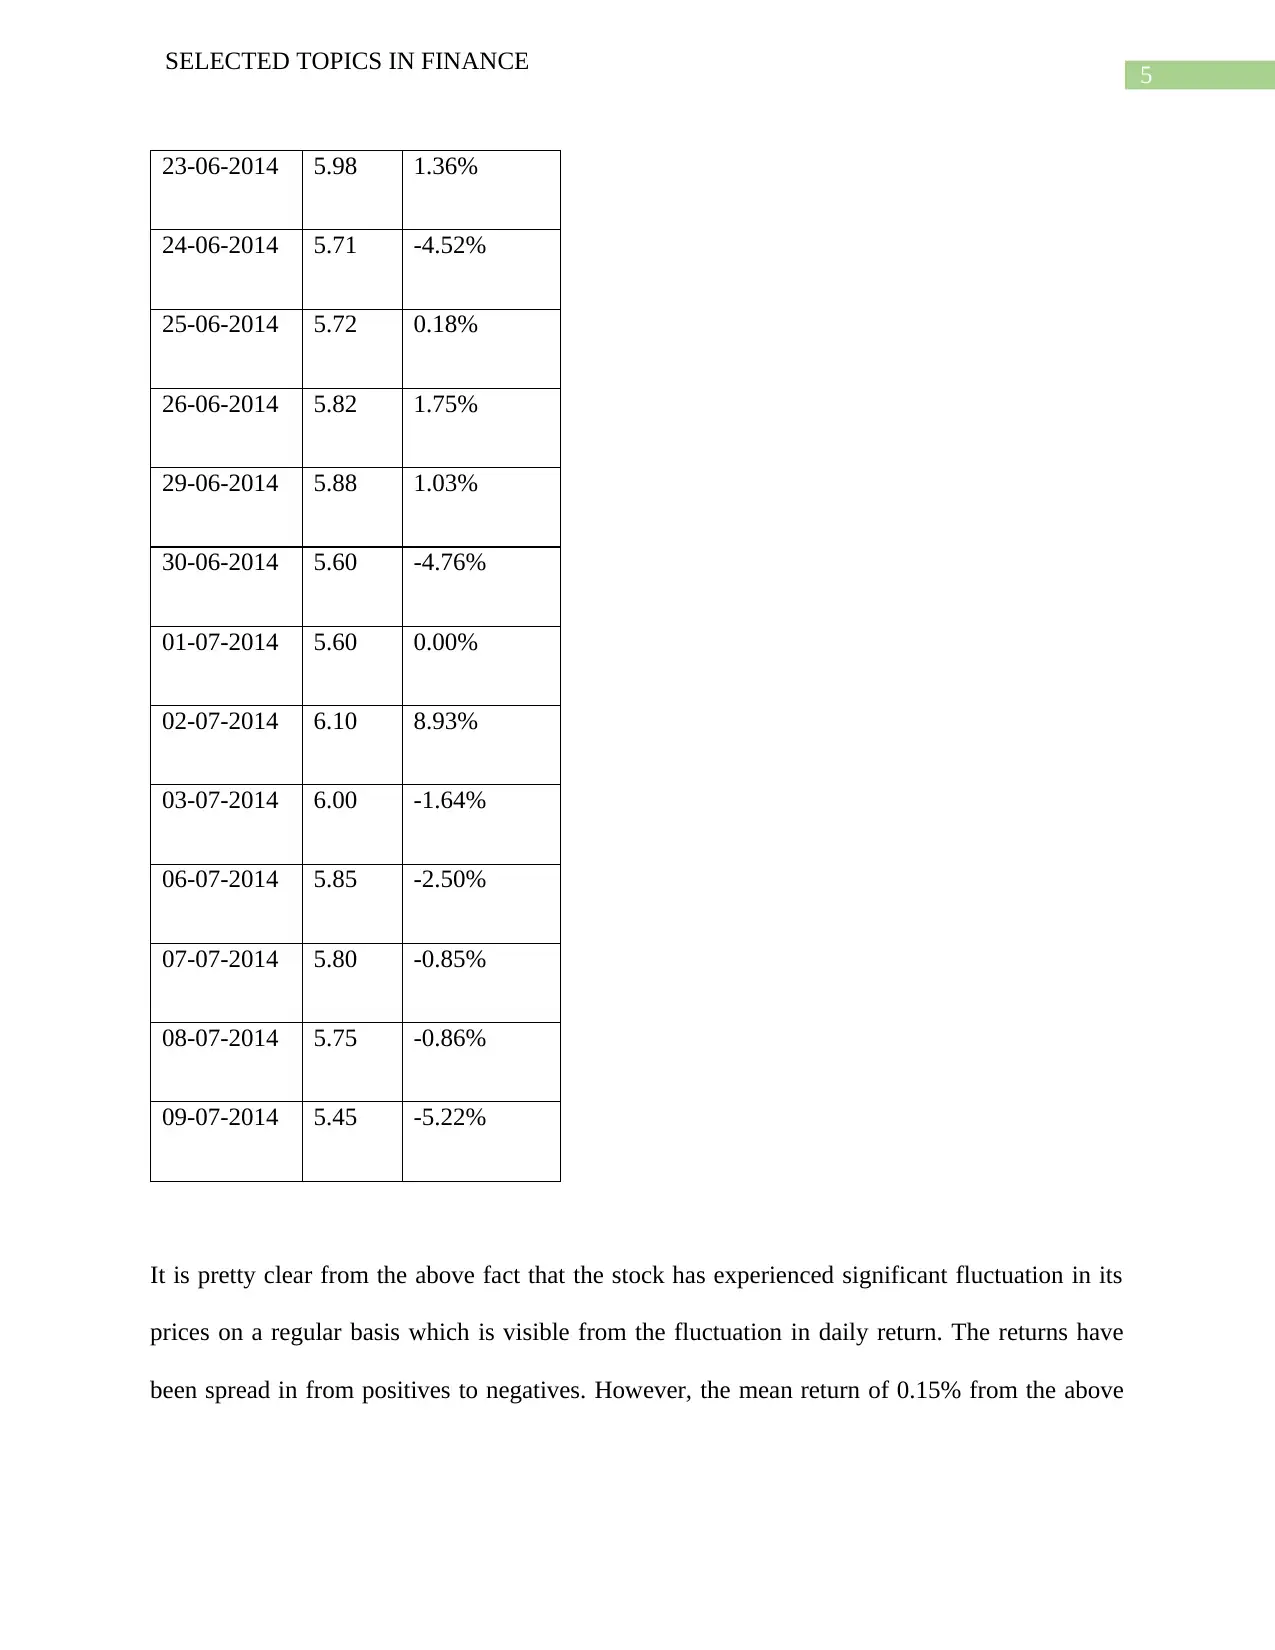
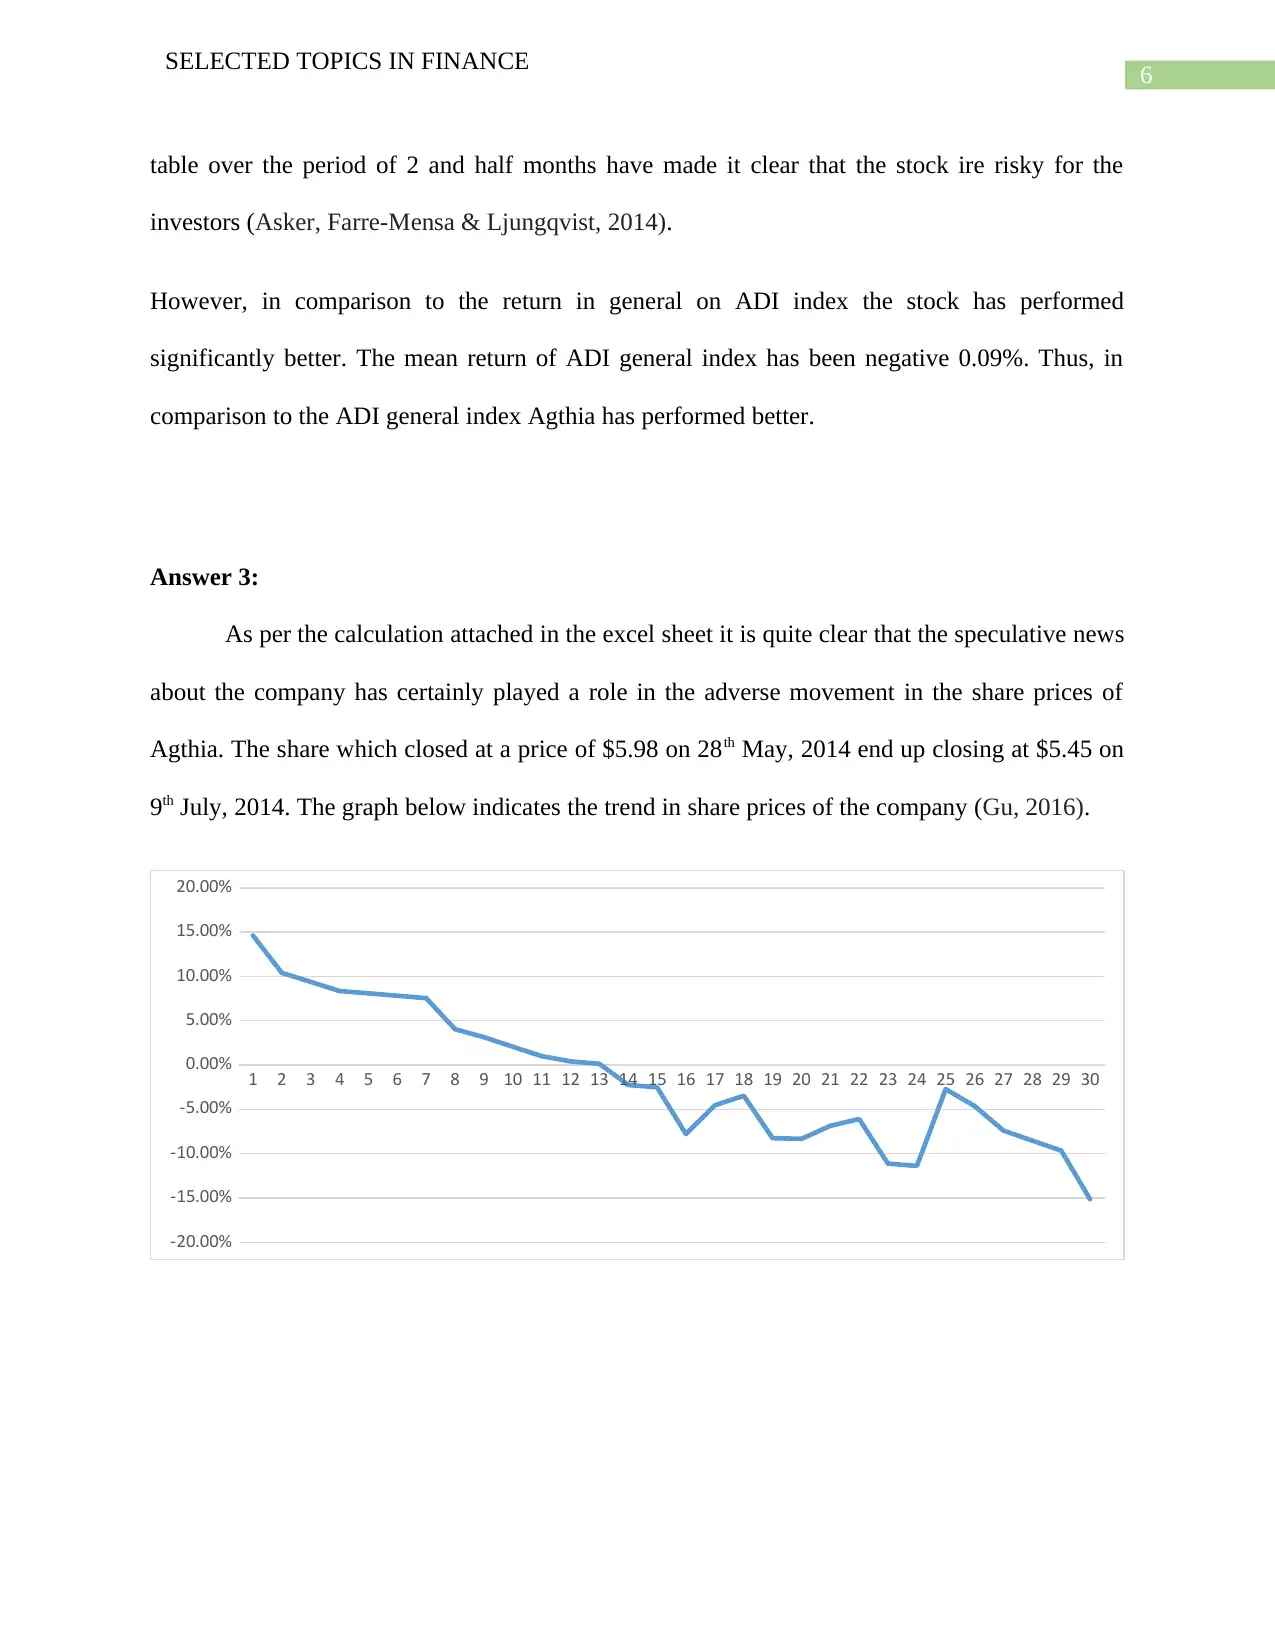
This report analyzes the stock performance of Agthia Group P.J.S.C. and the ADI General Index between May 1st, 2014, and June 30th, 2014. It computes the daily returns of Agthia Group stock and the ADI General Index. The report assesses the 30-day valuation effect of news released on May 28th, 2014, using Cumulative Abnormal Returns (CAR) and Buy-and-Hold Abnormal Returns (BHAR) metrics with the constant mean return model based on one year of historical returns. The analysis considers the impact of speculative news and rumors preceding the announcement on the stock prices of Agthia, evaluating the stock's fluctuations and comparing its performance against the ADI General Index.
Document Page
Running head: SELECTED TOPICS IN FINANCE
Selected Topics in Finance
Name of the Student:
Name of the University:
Authors Note:
tabler-icon-diamond-filled.svg

Secure Best Marks with AI Grader

Need help grading? Try our AI Grader for instant feedback on your assignments.
Document Page
1
SELECTED TOPICS IN FINANCE
Contents
Introduction:....................................................................................................................................2
Answer 2:.........................................................................................................................................2
Answer 3:.........................................................................................................................................6
References:......................................................................................................................................7
Document Page
2
SELECTED TOPICS IN FINANCE
Introduction:
The stock market provides important information about the stock prices of different
companies along with accumulative movement of stock index. The objective of the document is
to provide the readers with necessary information to assess the performance of Agthia Group
Stock and the general index of ADI. The stock price movements of the Agthia stock along with
the ADI general index movement shall be tracked to assess the performance of the stock and the
general index in this document. An in-depth analysis of the movement of stock prices and the
overall stock index shall be helpful in evaluating the performance of the Agthia stock. The
changes in valuation of water business of Al Bayan Group for the purpose of acquisition by
Agthia shall also be tracked with the fluctuation in stock prices of the companies in this
document.
Answer 2:
The table below shows the daily return of Agthia and the daily return of ADI General
Index.
Agthia stock daily return:
Date Close Return of
stock
01-05-2014 5.20 -
04-05-2014 5.50 5.77%
05-05-2014 5.30 -3.64%
Document Page
3
SELECTED TOPICS IN FINANCE
06-05-2014 5.25 -0.94%
07-05-2014 5.19 -1.14%
08-05-2014 5.18 -0.19%
11-05-2014 5.20 0.39%
12-05-2014 5.20 0.00%
13-05-2014 5.30 1.92%
14-05-2014 5.30 0.00%
15-05-2014 5.45 2.83%
18-05-2014 5.45 0.00%
19-05-2014 5.35 -1.83%
20-05-2014 5.38 0.56%
21-05-2014 5.49 2.04%
22-05-2014 5.49 0.00%
25-05-2014 5.49 0.00%
26-05-2014 5.69 3.64%
27-05-2014 5.84 2.64%
28-05-2014 5.98 2.40%
tabler-icon-diamond-filled.svg

Secure Best Marks with AI Grader

Need help grading? Try our AI Grader for instant feedback on your assignments.
Document Page
4
SELECTED TOPICS IN FINANCE
29-05-2014 6.87 14.88%
01-06-2014 6.60 -3.93%
02-06-2014 6.55 -0.76%
03-06-2014 6.50 -0.76%
04-06-2014 6.50 0.00%
05-06-2014 6.50 0.00%
08-06-2014 6.50 0.00%
09-06-2014 6.29 -3.23%
10-06-2014 6.25 -0.64%
11-06-2014 6.20 -0.80%
12-06-2014 6.15 -0.81%
15-06-2014 6.13 -0.33%
16-06-2014 6.13 0.00%
17-06-2014 6.00 -2.12%
18-06-2014 6.00 0.00%
19-06-2014 5.70 -5.00%
22-06-2014 5.90 3.51%
Document Page
5
SELECTED TOPICS IN FINANCE
23-06-2014 5.98 1.36%
24-06-2014 5.71 -4.52%
25-06-2014 5.72 0.18%
26-06-2014 5.82 1.75%
29-06-2014 5.88 1.03%
30-06-2014 5.60 -4.76%
01-07-2014 5.60 0.00%
02-07-2014 6.10 8.93%
03-07-2014 6.00 -1.64%
06-07-2014 5.85 -2.50%
07-07-2014 5.80 -0.85%
08-07-2014 5.75 -0.86%
09-07-2014 5.45 -5.22%
It is pretty clear from the above fact that the stock has experienced significant fluctuation in its
prices on a regular basis which is visible from the fluctuation in daily return. The returns have
been spread in from positives to negatives. However, the mean return of 0.15% from the above
Document Page
6
SELECTED TOPICS IN FINANCE
table over the period of 2 and half months have made it clear that the stock ire risky for the
investors (Asker, Farre-Mensa & Ljungqvist, 2014).
However, in comparison to the return in general on ADI index the stock has performed
significantly better. The mean return of ADI general index has been negative 0.09%. Thus, in
comparison to the ADI general index Agthia has performed better.
Answer 3:
As per the calculation attached in the excel sheet it is quite clear that the speculative news
about the company has certainly played a role in the adverse movement in the share prices of
Agthia. The share which closed at a price of $5.98 on 28th May, 2014 end up closing at $5.45 on
9th July, 2014. The graph below indicates the trend in share prices of the company (Gu, 2016).
1 2 3 4 5 6 7 8 9 10 11 12 13 14 15 16 17 18 19 20 21 22 23 24 25 26 27 28 29 30
-20.00%
-15.00%
-10.00%
-5.00%
0.00%
5.00%
10.00%
15.00%
20.00%
tabler-icon-diamond-filled.svg

Paraphrase This Document

Need a fresh take? Get an instant paraphrase of this document with our AI Paraphraser
Document Page
7
SELECTED TOPICS IN FINANCE
References:
Asker, J., Farre-Mensa, J., & Ljungqvist, A. (2014). Corporate investment and stock market
listing: A puzzle?. The Review of Financial Studies, 28(2), 342-390.
Gu, L. (2016). Product market competition, R&D investment, and stock returns. Journal of
Financial Economics, 119(2), 441-455.
chevron_up_icon
1 out of 8
circle_padding
hide_on_mobile
zoom_out_icon
logo.png

Your All-in-One AI-Powered Toolkit for Academic Success.

Available 24*7 on WhatsApp / Email

[object Object]