Cloud Computing: Confusion Matrix Report for AI Classification Models

Verified

Added on  2023/04/08

|2
|302
|301
Report
AI Summary
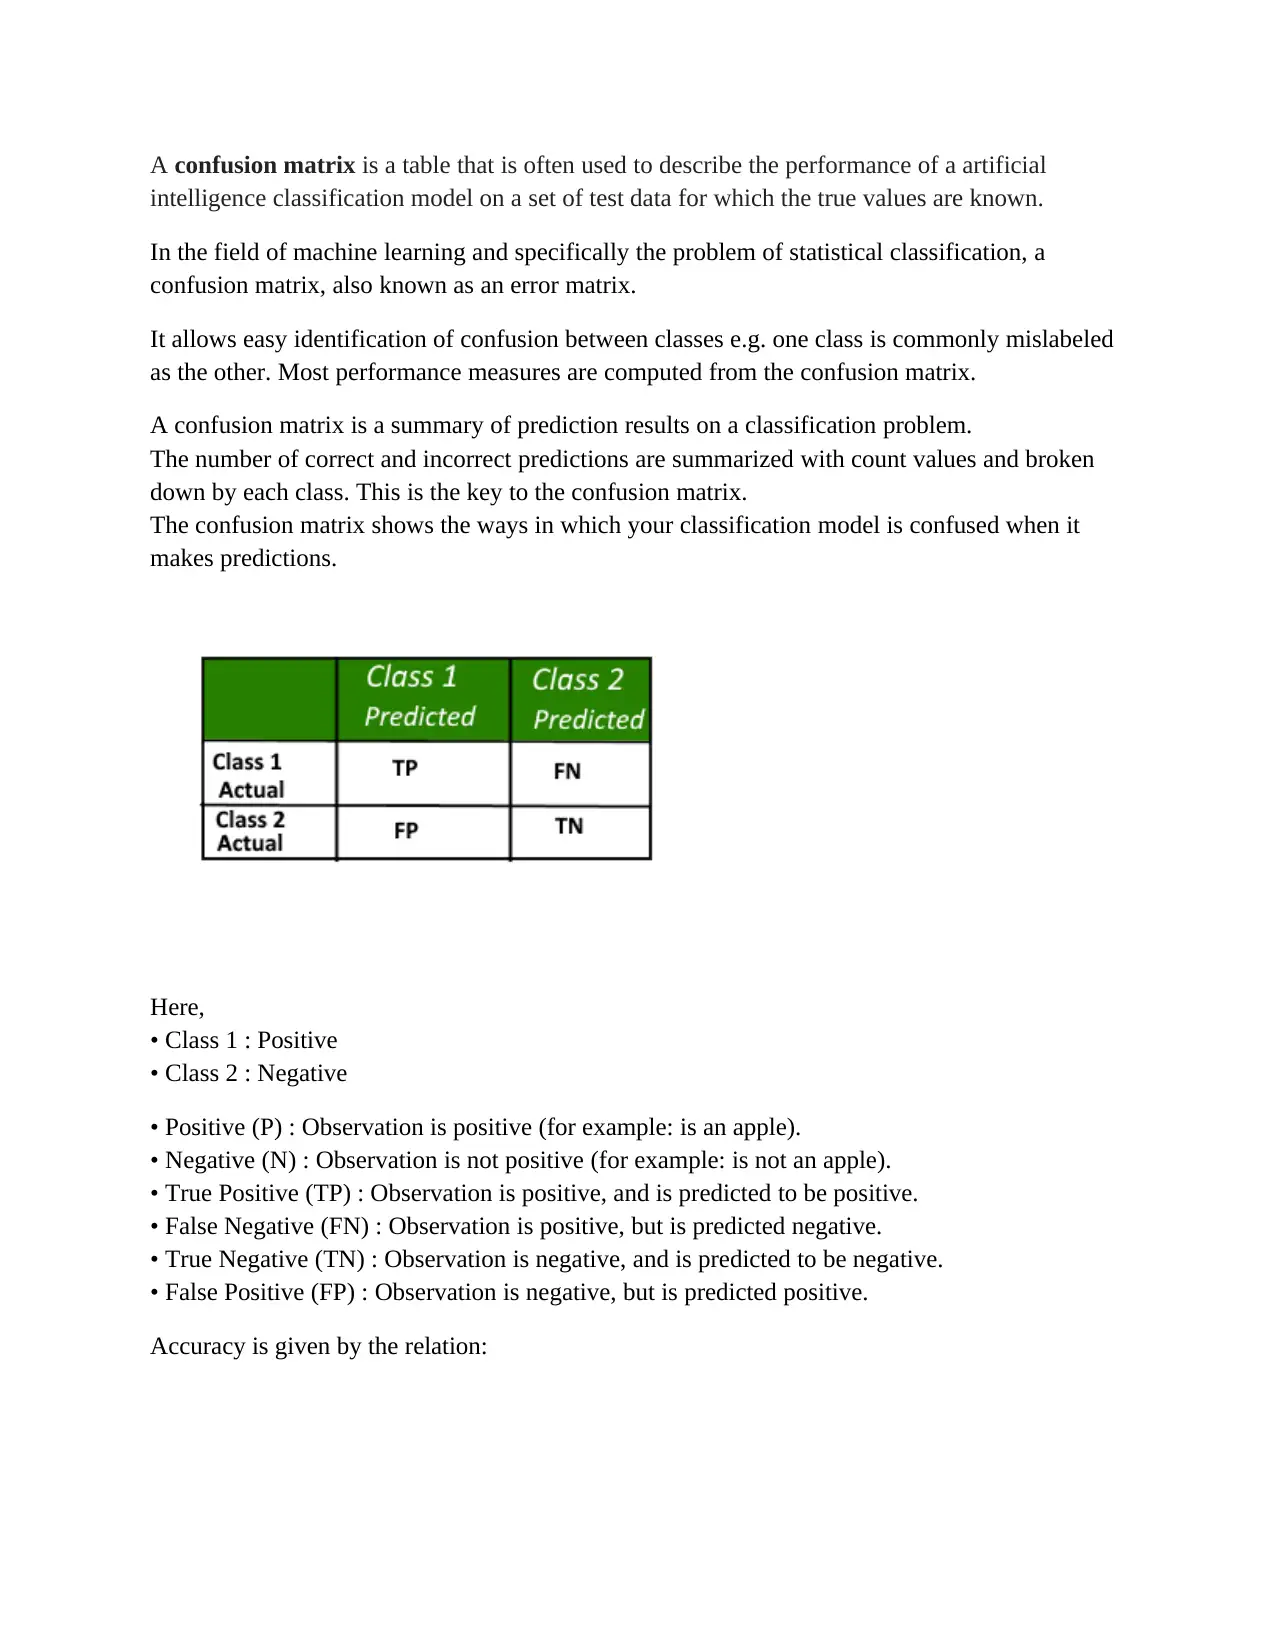
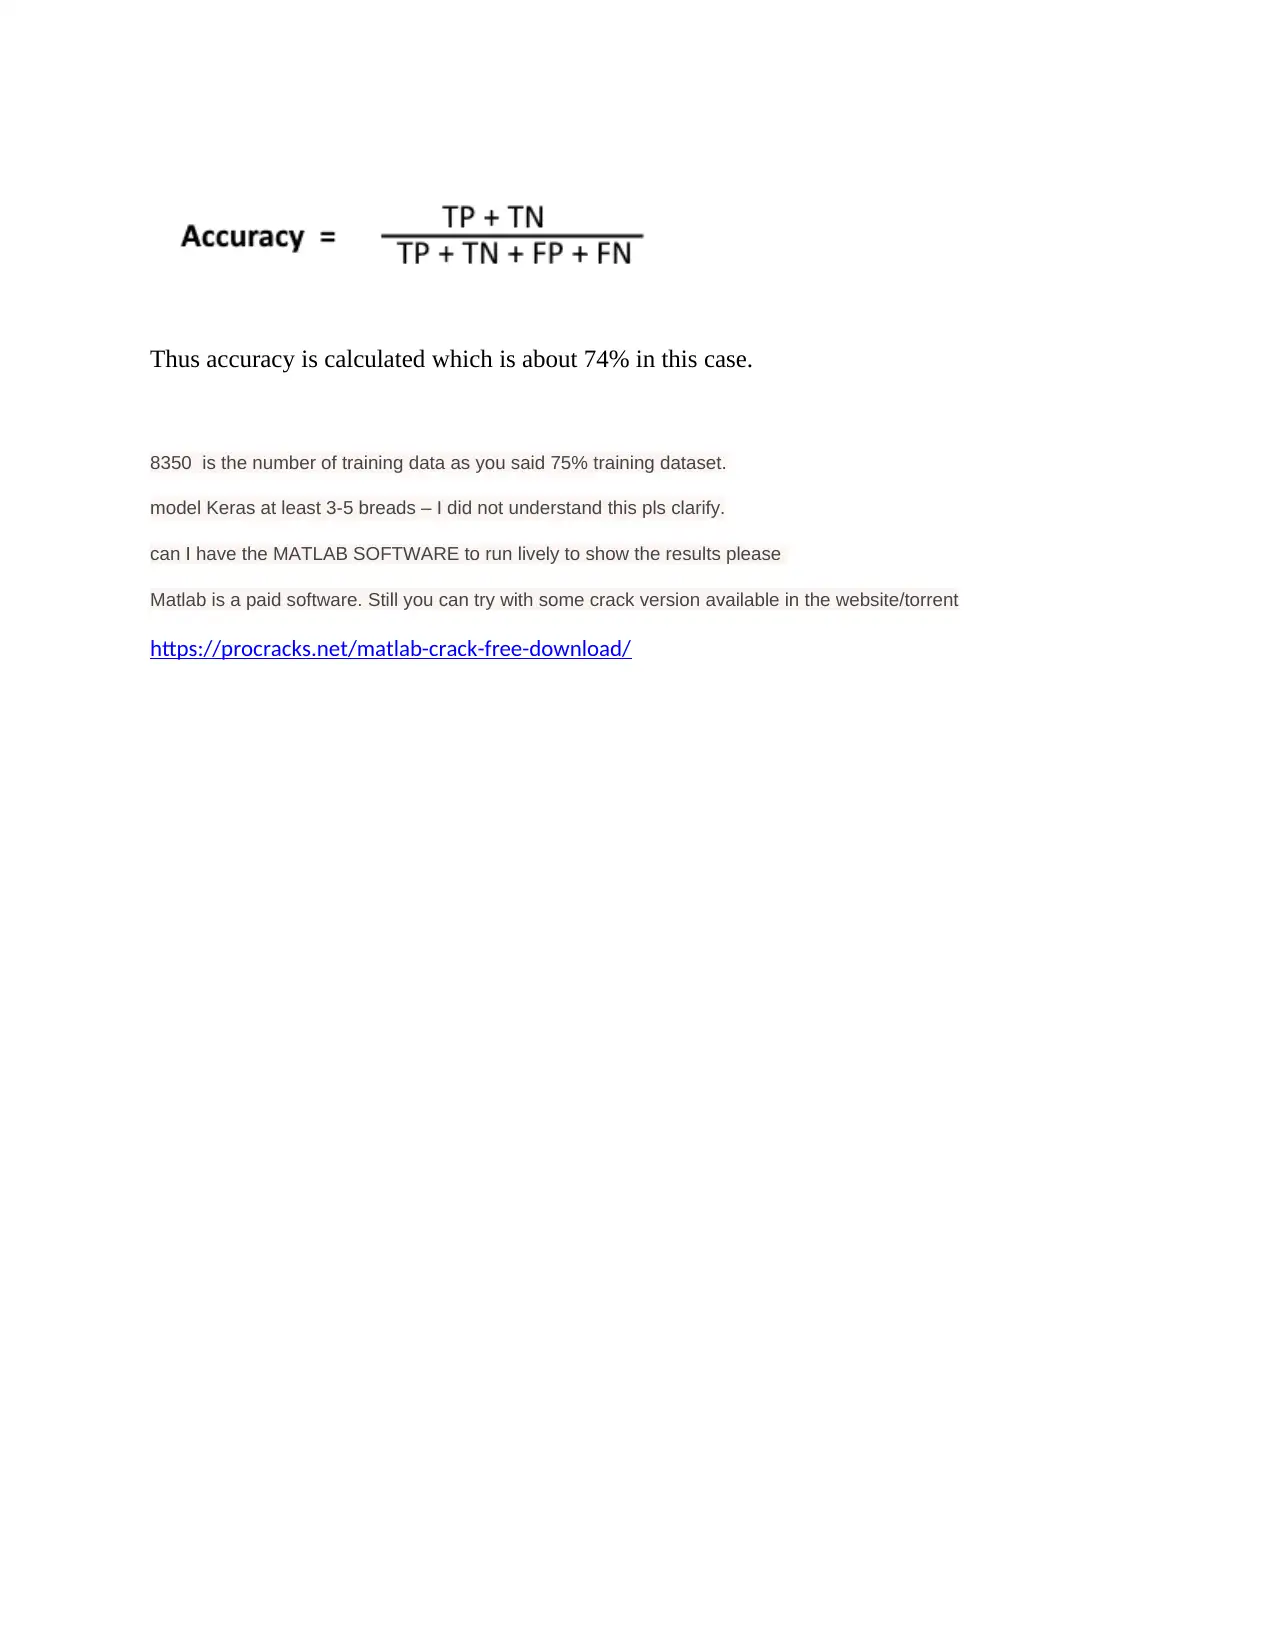
This report delves into the concept of the confusion matrix, a crucial tool for evaluating the performance of AI classification models. It explains the components of the matrix, including true positives, false negatives, and true negatives, and how these elements contribute to calculating accuracy. The report references a 74% accuracy rate based on a 75% training dataset of 8350 data points. Additionally, the report mentions the use of Keras and MATLAB, although the latter is a paid software. The report explores the application of the confusion matrix within the context of cloud computing and machine learning, offering a comprehensive understanding of its significance in assessing and improving the performance of AI classification models.
Document Page
A confusion matrix is a table that is often used to describe the performance of a artificial
intelligence classification model on a set of test data for which the true values are known.
In the field of machine learning and specifically the problem of statistical classification, a
confusion matrix, also known as an error matrix.
It allows easy identification of confusion between classes e.g. one class is commonly mislabeled
as the other. Most performance measures are computed from the confusion matrix.
A confusion matrix is a summary of prediction results on a classification problem.
The number of correct and incorrect predictions are summarized with count values and broken
down by each class. This is the key to the confusion matrix.
The confusion matrix shows the ways in which your classification model is confused when it
makes predictions.
Here,
• Class 1 : Positive
• Class 2 : Negative
• Positive (P) : Observation is positive (for example: is an apple).
• Negative (N) : Observation is not positive (for example: is not an apple).
• True Positive (TP) : Observation is positive, and is predicted to be positive.
• False Negative (FN) : Observation is positive, but is predicted negative.
• True Negative (TN) : Observation is negative, and is predicted to be negative.
• False Positive (FP) : Observation is negative, but is predicted positive.
Accuracy is given by the relation:
tabler-icon-diamond-filled.svg

Paraphrase This Document

Need a fresh take? Get an instant paraphrase of this document with our AI Paraphraser
Document Page
Thus accuracy is calculated which is about 74% in this case.
8350 is the number of training data as you said 75% training dataset.
model Keras at least 3-5 breads – I did not understand this pls clarify.
can I have the MATLAB SOFTWARE to run lively to show the results please
Matlab is a paid software. Still you can try with some crack version available in the website/torrent
https://procracks.net/matlab-crack-free-download/
chevron_up_icon
1 out of 2
circle_padding
hide_on_mobile
zoom_out_icon
[object Object]