NIT6130 - AI in Healthcare: Experiment Design and Result Analysis
VerifiedAdded on 2023/06/10
|25
|3901
|139
Report
AI Summary
This report investigates the impact of artificial intelligence (AI) on the healthcare sector through experiment design and result analysis. The research involves collecting data from major hospitals, clinics, and other healthcare centers to understand the application and effects of AI on their performance. The methodology includes data collection, storage, pre-processing (cleaning, integration, transformation, reduction, and discretization), feature selection, and dimension reduction. A hybrid research methodology, utilizing interviews and questionnaires, was employed to gather both numerical and non-numerical data. The collected data was analyzed using Ms. Word and Ms. Excel to tabulate results, create charts, and enhance visualization. The findings reveal the extent to which healthcare organizations are adopting and supporting AI in their operations, highlighting both the benefits and challenges associated with its implementation. The report concludes with a summary of the research and result analysis, providing insights into the evolving role of AI in healthcare.
1
Introduction to research
Student’s Name
Course
Professor’s Name
Institution’s Name
Institution’s Location
Date
Introduction to research
Student’s Name
Course
Professor’s Name
Institution’s Name
Institution’s Location
Date
Paraphrase This Document
Need a fresh take? Get an instant paraphrase of this document with our AI Paraphraser
2
Table of Contents
List of Figures........................................................................................................................3
List of Tables..........................................................................................................................4
1 Data collection and storage.................................................................................................5
1.1 Data sources.................................................................................................................5
1.2 Data collection.............................................................................................................5
1.3 Data storage..................................................................................................................6
2 Design and implementation.................................................................................................7
2.1 Data pre-processing......................................................................................................7
2.2 Feature selection or dimension reduction....................................................................9
2.3 Experiment designing.................................................................................................10
2.3.1 Detailed design steps...........................................................................................10
2.3.2 The results obtained............................................................................................11
2.4 Implementation..........................................................................................................12
2.4.1 The software and tools used in analysis..............................................................13
2.4.2 The actual analysis and tabulation of results.......................................................13
3 Result analysis...................................................................................................................19
3.1 Results estimation......................................................................................................20
3.2 Results summary........................................................................................................20
4 Outline of the research and result analysis........................................................................21
References............................................................................................................................23
3
List of Figures
Figure 1: Data pre-processing..........................................................................................................8
Figure 2: A pie chart showing the percentage of hospitals using and those not using artificial
intelligence in their operations.......................................................................................................14
Figure 3: A pie chart showing the percentage of clinics using and those not using artificial
intelligence in their operations.......................................................................................................14
Figure 4: A pie chart showing the percentage of the other healthcare centers using and those not
using artificial intelligence in their operations..............................................................................15
Figure 5: A bar graph showing the numbers of the data sources...................................................16
Figure 6: A pie chart showing the percentage of hospitals supporting and those not supporting
artificial intelligence in their operations........................................................................................17
Figure 7: A pie chart showing the percentage of clinics supporting and those not supporting
artificial intelligence in their operations........................................................................................17
Figure 8: A pie chart showing the percentage of the other healthcare centers supporting and those
not supporting artificial intelligence in their operations................................................................18
Figure 9: A bar graph showing the organizations which support artificial intelligence in their
operations.......................................................................................................................................19
⊘ This is a preview!⊘
Do you want full access?
Subscribe today to unlock all pages.
Trusted by 1+ million students worldwide
4
List of Tables
Table 1: Data collection table..........................................................................................................6
Table 2: Data storage table..............................................................................................................7
Table 3: Feature selection and data reduction table.......................................................................10
Table 4: A table of questionnaire questions..................................................................................11
Table 5: A table showing the organizations used in data collection..............................................11
Table 6: A table showing the organizations which supported the use of artificial intelligence in
their operations..............................................................................................................................12
Table 7: A table showing the numbers and the percentages of the organizations using artificial
intelligence in their operations.......................................................................................................13
Table 8: A table showing the numbers and the percentages of the organizations supporting the
use of artificial intelligence in their operations.............................................................................16
Paraphrase This Document
Need a fresh take? Get an instant paraphrase of this document with our AI Paraphraser
5
How artificial intelligence is affecting healthcare
1 Data collection and storage
Before we perform any experiment or research, it’s important for us to collect the data to
be used in the experiment or the research. In our case, we are interested in collecting the data
which can help us to understand how artificial intelligence is affecting the field of healthcare. For
our research to be successful, we must identify the best sources of data, collect the most
appropriate data, record it, store it appropriately, and use it as required to generate the desired
results of our research.
1.1 Data sources
The main aim of our paper is to study how artificial intelligence is affecting healthcare and
so the main data sources to be used will be major hospitals, clinics, and other healthcare centers
in our societies (Beam et al., 2018). From these medical centers, we’ll be able to see how
artificial intelligence is applied and how it is affecting the performance of the medical centers.
1.2 Data collection
After identifying the most appropriate data sources, the required data is collected and
recorded in the table shown below. The table shows the sources of the data, the type of the data,
the format of the data, the fee incurred, among other specifications of the data and the
requirements for the data collection.
6
Table 1: Data collection table
Data
source
name
Source
organization
(major
hospitals,
clinics, and
the other
healthcare
organizations)
Data description Data file
format
Charge
fee
Target
data
source
Data 1 Major
hospitals
Application of artificial
intelligence in major
hospitals
txt Free Yes
Data 2 Clinics Application of artificial
intelligence in clinics
txt Free Yes
Data 3 Other
healthcare
centers
Application of artificial
intelligence in other
healthcare centers
txt Free Yes
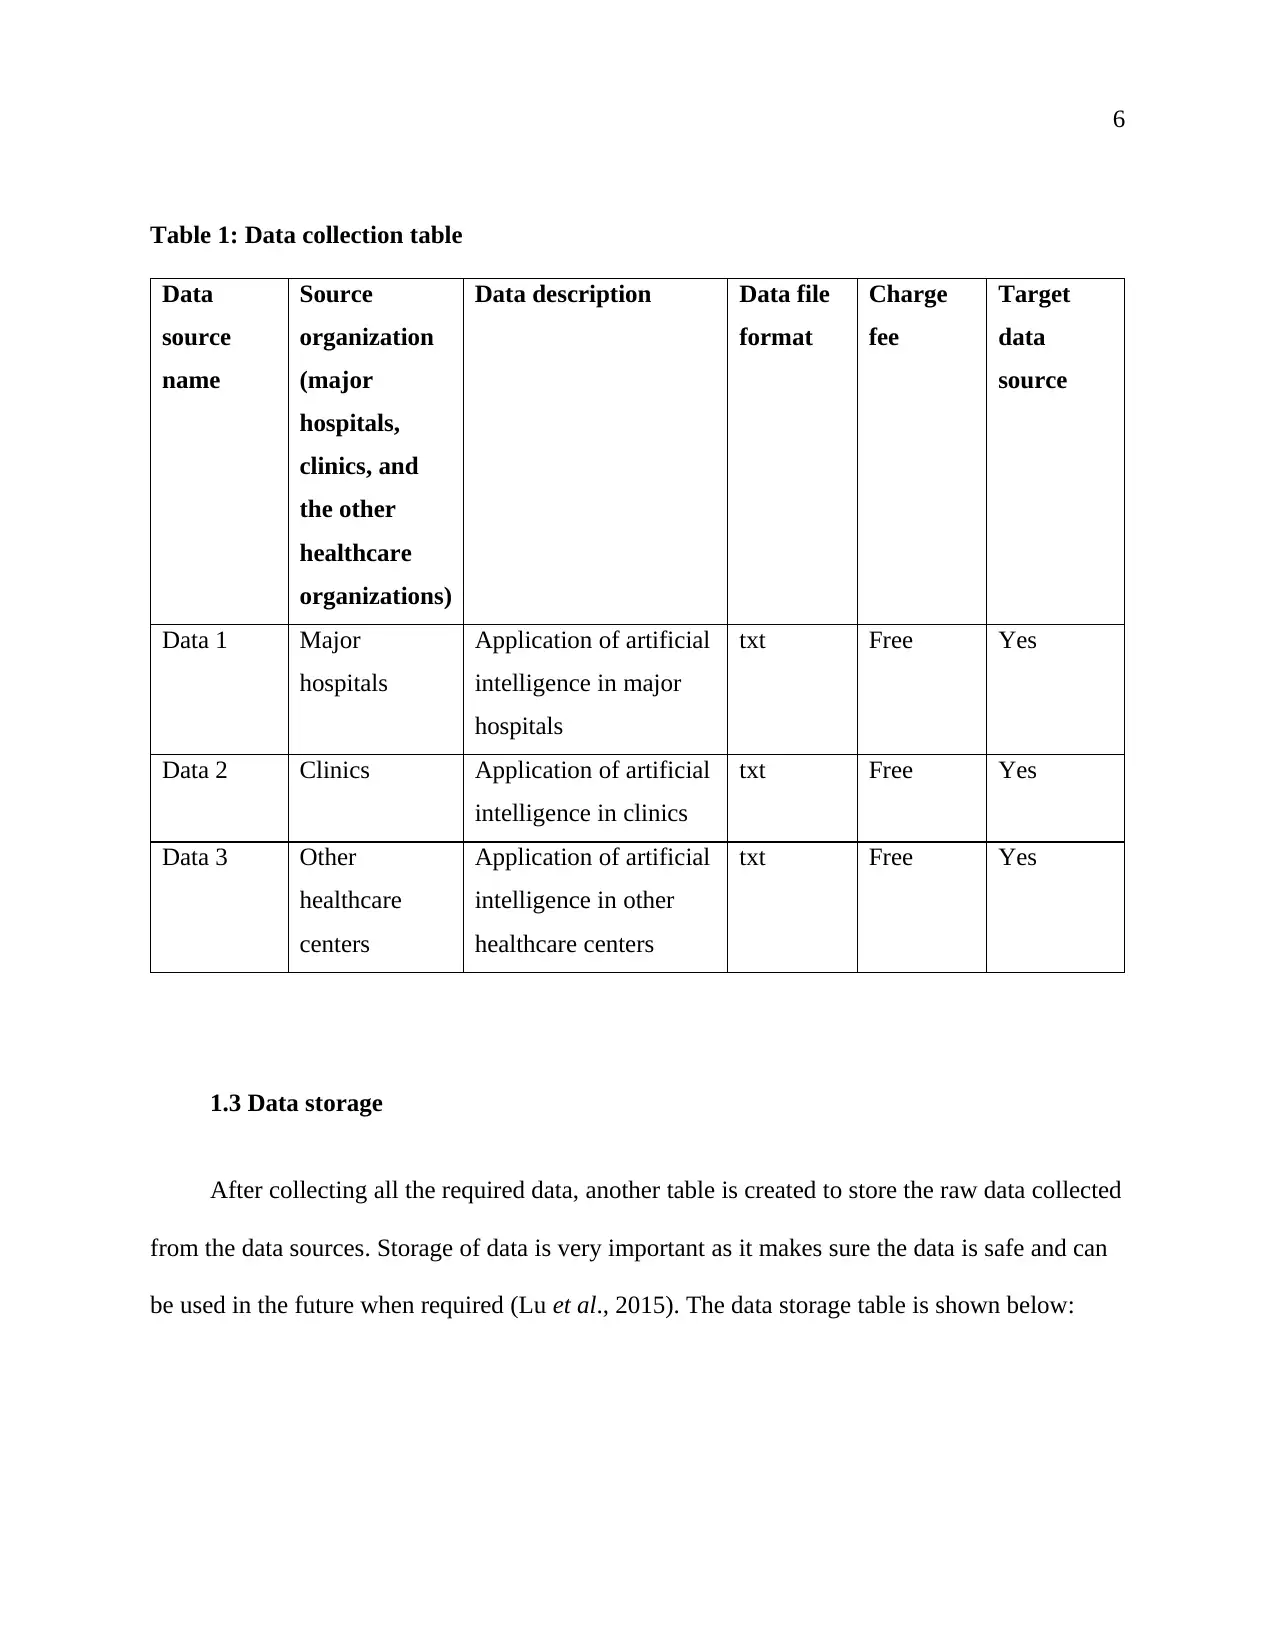
1.3 Data storage
After collecting all the required data, another table is created to store the raw data collected
from the data sources. Storage of data is very important as it makes sure the data is safe and can
be used in the future when required (Lu et al., 2015). The data storage table is shown below:
Table 1: Data collection table
Data
source
name
Source
organization
(major
hospitals,
clinics, and
the other
healthcare
organizations)
Data description Data file
format
Charge
fee
Target
data
source
Data 1 Major
hospitals
Application of artificial
intelligence in major
hospitals
txt Free Yes
Data 2 Clinics Application of artificial
intelligence in clinics
txt Free Yes
Data 3 Other
healthcare
centers
Application of artificial
intelligence in other
healthcare centers
txt Free Yes
1.3 Data storage
After collecting all the required data, another table is created to store the raw data collected
from the data sources. Storage of data is very important as it makes sure the data is safe and can
be used in the future when required (Lu et al., 2015). The data storage table is shown below:
⊘ This is a preview!⊘
Do you want full access?
Subscribe today to unlock all pages.
Trusted by 1+ million students worldwide
7
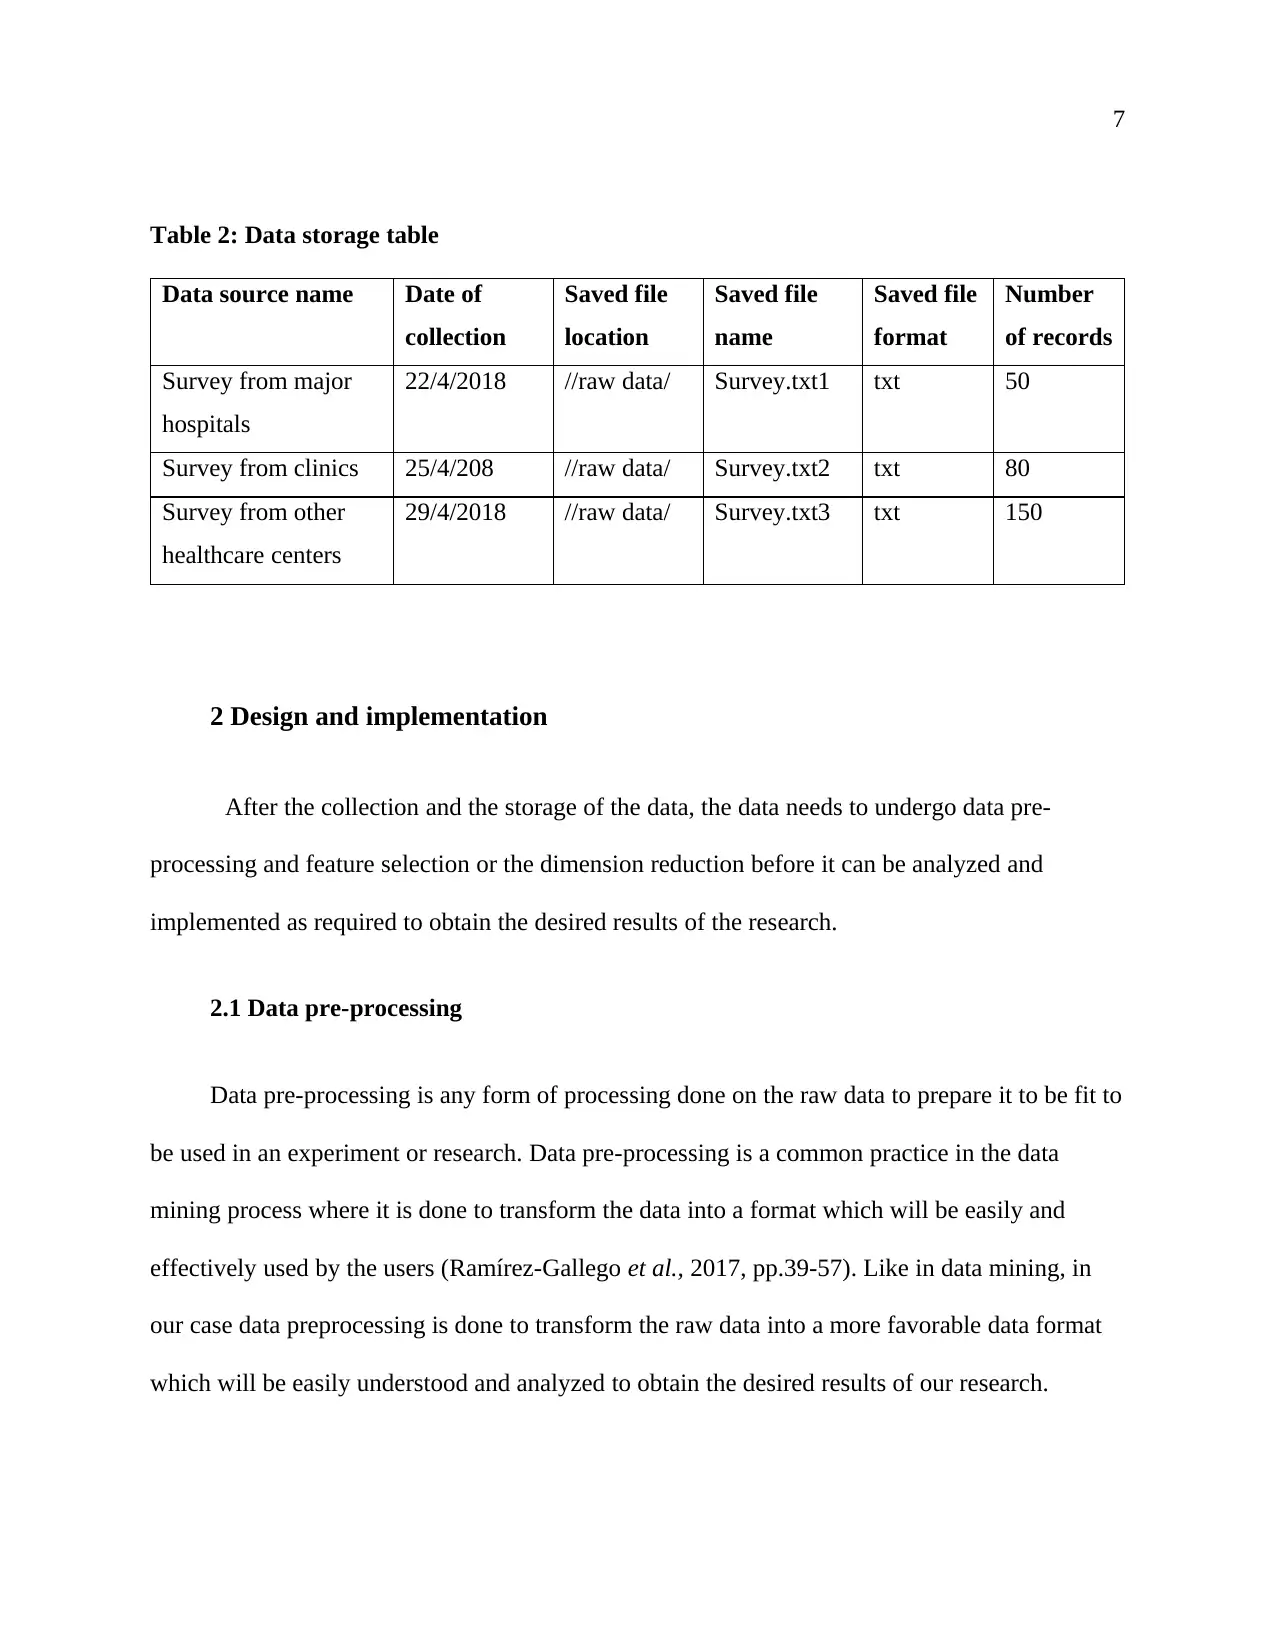
Table 2: Data storage table
Data source name Date of
collection
Saved file
location
Saved file
name
Saved file
format
Number
of records
Survey from major
hospitals
22/4/2018 //raw data/ Survey.txt1 txt 50
Survey from clinics 25/4/208 //raw data/ Survey.txt2 txt 80
Survey from other
healthcare centers
29/4/2018 //raw data/ Survey.txt3 txt 150
2 Design and implementation
After the collection and the storage of the data, the data needs to undergo data pre-
processing and feature selection or the dimension reduction before it can be analyzed and
implemented as required to obtain the desired results of the research.
2.1 Data pre-processing
Data pre-processing is any form of processing done on the raw data to prepare it to be fit to
be used in an experiment or research. Data pre-processing is a common practice in the data
mining process where it is done to transform the data into a format which will be easily and
effectively used by the users (Ramírez-Gallego et al., 2017, pp.39-57). Like in data mining, in
our case data preprocessing is done to transform the raw data into a more favorable data format
which will be easily understood and analyzed to obtain the desired results of our research.
Paraphrase This Document
Need a fresh take? Get an instant paraphrase of this document with our AI Paraphraser
8
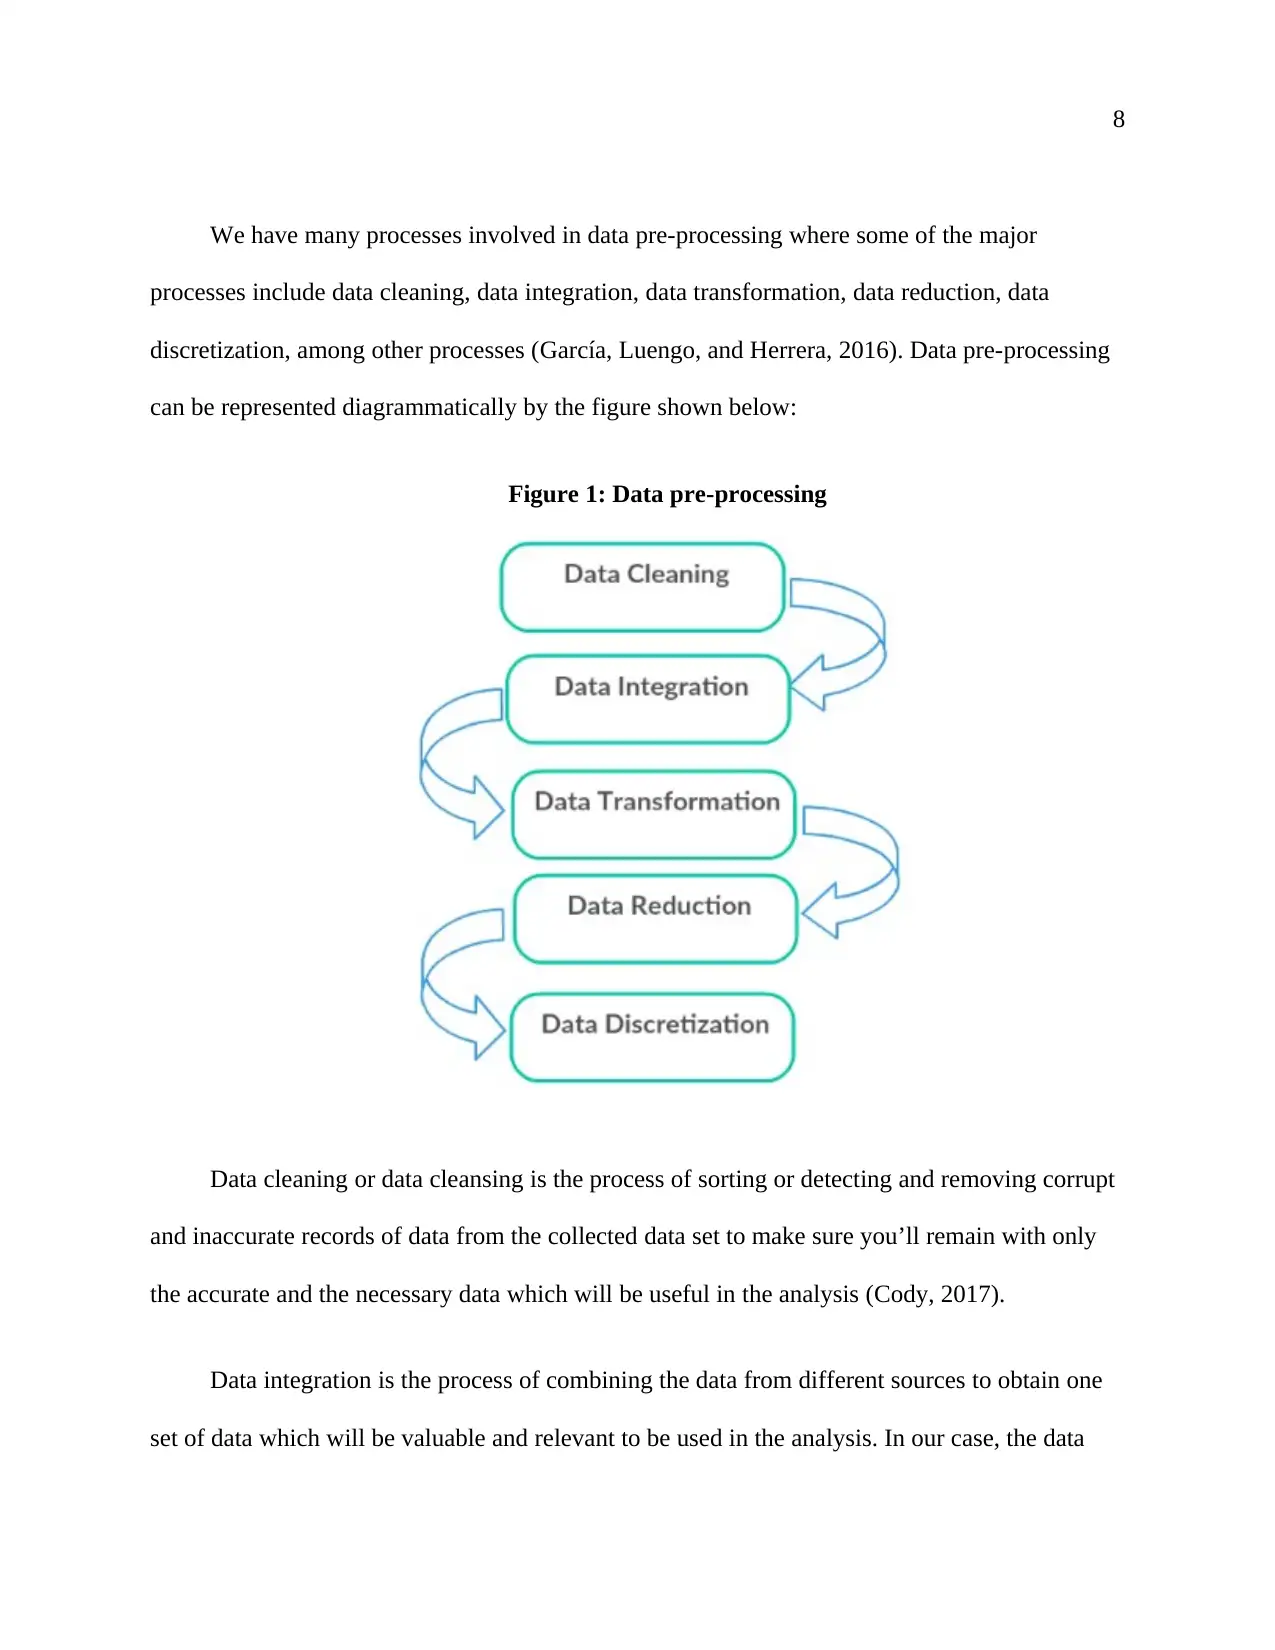
We have many processes involved in data pre-processing where some of the major
processes include data cleaning, data integration, data transformation, data reduction, data
discretization, among other processes (García, Luengo, and Herrera, 2016). Data pre-processing
can be represented diagrammatically by the figure shown below:
Figure 1: Data pre-processing
Data cleaning or data cleansing is the process of sorting or detecting and removing corrupt
and inaccurate records of data from the collected data set to make sure you’ll remain with only
the accurate and the necessary data which will be useful in the analysis (Cody, 2017).
Data integration is the process of combining the data from different sources to obtain one
set of data which will be valuable and relevant to be used in the analysis. In our case, the data
9
from the major hospitals, the clinics, and other healthcare centers is combined to obtain one data
set which will be analyzed easily to understand how artificial intelligence affects the field of
healthcare (Cudré-Mauroux, 2017, pp.5-6).
Data transformation is the process of converting all the integrated data into the format
which is required during the analysis of the data (Heer, Hellerstein, and Kandel, 2015).
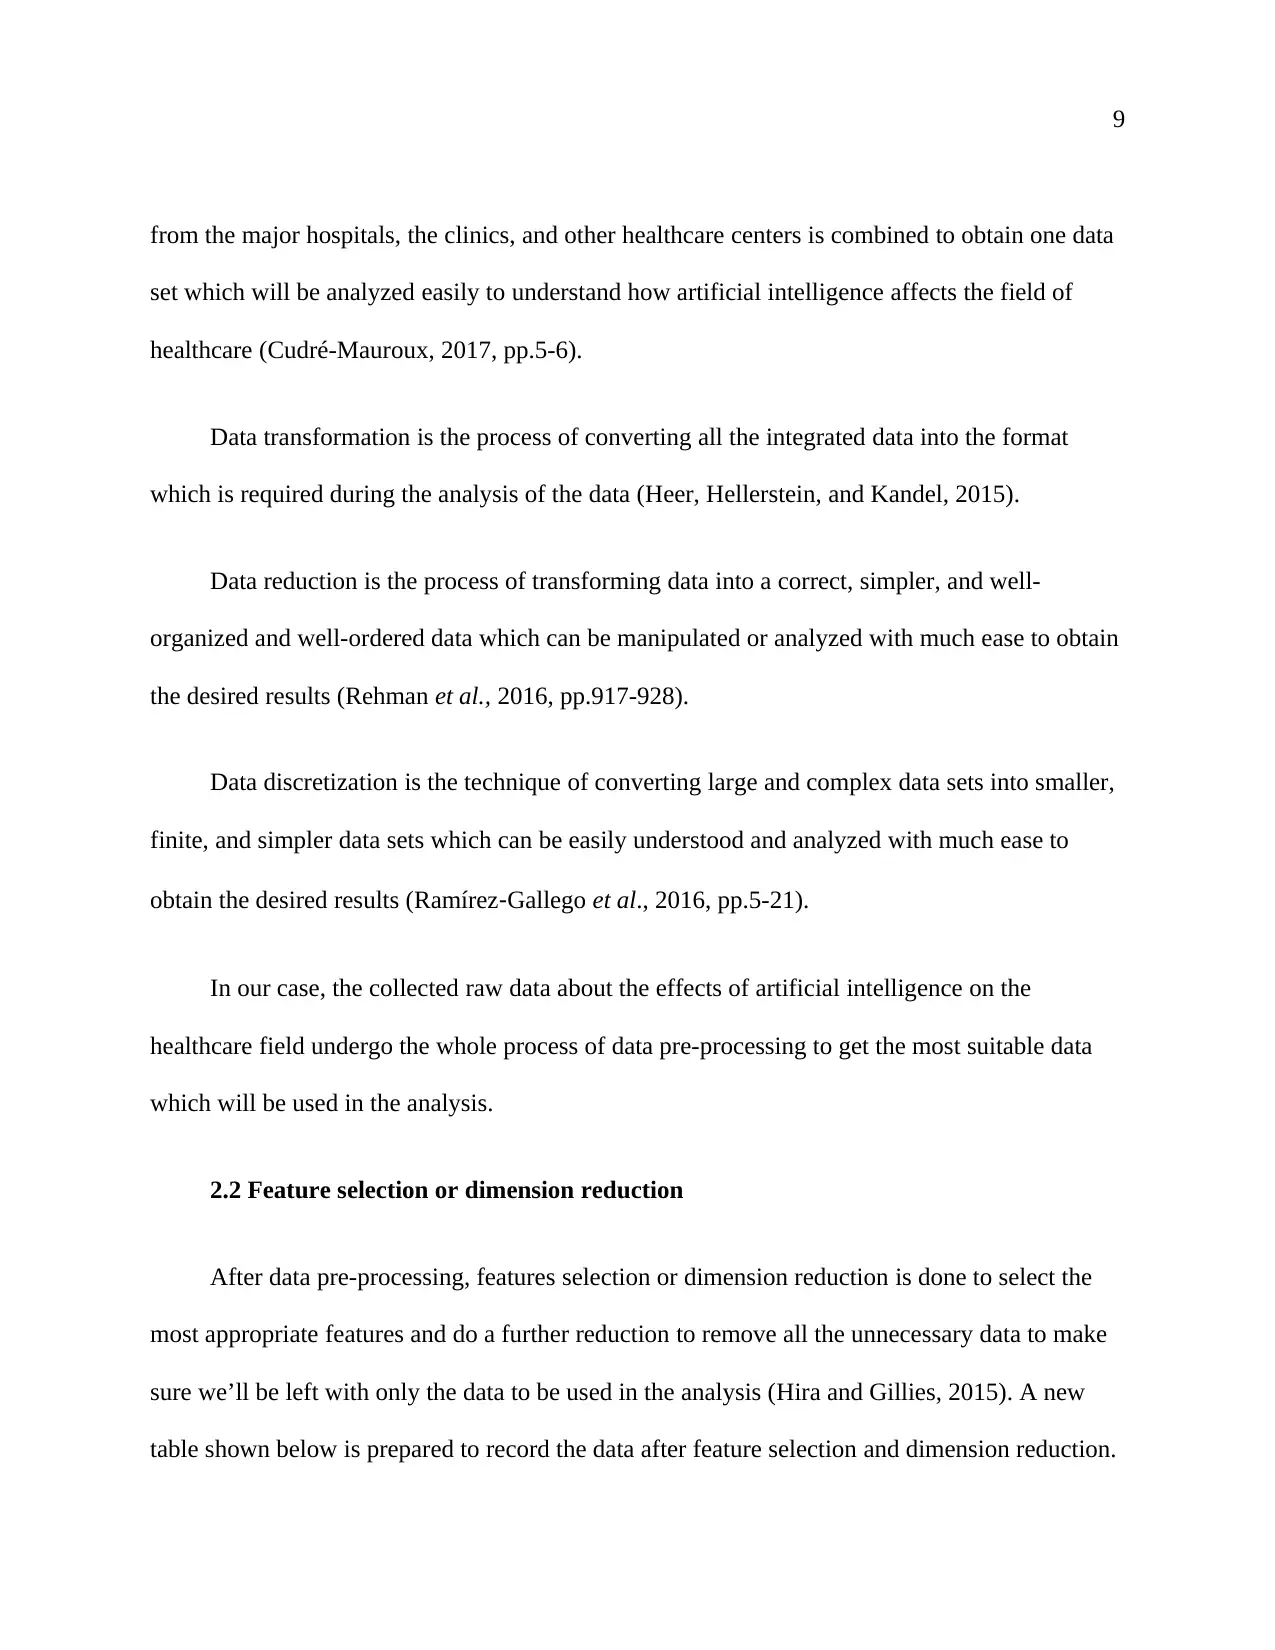
Data reduction is the process of transforming data into a correct, simpler, and well-
organized and well-ordered data which can be manipulated or analyzed with much ease to obtain
the desired results (Rehman et al., 2016, pp.917-928).
Data discretization is the technique of converting large and complex data sets into smaller,
finite, and simpler data sets which can be easily understood and analyzed with much ease to
obtain the desired results (Ramírez‐Gallego et al., 2016, pp.5-21).
In our case, the collected raw data about the effects of artificial intelligence on the
healthcare field undergo the whole process of data pre-processing to get the most suitable data
which will be used in the analysis.
2.2 Feature selection or dimension reduction
After data pre-processing, features selection or dimension reduction is done to select the
most appropriate features and do a further reduction to remove all the unnecessary data to make
sure we’ll be left with only the data to be used in the analysis (Hira and Gillies, 2015). A new
table shown below is prepared to record the data after feature selection and dimension reduction.
from the major hospitals, the clinics, and other healthcare centers is combined to obtain one data
set which will be analyzed easily to understand how artificial intelligence affects the field of
healthcare (Cudré-Mauroux, 2017, pp.5-6).
Data transformation is the process of converting all the integrated data into the format
which is required during the analysis of the data (Heer, Hellerstein, and Kandel, 2015).
Data reduction is the process of transforming data into a correct, simpler, and well-
organized and well-ordered data which can be manipulated or analyzed with much ease to obtain
the desired results (Rehman et al., 2016, pp.917-928).
Data discretization is the technique of converting large and complex data sets into smaller,
finite, and simpler data sets which can be easily understood and analyzed with much ease to
obtain the desired results (Ramírez‐Gallego et al., 2016, pp.5-21).
In our case, the collected raw data about the effects of artificial intelligence on the
healthcare field undergo the whole process of data pre-processing to get the most suitable data
which will be used in the analysis.
2.2 Feature selection or dimension reduction
After data pre-processing, features selection or dimension reduction is done to select the
most appropriate features and do a further reduction to remove all the unnecessary data to make
sure we’ll be left with only the data to be used in the analysis (Hira and Gillies, 2015). A new
table shown below is prepared to record the data after feature selection and dimension reduction.
⊘ This is a preview!⊘
Do you want full access?
Subscribe today to unlock all pages.
Trusted by 1+ million students worldwide
10
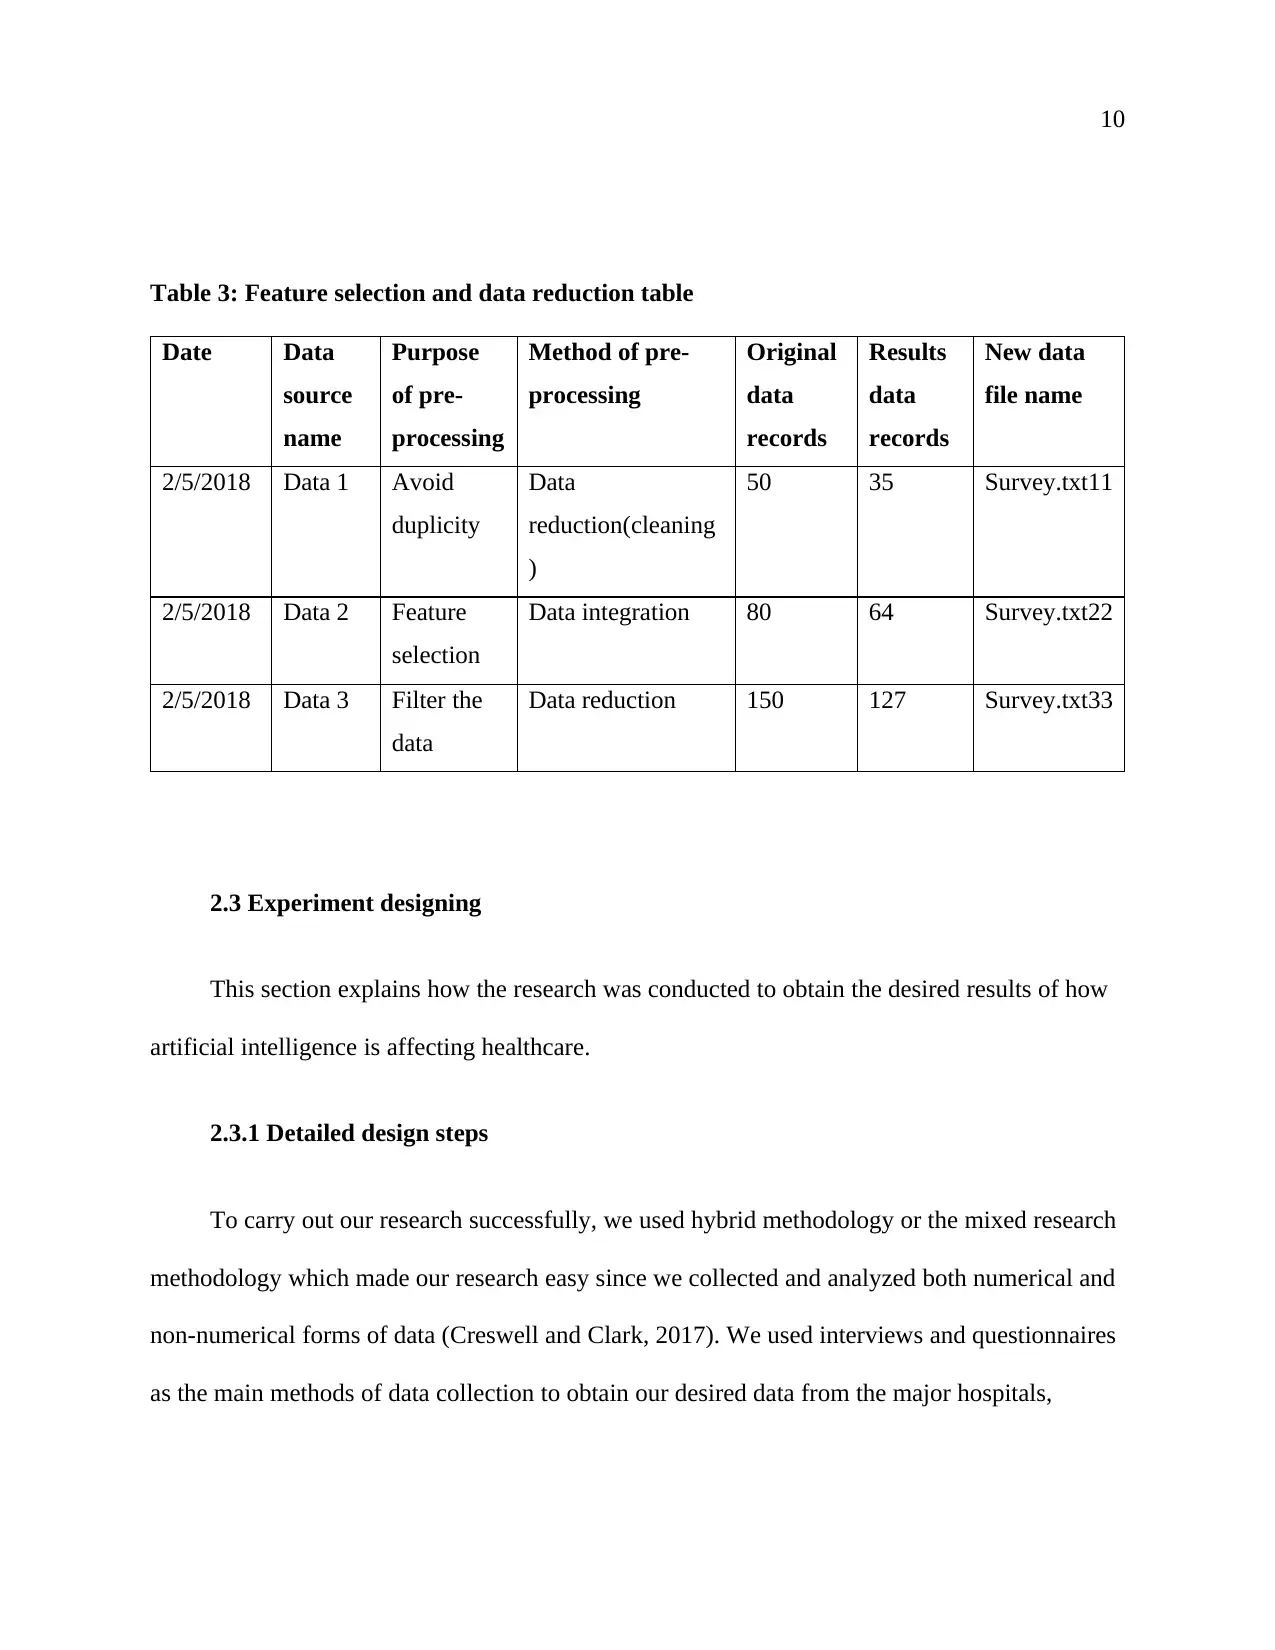
Table 3: Feature selection and data reduction table
Date Data
source
name
Purpose
of pre-
processing
Method of pre-
processing
Original
data
records
Results
data
records
New data
file name
2/5/2018 Data 1 Avoid
duplicity
Data
reduction(cleaning
)
50 35 Survey.txt11
2/5/2018 Data 2 Feature
selection
Data integration 80 64 Survey.txt22
2/5/2018 Data 3 Filter the
data
Data reduction 150 127 Survey.txt33
2.3 Experiment designing
This section explains how the research was conducted to obtain the desired results of how
artificial intelligence is affecting healthcare.
2.3.1 Detailed design steps
To carry out our research successfully, we used hybrid methodology or the mixed research
methodology which made our research easy since we collected and analyzed both numerical and
non-numerical forms of data (Creswell and Clark, 2017). We used interviews and questionnaires
as the main methods of data collection to obtain our desired data from the major hospitals,
Paraphrase This Document
Need a fresh take? Get an instant paraphrase of this document with our AI Paraphraser
11
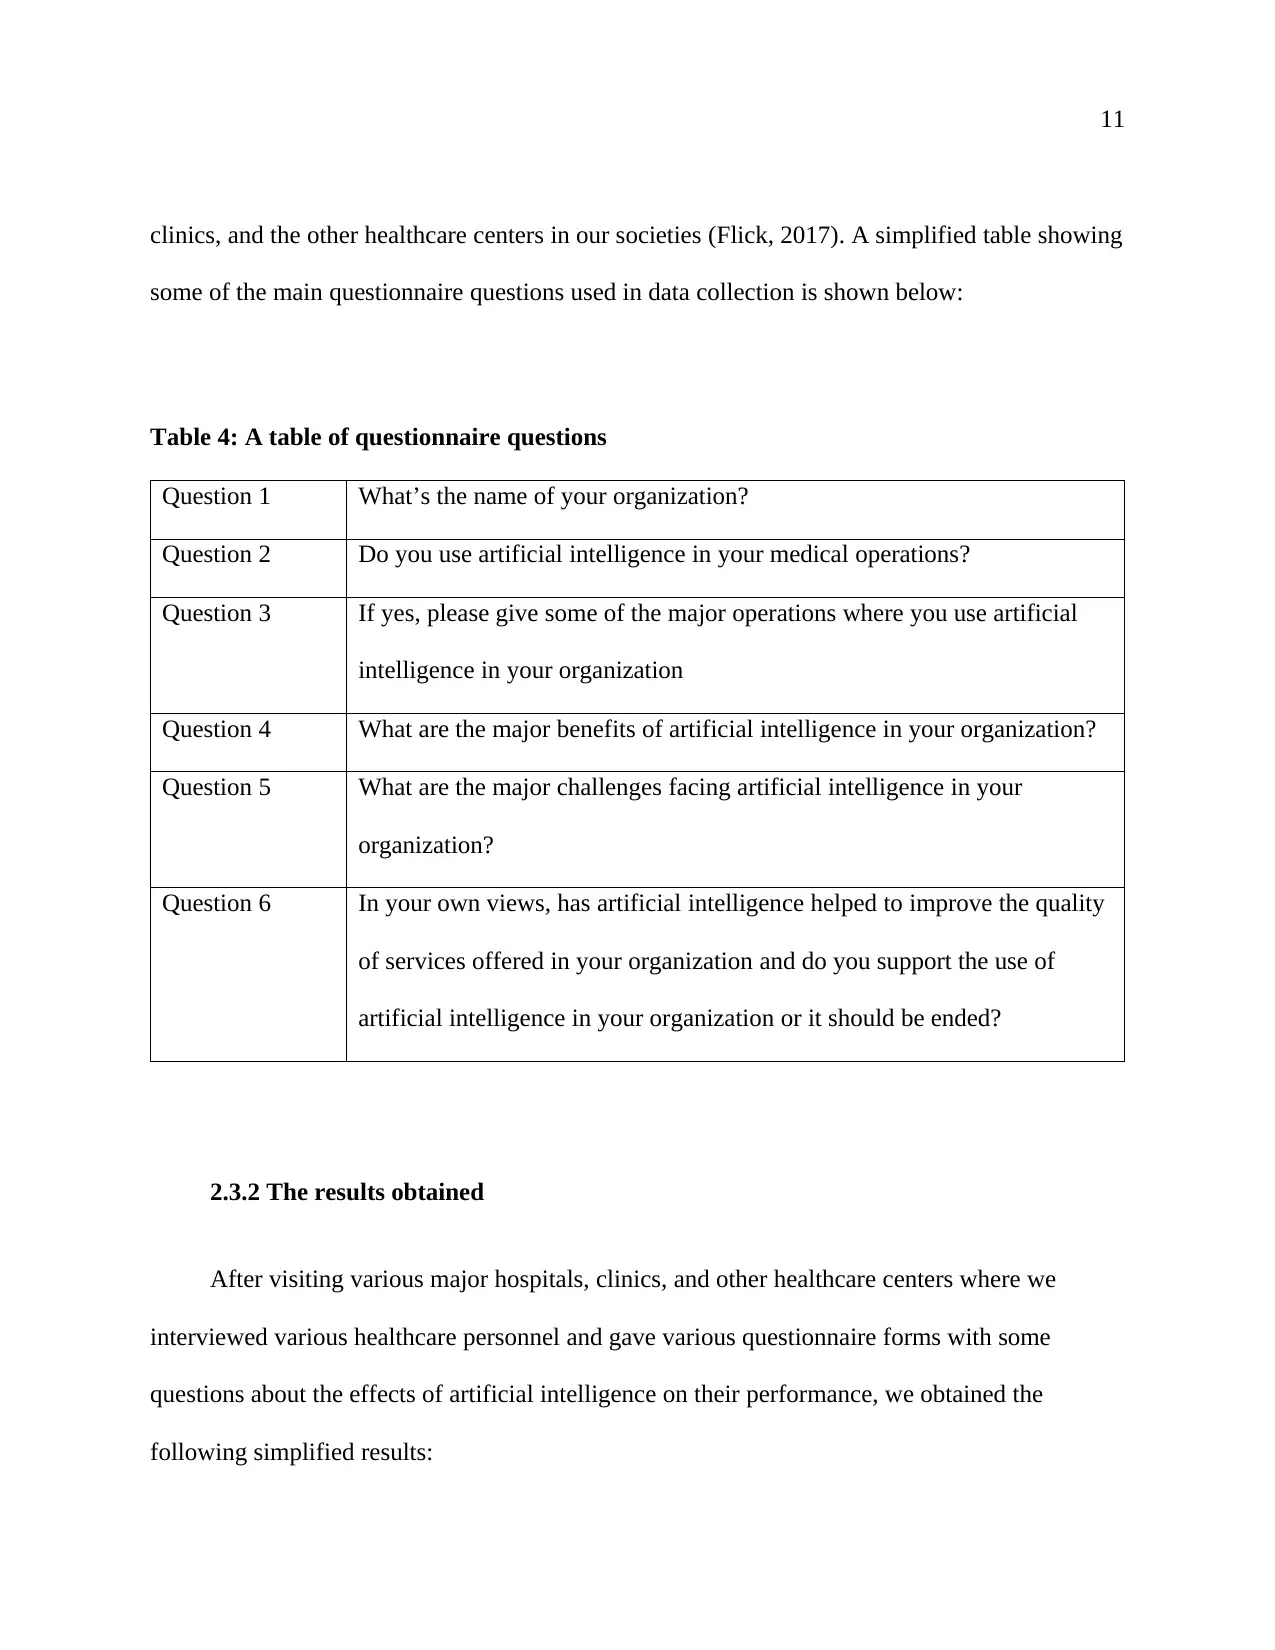
clinics, and the other healthcare centers in our societies (Flick, 2017). A simplified table showing
some of the main questionnaire questions used in data collection is shown below:
Table 4: A table of questionnaire questions
Question 1 What’s the name of your organization?
Question 2 Do you use artificial intelligence in your medical operations?
Question 3 If yes, please give some of the major operations where you use artificial
intelligence in your organization
Question 4 What are the major benefits of artificial intelligence in your organization?
Question 5 What are the major challenges facing artificial intelligence in your
organization?
Question 6 In your own views, has artificial intelligence helped to improve the quality
of services offered in your organization and do you support the use of
artificial intelligence in your organization or it should be ended?
2.3.2 The results obtained
After visiting various major hospitals, clinics, and other healthcare centers where we
interviewed various healthcare personnel and gave various questionnaire forms with some
questions about the effects of artificial intelligence on their performance, we obtained the
following simplified results:
12
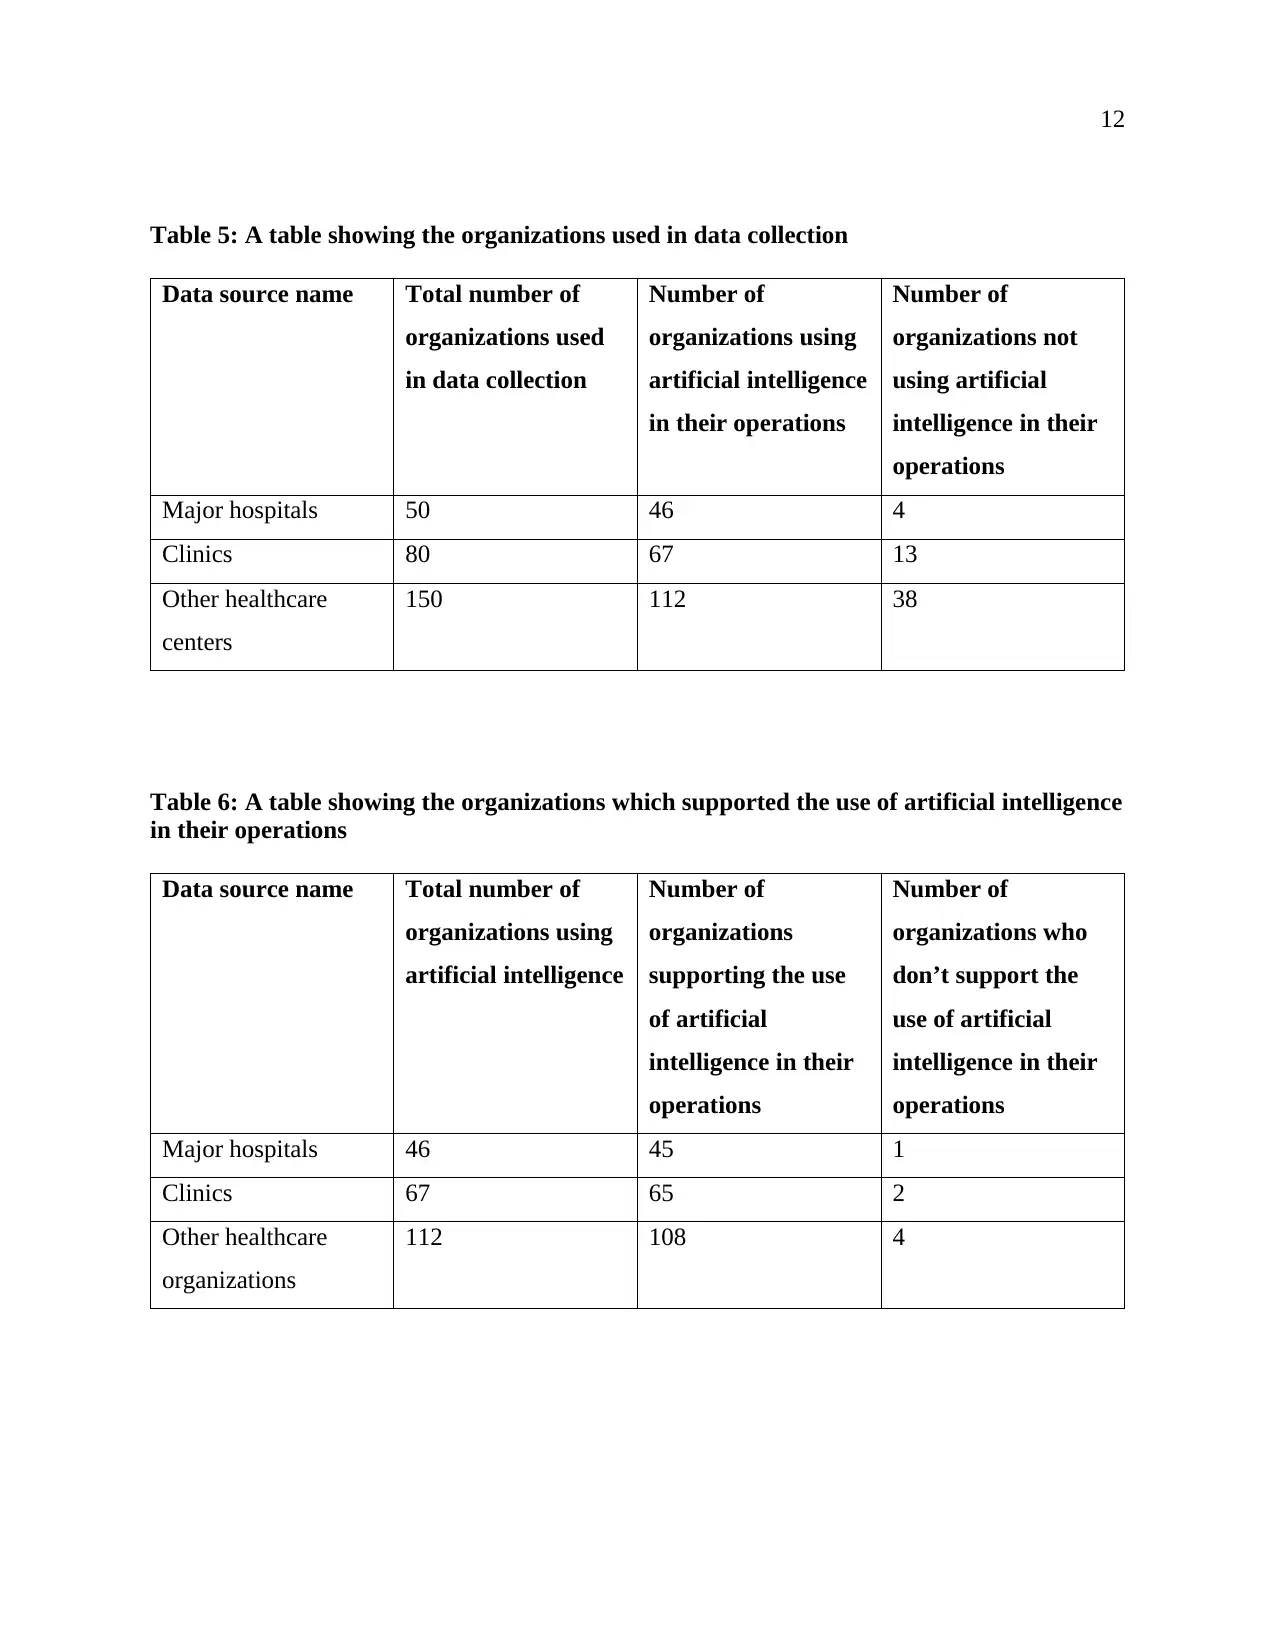
Table 5: A table showing the organizations used in data collection
Data source name Total number of
organizations used
in data collection
Number of
organizations using
artificial intelligence
in their operations
Number of
organizations not
using artificial
intelligence in their
operations
Major hospitals 50 46 4
Clinics 80 67 13
Other healthcare
centers
150 112 38
Table 6: A table showing the organizations which supported the use of artificial intelligence
in their operations
Data source name Total number of
organizations using
artificial intelligence
Number of
organizations
supporting the use
of artificial
intelligence in their
operations
Number of
organizations who
don’t support the
use of artificial
intelligence in their
operations
Major hospitals 46 45 1
Clinics 67 65 2
Other healthcare
organizations
112 108 4
⊘ This is a preview!⊘
Do you want full access?
Subscribe today to unlock all pages.
Trusted by 1+ million students worldwide
1 out of 25
Related Documents


Your All-in-One AI-Powered Toolkit for Academic Success.
+13062052269
info@desklib.com
Available 24*7 on WhatsApp / Email
![[object Object]](/_next/static/media/star-bottom.7253800d.svg)
Unlock your academic potential
Copyright © 2020–2026 A2Z Services. All Rights Reserved. Developed and managed by ZUCOL.