AI in Ophthalmology: A Comprehensive Review of Applications
VerifiedAdded on 2023/03/23
|16
|13829
|80
Literature Review
AI Summary
This document is a literature review that explores the applications of artificial intelligence (AI) in ophthalmology, focusing on the diagnosis of eye diseases such as diabetic retinopathy (DR), glaucoma, age-related macular degeneration (AMD), and cataracts. It introduces AI algorithms, including conventional machine learning (CML) techniques like decision trees, random forests (RF), and support vector machines (SVM), as well as deep learning (DL) methods such as convolutional neural networks (CNN). The review details the steps involved in building AI models, from data preprocessing to training, validation, and testing, and discusses various ophthalmic imaging modalities used in AI diagnosis. It also highlights the potential of AI to revolutionize disease diagnosis in ophthalmology by improving accuracy and efficiency, ultimately aiming to provide a comprehensive overview for both ophthalmologists and computer scientists interested in AI applications in this field. The document is a student contribution and is available on Desklib, a platform offering study tools, past papers, and solved assignments.
Review Article
Applications of Artificial Intelligence in Ophthalmology
General Overview
Wei Lu,1Yan Tong,1Yue Yu,2Yiqiao Xing,1Changzheng Chen,1and Yin Shen1
1Eye Center,Renmin Hospitalof Wuhan University,Eye Institute of Wuhan University,Wuhan,Hubei,China
2Hisee MedicalArtificialIntelligent Lab,Wuhan University,Wuhan,Hubei,China
Correspondence should be addressed to Yin Shen; yinshen@whu.edu.cn
Received 7 July 2018; Revised 6 October 2018; Accepted 17 October 2018; Published 19 November 2018
Academic Editor: Hiroshi Kunikata
Copyright © 2018 Wei Lu et al. This is an open access article distributed under the Creative Commons Attribution
permits unrestricted use,distribution,and reproduction in any medium,provided the original work is properly cited.
With the emergence ofunmanned plane,autonomous vehicles,face recognition,and language processing,the artificialin-
telligence (AI) has remarkably revolutionized our lifestyle. Recent studies indicate that AI has astounding potentia
much better than human beings in some tasks, especially in the image recognition field. As the amount of image
center of ophthalmology is increasing dramatically, analyzing and processing these data is in urgent need. AI has
apply to decipher medical data and has made extraordinary progress in intelligent diagnosis. In this paper, we pre
workflow for building an AI model and systematically reviewed applications of AI in the diagnosis of eye diseases.
should focus on setting up systematic AI platforms to diagnose general eye diseases based on multimodal data in
1. Introduction
As population aging has become a major demographic trend
around the world,patients suffering from eye diseases are
expected to increase steeply. Early detection and appropriate
treatment of eye diseases are of great significance to prevent
vision loss and promote living quality.Conventionaldi-
agnose methods are tremendously depend on physicians’
professional experience and knowledge,which lead to high
misdiagnosis rate and huge waste ofmedicaldata.Deep
integration of ophthalmology and artificial intelligence (AI)
has the potentialto revolutionize current disease diagnose
pattern and generate a significant clinicalimpact.
Proposed in 1956 by Dartmouth scholar John McCarthy,
AI is a general term that “refers to hardware or software that
exhibits behavior which appears intelligent” [1].Though oc-
curred sixty years ago, it is until recently that the effectiveness
of AI has been highlighted because of the development of new
algorithms,specialized hardware,cloud-based services,and
big data. Machine learning (ML), occurred in 1980s, is a subset
of AI, and is defined as a set of methods that automatically
detect patterns in data and then incorporate this information
to predictfuturedata underuncertain conditions.Deep
learning (DL), occurred in 2000s, is a burgeoning technolog
of ML and has revolutionized the world of AI.These tech-
nologiespowermany aspectsof modern society,such as
objects’recognition in images,real-time languages’trans-
lation,device manipulation via speech (such as Apple’s Siri,
Amazon Alexa,and Microsoft Cortana),and so on.
The field of healthcare has been the forefront of the AI
application in recent years. Multiple studies have shown th
DL algorithms performed ata high levelwhen applied to
breast histopathology analysis [2],skin cancer classification
[3], cardiovasculardiseases’risk prediction [4],and lung
cancer detection [5]. These impressive research studies in
numerous studies to apply AI in ophthalmology.Advanced
AI algorithms together with multiple accessible data sets, s
as EyePACS [6], Messidor [6], and Kaggle’s data set [7], ca
make breakthroughs on various ophthalmological issues.
The rapid rise in AI technology requires physicians and
computer scientists to have a good mutual understanding
not only the technology butalso the medicalpractice to
enhance medicalcare in the near future.MiguelCaixinha
and SandrinaNunes introduced conventionalmachine
learning (CML)techniquesand reviewed applicationsof
CML for diagnosis and monitoring ofmultimodalocular
Hindawi
Journal of Ophthalmology
Volume 2018, Article ID 5278196, 15 pages
https://doi.org/10.1155/2018/5278196
Paraphrase This Document
Need a fresh take? Get an instant paraphrase of this document with our AI Paraphraser
disease, without the mention about DL [8]. Litjens et al. [9]
detailly introduced various DL methods for different tasks
and provided an overview of studies per application area,
whereas the “retina” section majorly focused on the fundus
images only. Lee et al. [10] introduced the AI development in
ophthalmology generally.Rahimy [11] focused on DL ap-
plications in the ophthalmology field,without the mention
about CML. Louis J. Catania and Ernst Nicolitz systemically
reviewed AI and robotic applications in multiple categories
of vision and eye care butmentioned little aboutAI di-
agnosis of retinaldiseases [12].
In this review, we systematically reviewed the application
of AI (both CML and DL)in diagnosing ocular diseases,
including the four leading cause of adult blindness diabetic
retinopathy (DR),glaucoma,age-related macular degenera-
tion (AMD), and cataract. We also introduced the existing AI
methods,the ophthalmic imaging modalities,detailed steps
for building AImodels,and evaluation metrics in AIdi-
agnosis. We hope we can provide both ophthalmologists and
computer scientists a meaningfuland comprehensive sum-
mary on AI applicationsin ophthalmology and facilitate
promising AI projects in the ophthalmology field.
2. AI Algorithms
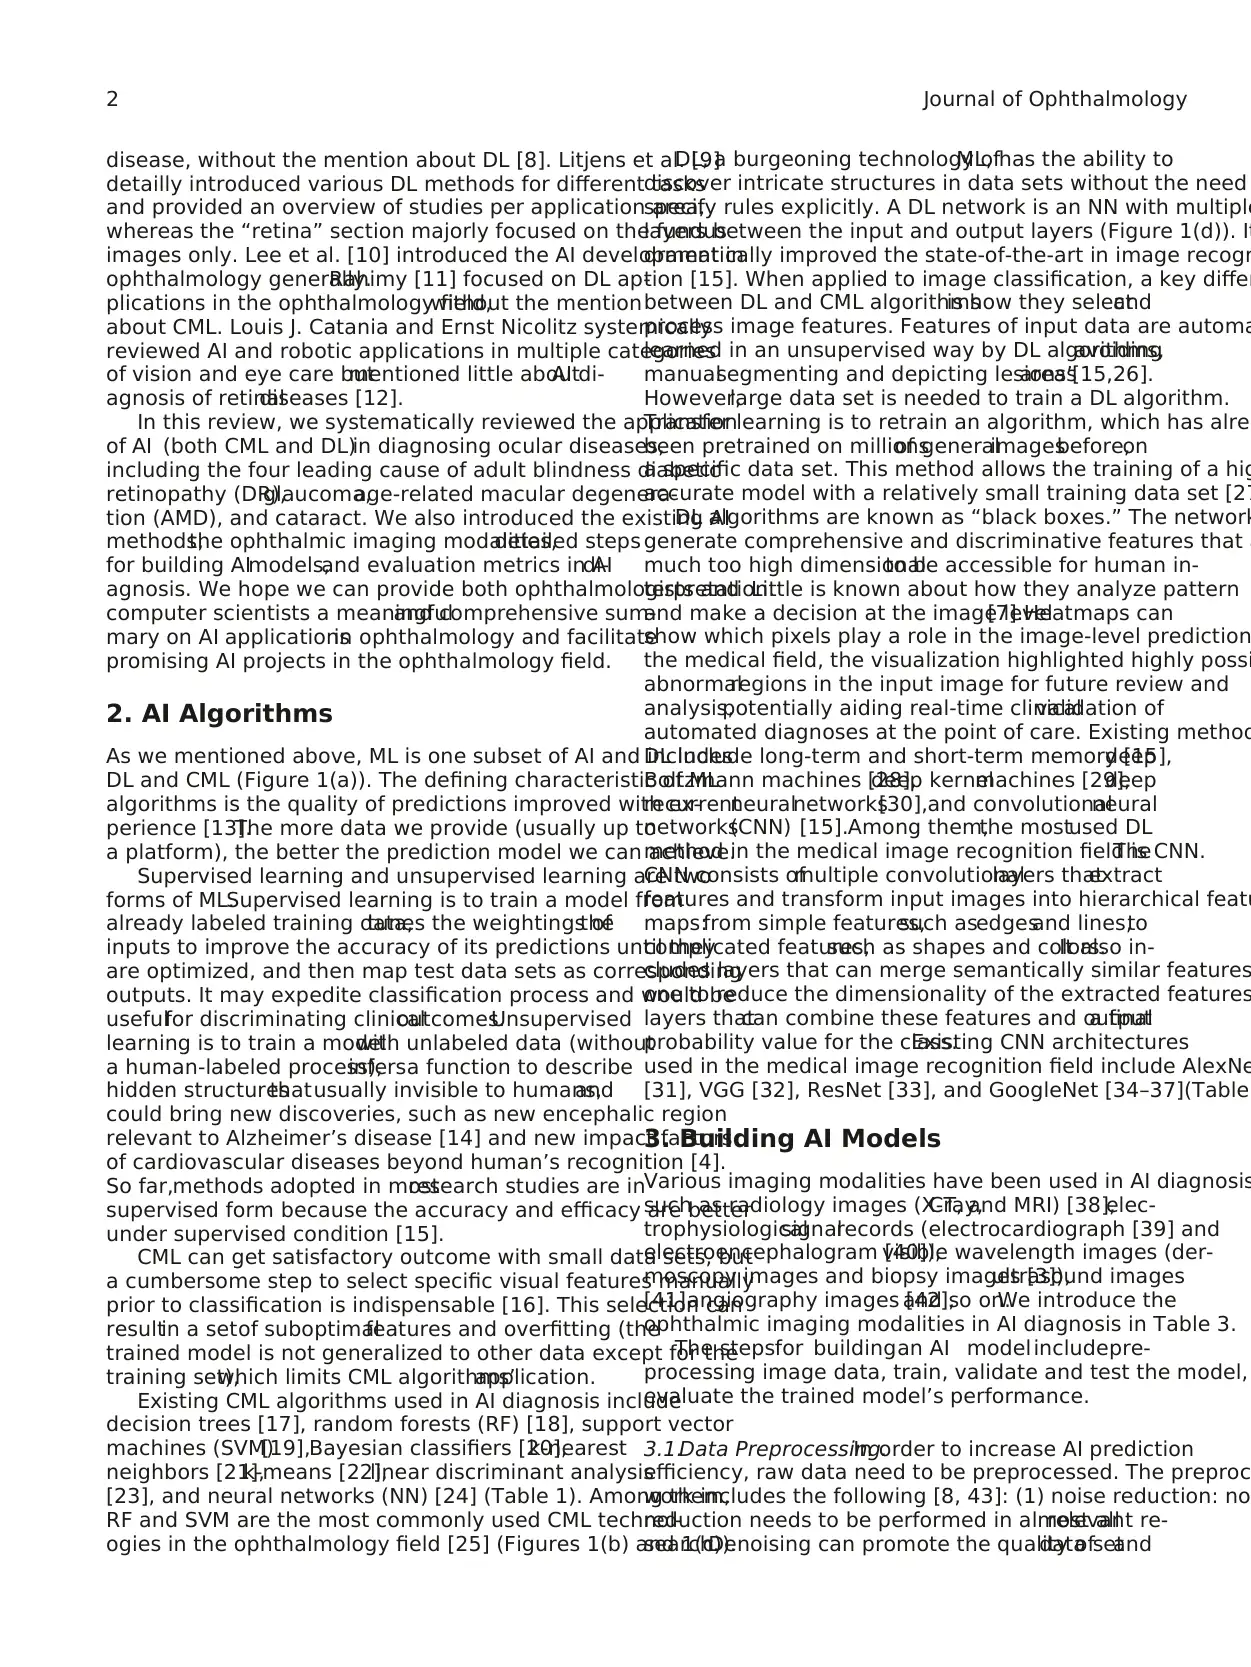
As we mentioned above, ML is one subset of AI and includes
DL and CML (Figure 1(a)). The defining characteristic of ML
algorithms is the quality of predictions improved with ex-
perience [13].The more data we provide (usually up to
a platform), the better the prediction model we can achieve.
Supervised learning and unsupervised learning are two
forms of ML.Supervised learning is to train a model from
already labeled training data,tunes the weightings ofthe
inputs to improve the accuracy of its predictions until they
are optimized, and then map test data sets as corresponding
outputs. It may expedite classification process and would be
usefulfor discriminating clinicaloutcomes.Unsupervised
learning is to train a modelwith unlabeled data (without
a human-labeled process),infersa function to describe
hidden structuresthatusually invisible to humans,and
could bring new discoveries, such as new encephalic region
relevant to Alzheimer’s disease [14] and new impact factors
of cardiovascular diseases beyond human’s recognition [4].
So far,methods adopted in mostresearch studies are in
supervised form because the accuracy and efficacy are better
under supervised condition [15].
CML can get satisfactory outcome with small data sets, but
a cumbersome step to select specific visual features manually
prior to classification is indispensable [16]. This selection can
resultin a setof suboptimalfeatures and overfitting (the
trained model is not generalized to other data except for the
training set),which limits CML algorithms’application.
Existing CML algorithms used in AI diagnosis include
decision trees [17], random forests (RF) [18], support vector
machines (SVM)[19],Bayesian classifiers [20],k-nearest
neighbors [21],k-means [22],linear discriminant analysis
[23], and neural networks (NN) [24] (Table 1). Among them,
RF and SVM are the most commonly used CML technol-
ogies in the ophthalmology field [25] (Figures 1(b) and 1(c)).
DL, a burgeoning technology ofML, has the ability to
discover intricate structures in data sets without the need
specify rules explicitly. A DL network is an NN with multiple
layers between the input and output layers (Figure 1(d)). It
dramatically improved the state-of-the-art in image recogn
tion [15]. When applied to image classification, a key differ
between DL and CML algorithmsis how they selectand
process image features. Features of input data are automa
learned in an unsupervised way by DL algorithms,avoiding
manualsegmenting and depicting lesions’areas[15,26].
However,large data set is needed to train a DL algorithm.
Transfer learning is to retrain an algorithm, which has alrea
been pretrained on millionsof generalimagesbefore,on
a specific data set. This method allows the training of a hig
accurate model with a relatively small training data set [27
DL algorithms are known as “black boxes.” The network
generate comprehensive and discriminative features that a
much too high dimensionalto be accessible for human in-
terpretation.Little is known about how they analyze pattern
and make a decision at the image level[7].Heatmaps can
show which pixels play a role in the image-level prediction
the medical field, the visualization highlighted highly possi
abnormalregions in the input image for future review and
analysis,potentially aiding real-time clinicalvalidation of
automated diagnoses at the point of care. Existing method
DL include long-term and short-term memory [15],deep
Boltzmann machines [28],deep kernelmachines [29],deep
recurrentneuralnetworks[30],and convolutionalneural
networks(CNN) [15].Among them,the mostused DL
method in the medical image recognition field is CNN.The
CNN consists ofmultiple convolutionallayers thatextract
features and transform input images into hierarchical featu
maps:from simple features,such asedgesand lines,to
complicated features,such as shapes and colors.It also in-
cludes layers that can merge semantically similar features
one to reduce the dimensionality of the extracted features
layers thatcan combine these features and outputa final
probability value for the class.Existing CNN architectures
used in the medical image recognition field include AlexNe
[31], VGG [32], ResNet [33], and GoogleNet [34–37](Table
3. Building AI Models
Various imaging modalities have been used in AI diagnosis
such as radiology images (X-ray,CT, and MRI) [38],elec-
trophysiologicalsignalrecords (electrocardiograph [39] and
electroencephalogram [40]),visible wavelength images (der-
moscopy images and biopsy images [3]),ultrasound images
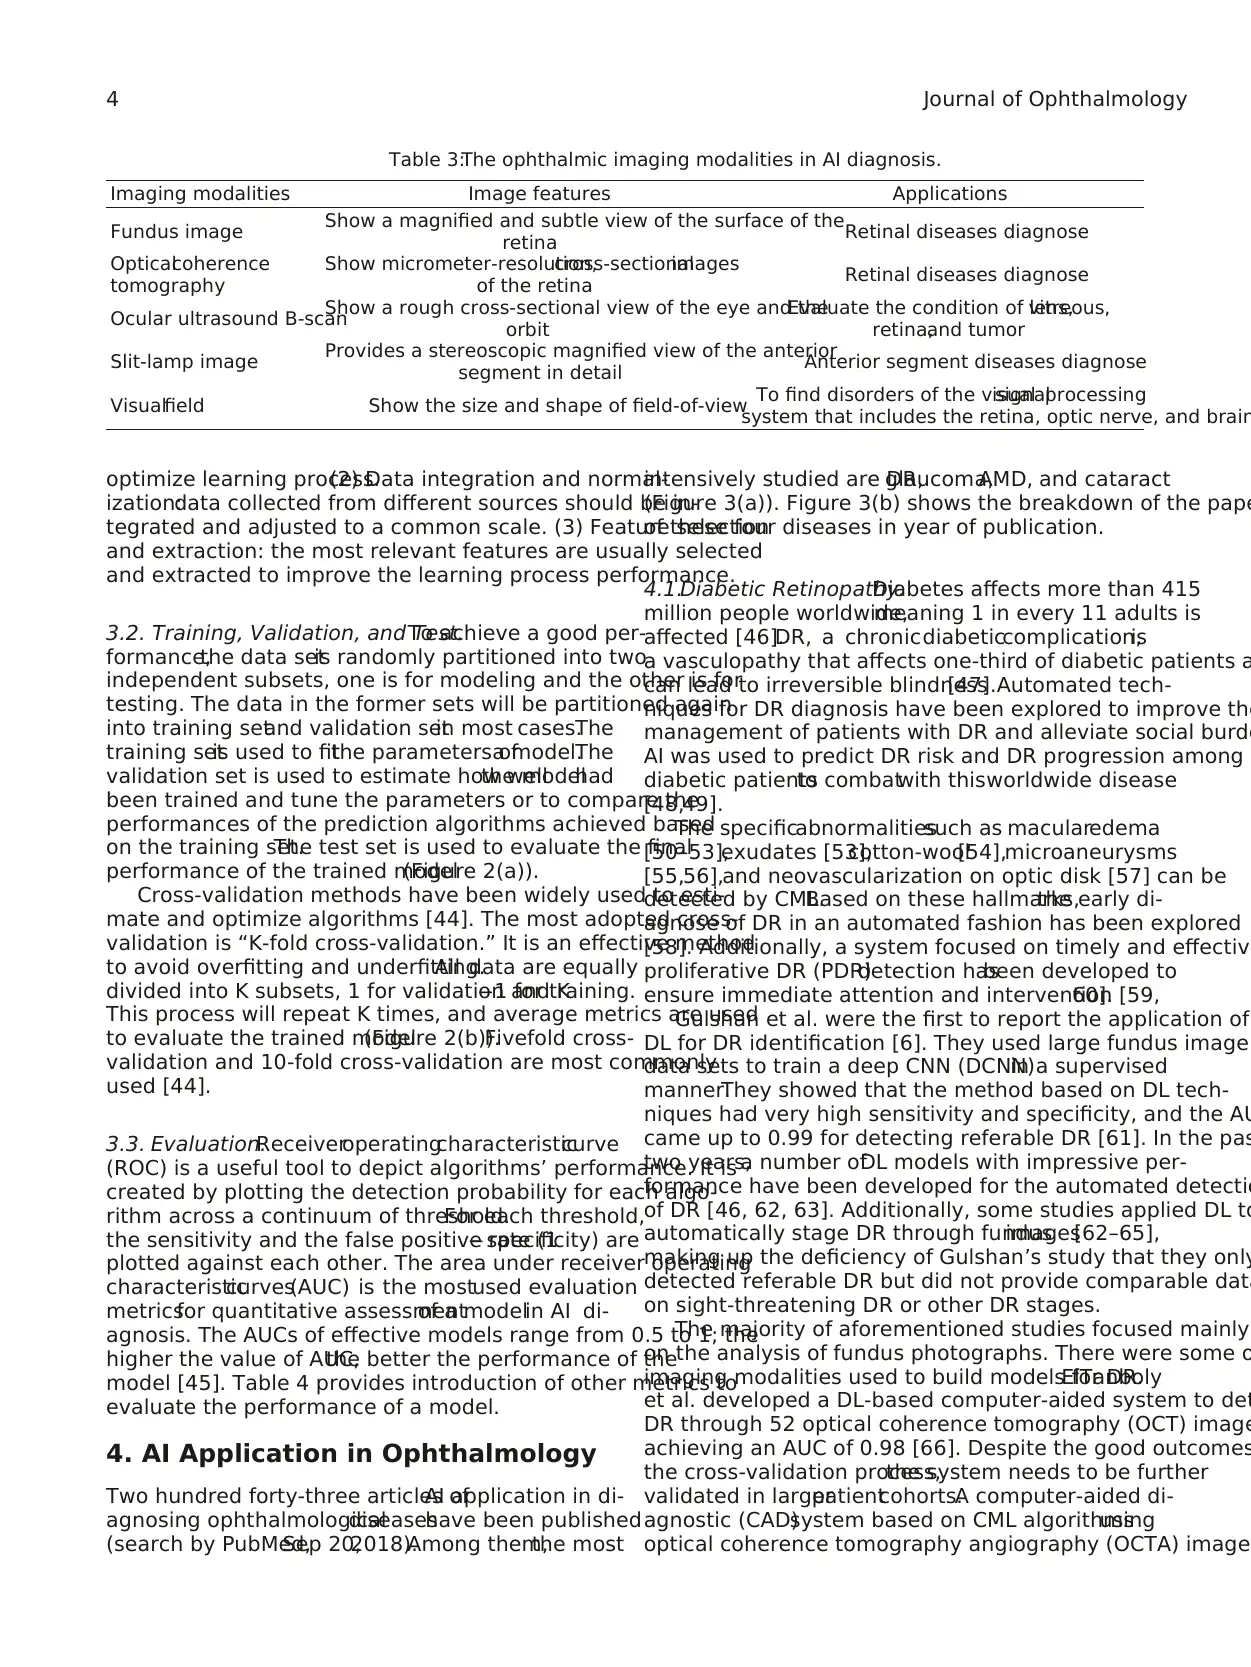
[41],angiography images [42],and so on.We introduce the
ophthalmic imaging modalities in AI diagnosis in Table 3.
The stepsfor buildingan AI model includepre-
processing image data, train, validate and test the model,
evaluate the trained model’s performance.
3.1.Data Preprocessing.In order to increase AI prediction
efficiency, raw data need to be preprocessed. The preproc
work includes the following [8, 43]: (1) noise reduction: no
reduction needs to be performed in almost allrelevant re-
search.Denoising can promote the quality ofdata setand
2 Journal of Ophthalmology
detailly introduced various DL methods for different tasks
and provided an overview of studies per application area,
whereas the “retina” section majorly focused on the fundus
images only. Lee et al. [10] introduced the AI development in
ophthalmology generally.Rahimy [11] focused on DL ap-
plications in the ophthalmology field,without the mention
about CML. Louis J. Catania and Ernst Nicolitz systemically
reviewed AI and robotic applications in multiple categories
of vision and eye care butmentioned little aboutAI di-
agnosis of retinaldiseases [12].
In this review, we systematically reviewed the application
of AI (both CML and DL)in diagnosing ocular diseases,
including the four leading cause of adult blindness diabetic
retinopathy (DR),glaucoma,age-related macular degenera-
tion (AMD), and cataract. We also introduced the existing AI
methods,the ophthalmic imaging modalities,detailed steps
for building AImodels,and evaluation metrics in AIdi-
agnosis. We hope we can provide both ophthalmologists and
computer scientists a meaningfuland comprehensive sum-
mary on AI applicationsin ophthalmology and facilitate
promising AI projects in the ophthalmology field.
2. AI Algorithms
As we mentioned above, ML is one subset of AI and includes
DL and CML (Figure 1(a)). The defining characteristic of ML
algorithms is the quality of predictions improved with ex-
perience [13].The more data we provide (usually up to
a platform), the better the prediction model we can achieve.
Supervised learning and unsupervised learning are two
forms of ML.Supervised learning is to train a model from
already labeled training data,tunes the weightings ofthe
inputs to improve the accuracy of its predictions until they
are optimized, and then map test data sets as corresponding
outputs. It may expedite classification process and would be
usefulfor discriminating clinicaloutcomes.Unsupervised
learning is to train a modelwith unlabeled data (without
a human-labeled process),infersa function to describe
hidden structuresthatusually invisible to humans,and
could bring new discoveries, such as new encephalic region
relevant to Alzheimer’s disease [14] and new impact factors
of cardiovascular diseases beyond human’s recognition [4].
So far,methods adopted in mostresearch studies are in
supervised form because the accuracy and efficacy are better
under supervised condition [15].
CML can get satisfactory outcome with small data sets, but
a cumbersome step to select specific visual features manually
prior to classification is indispensable [16]. This selection can
resultin a setof suboptimalfeatures and overfitting (the
trained model is not generalized to other data except for the
training set),which limits CML algorithms’application.
Existing CML algorithms used in AI diagnosis include
decision trees [17], random forests (RF) [18], support vector
machines (SVM)[19],Bayesian classifiers [20],k-nearest
neighbors [21],k-means [22],linear discriminant analysis
[23], and neural networks (NN) [24] (Table 1). Among them,
RF and SVM are the most commonly used CML technol-
ogies in the ophthalmology field [25] (Figures 1(b) and 1(c)).
DL, a burgeoning technology ofML, has the ability to
discover intricate structures in data sets without the need
specify rules explicitly. A DL network is an NN with multiple
layers between the input and output layers (Figure 1(d)). It
dramatically improved the state-of-the-art in image recogn
tion [15]. When applied to image classification, a key differ
between DL and CML algorithmsis how they selectand
process image features. Features of input data are automa
learned in an unsupervised way by DL algorithms,avoiding
manualsegmenting and depicting lesions’areas[15,26].
However,large data set is needed to train a DL algorithm.
Transfer learning is to retrain an algorithm, which has alrea
been pretrained on millionsof generalimagesbefore,on
a specific data set. This method allows the training of a hig
accurate model with a relatively small training data set [27
DL algorithms are known as “black boxes.” The network
generate comprehensive and discriminative features that a
much too high dimensionalto be accessible for human in-
terpretation.Little is known about how they analyze pattern
and make a decision at the image level[7].Heatmaps can
show which pixels play a role in the image-level prediction
the medical field, the visualization highlighted highly possi
abnormalregions in the input image for future review and
analysis,potentially aiding real-time clinicalvalidation of
automated diagnoses at the point of care. Existing method
DL include long-term and short-term memory [15],deep
Boltzmann machines [28],deep kernelmachines [29],deep
recurrentneuralnetworks[30],and convolutionalneural
networks(CNN) [15].Among them,the mostused DL
method in the medical image recognition field is CNN.The
CNN consists ofmultiple convolutionallayers thatextract
features and transform input images into hierarchical featu
maps:from simple features,such asedgesand lines,to
complicated features,such as shapes and colors.It also in-
cludes layers that can merge semantically similar features
one to reduce the dimensionality of the extracted features
layers thatcan combine these features and outputa final
probability value for the class.Existing CNN architectures
used in the medical image recognition field include AlexNe
[31], VGG [32], ResNet [33], and GoogleNet [34–37](Table
3. Building AI Models
Various imaging modalities have been used in AI diagnosis
such as radiology images (X-ray,CT, and MRI) [38],elec-
trophysiologicalsignalrecords (electrocardiograph [39] and
electroencephalogram [40]),visible wavelength images (der-
moscopy images and biopsy images [3]),ultrasound images
[41],angiography images [42],and so on.We introduce the
ophthalmic imaging modalities in AI diagnosis in Table 3.
The stepsfor buildingan AI model includepre-
processing image data, train, validate and test the model,
evaluate the trained model’s performance.
3.1.Data Preprocessing.In order to increase AI prediction
efficiency, raw data need to be preprocessed. The preproc
work includes the following [8, 43]: (1) noise reduction: no
reduction needs to be performed in almost allrelevant re-
search.Denoising can promote the quality ofdata setand
2 Journal of Ophthalmology
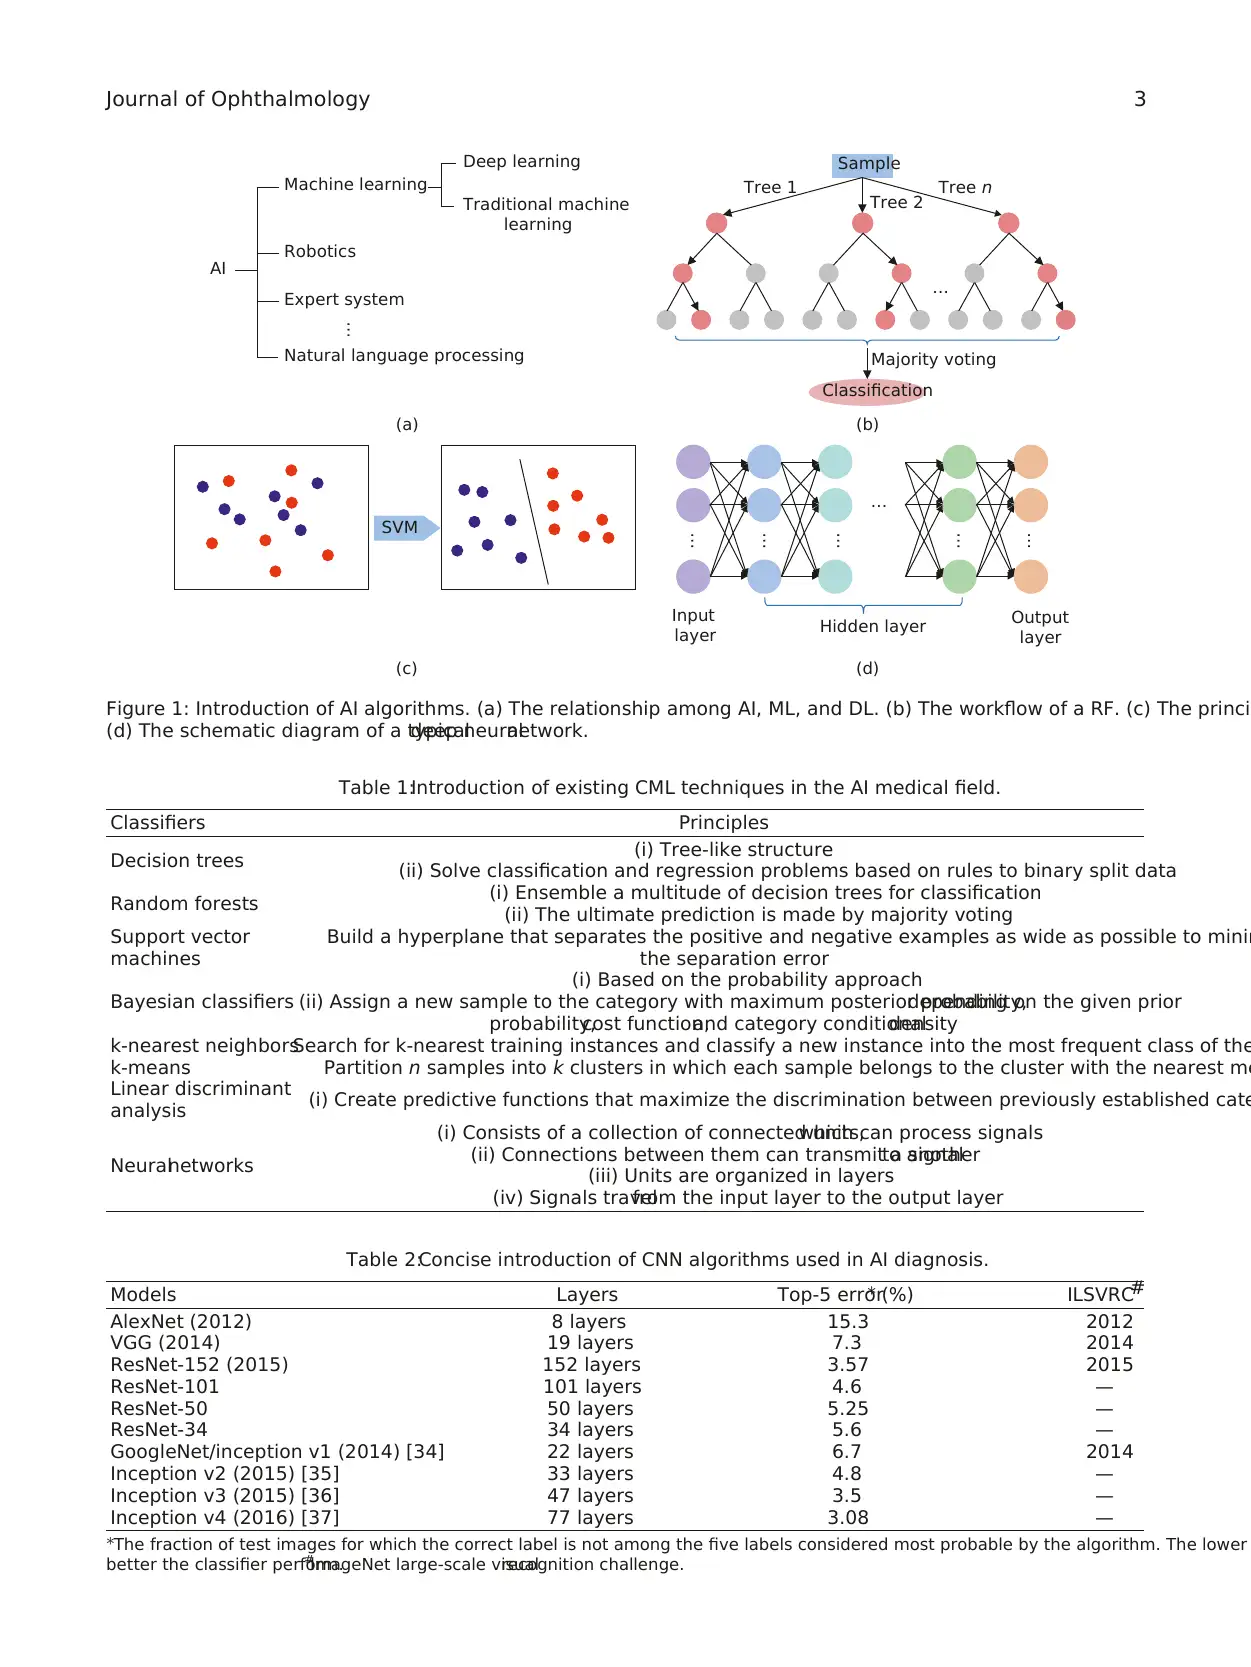
Table 1:Introduction of existing CML techniques in the AI medical field.
Classifiers Principles
Decision trees (i) Tree-like structure
(ii) Solve classification and regression problems based on rules to binary split data
Random forests (i) Ensemble a multitude of decision trees for classification
(ii) The ultimate prediction is made by majority voting
Support vector
machines
Build a hyperplane that separates the positive and negative examples as wide as possible to minim
the separation error
Bayesian classifiers
(i) Based on the probability approach
(ii) Assign a new sample to the category with maximum posterior probability,depending on the given prior
probability,cost function,and category conditionaldensity
k-nearest neighborsSearch for k-nearest training instances and classify a new instance into the most frequent class of the
k-means Partition n samples into k clusters in which each sample belongs to the cluster with the nearest me
Linear discriminant
analysis (i) Create predictive functions that maximize the discrimination between previously established cate
Neuralnetworks
(i) Consists of a collection of connected units,which can process signals
(ii) Connections between them can transmit a signalto another
(iii) Units are organized in layers
(iv) Signals travelfrom the input layer to the output layer
Machine learning
Deep learning
Traditional machine
learning
Expert system
Robotics
AI
Natural language processing
…
(a)
Tree 1 Tree n
Tree 2
Sample
Majority voting
Classification
…
(b)
SVM
(c)
Input
layer
Output
layer
Hidden layer
…
…
…
…
…
…
(d)
Figure 1: Introduction of AI algorithms. (a) The relationship among AI, ML, and DL. (b) The workflow of a RF. (c) The princi
(d) The schematic diagram of a typicaldeep neuralnetwork.
Table 2:Concise introduction of CNN algorithms used in AI diagnosis.
Models Layers Top-5 error∗ (%) ILSVRC#
AlexNet (2012) 8 layers 15.3 2012
VGG (2014) 19 layers 7.3 2014
ResNet-152 (2015) 152 layers 3.57 2015
ResNet-101 101 layers 4.6 —
ResNet-50 50 layers 5.25 —
ResNet-34 34 layers 5.6 —
GoogleNet/inception v1 (2014) [34] 22 layers 6.7 2014
Inception v2 (2015) [35] 33 layers 4.8 —
Inception v3 (2015) [36] 47 layers 3.5 —
Inception v4 (2016) [37] 77 layers 3.08 —
∗The fraction of test images for which the correct label is not among the five labels considered most probable by the algorithm. The lower
better the classifier perform.#
ImageNet large-scale visualrecognition challenge.
Journal of Ophthalmology 3
⊘ This is a preview!⊘
Do you want full access?
Subscribe today to unlock all pages.
Trusted by 1+ million students worldwide
optimize learning process.(2) Data integration and normal-
ization:data collected from different sources should be in-
tegrated and adjusted to a common scale. (3) Feature selection
and extraction: the most relevant features are usually selected
and extracted to improve the learning process performance.
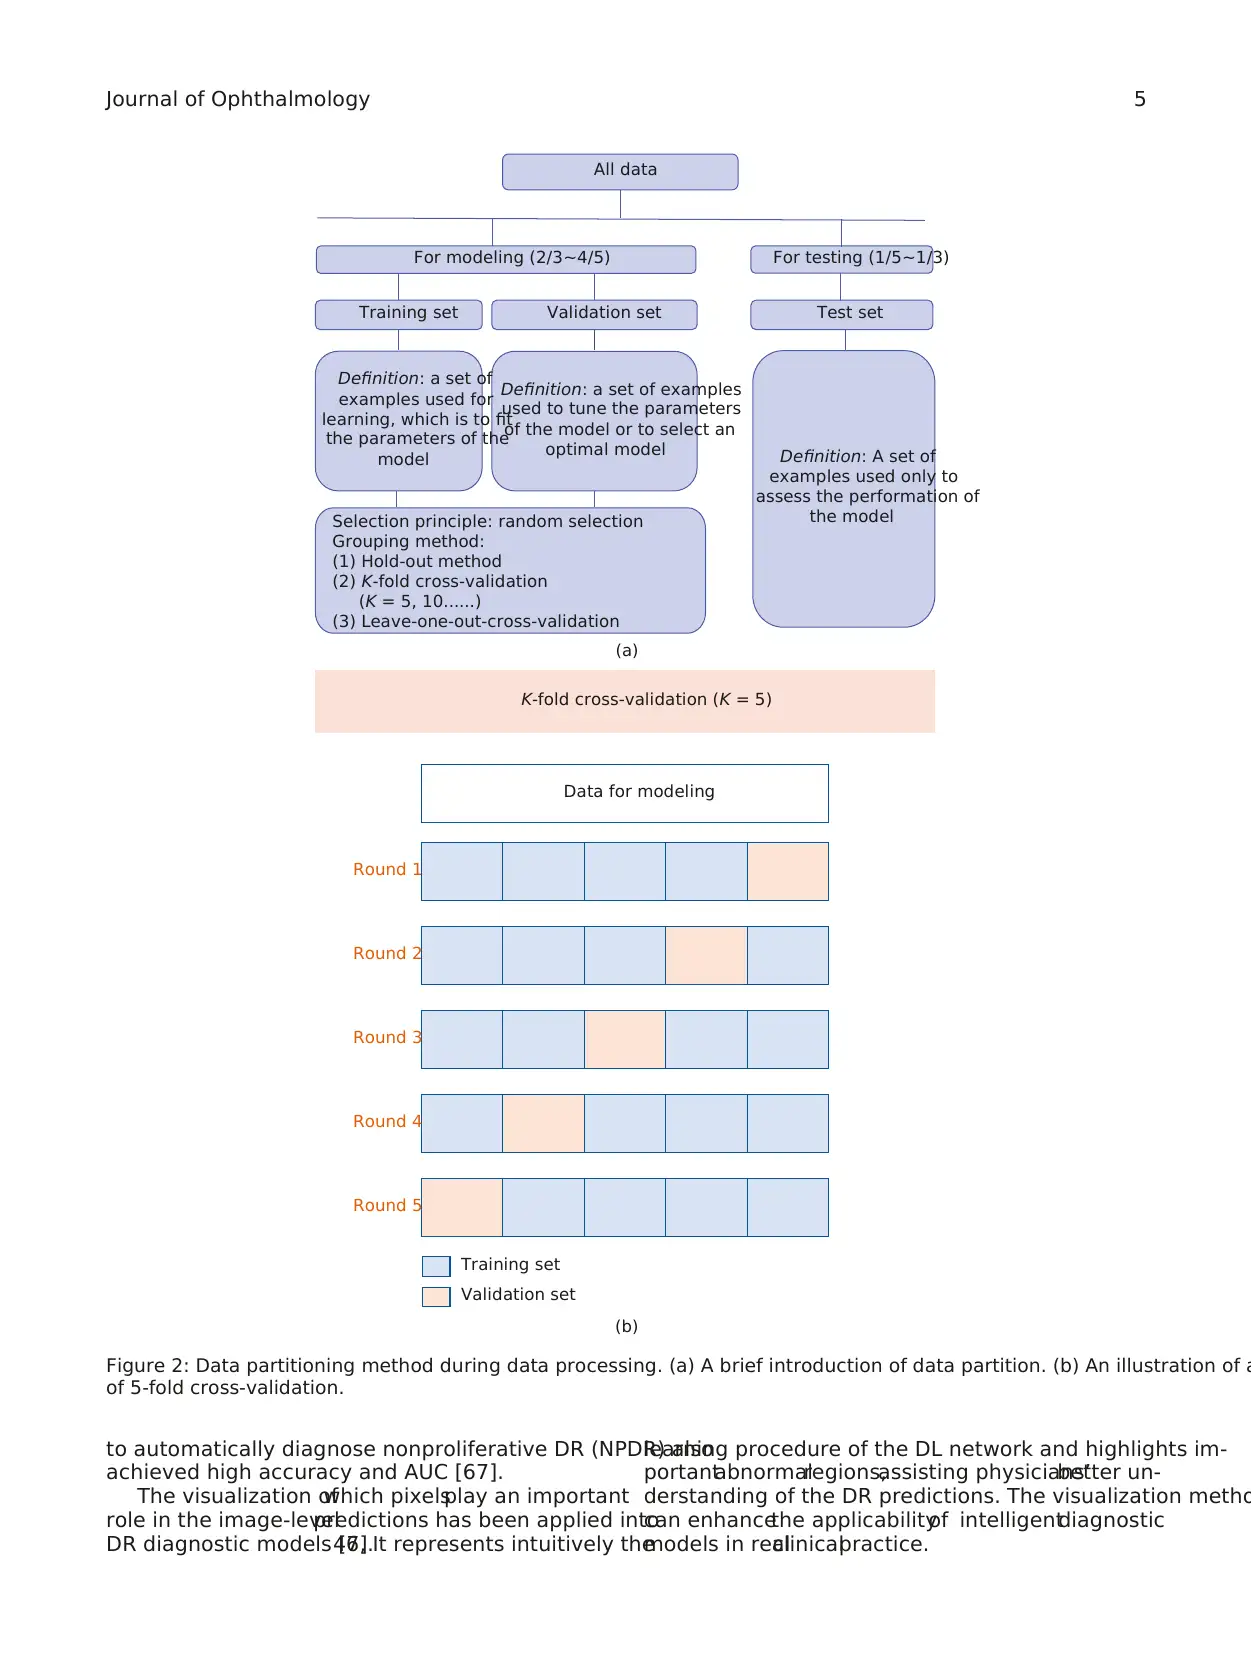
3.2. Training, Validation, and Test.To achieve a good per-
formance,the data setis randomly partitioned into two
independent subsets, one is for modeling and the other is for
testing. The data in the former sets will be partitioned again
into training setand validation setin most cases.The
training setis used to fitthe parameters ofa model.The
validation set is used to estimate how wellthe modelhad
been trained and tune the parameters or to compare the
performances of the prediction algorithms achieved based
on the training set.The test set is used to evaluate the final
performance of the trained model(Figure 2(a)).
Cross-validation methods have been widely used to esti-
mate and optimize algorithms [44]. The most adopted cross-
validation is “K-fold cross-validation.” It is an effective method
to avoid overfitting and underfitting.All data are equally
divided into K subsets, 1 for validation and K−1 for training.
This process will repeat K times, and average metrics are used
to evaluate the trained model(Figure 2(b)).Fivefold cross-
validation and 10-fold cross-validation are most commonly
used [44].
3.3. Evaluation.Receiveroperatingcharacteristiccurve
(ROC) is a useful tool to depict algorithms’ performance. It is
created by plotting the detection probability for each algo-
rithm across a continuum of threshold.For each threshold,
the sensitivity and the false positive rate (1− specificity) are
plotted against each other. The area under receiver operating
characteristiccurves(AUC) is the mostused evaluation
metricsfor quantitative assessmentof a modelin AI di-
agnosis. The AUCs of effective models range from 0.5 to 1; the
higher the value of AUC,the better the performance of the
model [45]. Table 4 provides introduction of other metrics to
evaluate the performance of a model.
4. AI Application in Ophthalmology
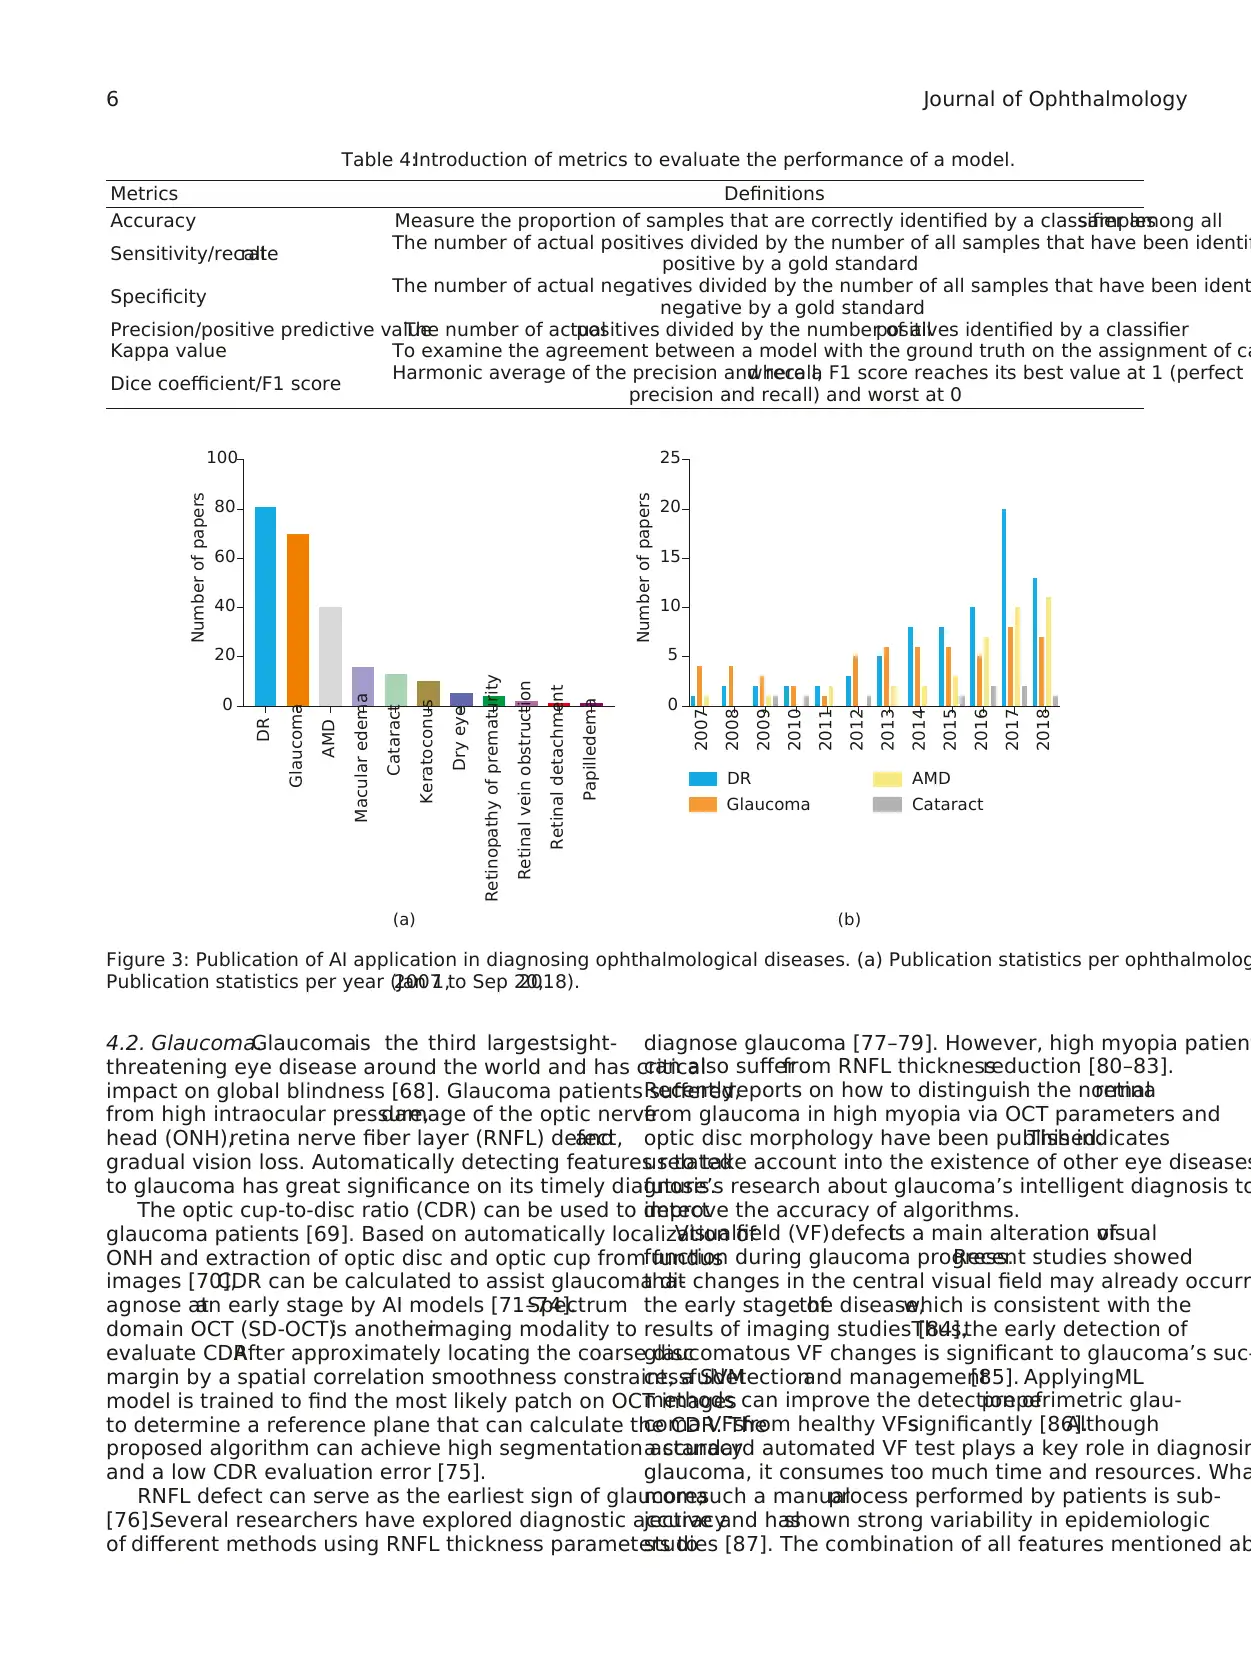
Two hundred forty-three articles ofAI application in di-
agnosing ophthalmologicaldiseaseshave been published
(search by PubMed,Sep 20,2018).Among them,the most
intensively studied are DR,glaucoma,AMD, and cataract
(Figure 3(a)). Figure 3(b) shows the breakdown of the pape
of these four diseases in year of publication.
4.1.Diabetic Retinopathy.Diabetes affects more than 415
million people worldwide,meaning 1 in every 11 adults is
affected [46].DR, a chronicdiabeticcomplication,is
a vasculopathy that affects one-third of diabetic patients a
can lead to irreversible blindness[47].Automated tech-
niques for DR diagnosis have been explored to improve the
management of patients with DR and alleviate social burde
AI was used to predict DR risk and DR progression among
diabetic patientsto combatwith thisworldwide disease
[48,49].
The specificabnormalitiessuch as macularedema
[50–53],exudates [53],cotton-wool[54],microaneurysms
[55,56],and neovascularization on optic disk [57] can be
detected by CML.Based on these hallmarks,the early di-
agnose of DR in an automated fashion has been explored
[58]. Additionally, a system focused on timely and effective
proliferative DR (PDR)detection hasbeen developed to
ensure immediate attention and intervention [59,60].
Gulshan et al. were the first to report the application of
DL for DR identification [6]. They used large fundus image
data sets to train a deep CNN (DCNN)in a supervised
manner.They showed that the method based on DL tech-
niques had very high sensitivity and specificity, and the AU
came up to 0.99 for detecting referable DR [61]. In the pas
two years,a number ofDL models with impressive per-
formance have been developed for the automated detectio
of DR [46, 62, 63]. Additionally, some studies applied DL to
automatically stage DR through fundusimages[62–65],
making up the deficiency of Gulshan’s study that they only
detected referable DR but did not provide comparable data
on sight-threatening DR or other DR stages.
The majority of aforementioned studies focused mainly
on the analysis of fundus photographs. There were some o
imaging modalities used to build models for DR.ElTanboly
et al. developed a DL-based computer-aided system to det
DR through 52 optical coherence tomography (OCT) image
achieving an AUC of 0.98 [66]. Despite the good outcomes
the cross-validation process,the system needs to be further
validated in largerpatientcohorts.A computer-aided di-
agnostic (CAD)system based on CML algorithmsusing
optical coherence tomography angiography (OCTA) image
Table 3:The ophthalmic imaging modalities in AI diagnosis.
Imaging modalities Image features Applications
Fundus image Show a magnified and subtle view of the surface of the
retina Retinal diseases diagnose
Opticalcoherence
tomography
Show micrometer-resolution,cross-sectionalimages
of the retina Retinal diseases diagnose
Ocular ultrasound B-scan
Show a rough cross-sectional view of the eye and the
orbit
Evaluate the condition of lens,vitreous,
retina,and tumor
Slit-lamp image Provides a stereoscopic magnified view of the anterior
segment in detail Anterior segment diseases diagnose
Visualfield Show the size and shape of field-of-view To find disorders of the visualsignalprocessing
system that includes the retina, optic nerve, and brain
4 Journal of Ophthalmology
ization:data collected from different sources should be in-
tegrated and adjusted to a common scale. (3) Feature selection
and extraction: the most relevant features are usually selected
and extracted to improve the learning process performance.
3.2. Training, Validation, and Test.To achieve a good per-
formance,the data setis randomly partitioned into two
independent subsets, one is for modeling and the other is for
testing. The data in the former sets will be partitioned again
into training setand validation setin most cases.The
training setis used to fitthe parameters ofa model.The
validation set is used to estimate how wellthe modelhad
been trained and tune the parameters or to compare the
performances of the prediction algorithms achieved based
on the training set.The test set is used to evaluate the final
performance of the trained model(Figure 2(a)).
Cross-validation methods have been widely used to esti-
mate and optimize algorithms [44]. The most adopted cross-
validation is “K-fold cross-validation.” It is an effective method
to avoid overfitting and underfitting.All data are equally
divided into K subsets, 1 for validation and K−1 for training.
This process will repeat K times, and average metrics are used
to evaluate the trained model(Figure 2(b)).Fivefold cross-
validation and 10-fold cross-validation are most commonly
used [44].
3.3. Evaluation.Receiveroperatingcharacteristiccurve
(ROC) is a useful tool to depict algorithms’ performance. It is
created by plotting the detection probability for each algo-
rithm across a continuum of threshold.For each threshold,
the sensitivity and the false positive rate (1− specificity) are
plotted against each other. The area under receiver operating
characteristiccurves(AUC) is the mostused evaluation
metricsfor quantitative assessmentof a modelin AI di-
agnosis. The AUCs of effective models range from 0.5 to 1; the
higher the value of AUC,the better the performance of the
model [45]. Table 4 provides introduction of other metrics to
evaluate the performance of a model.
4. AI Application in Ophthalmology
Two hundred forty-three articles ofAI application in di-
agnosing ophthalmologicaldiseaseshave been published
(search by PubMed,Sep 20,2018).Among them,the most
intensively studied are DR,glaucoma,AMD, and cataract
(Figure 3(a)). Figure 3(b) shows the breakdown of the pape
of these four diseases in year of publication.
4.1.Diabetic Retinopathy.Diabetes affects more than 415
million people worldwide,meaning 1 in every 11 adults is
affected [46].DR, a chronicdiabeticcomplication,is
a vasculopathy that affects one-third of diabetic patients a
can lead to irreversible blindness[47].Automated tech-
niques for DR diagnosis have been explored to improve the
management of patients with DR and alleviate social burde
AI was used to predict DR risk and DR progression among
diabetic patientsto combatwith thisworldwide disease
[48,49].
The specificabnormalitiessuch as macularedema
[50–53],exudates [53],cotton-wool[54],microaneurysms
[55,56],and neovascularization on optic disk [57] can be
detected by CML.Based on these hallmarks,the early di-
agnose of DR in an automated fashion has been explored
[58]. Additionally, a system focused on timely and effective
proliferative DR (PDR)detection hasbeen developed to
ensure immediate attention and intervention [59,60].
Gulshan et al. were the first to report the application of
DL for DR identification [6]. They used large fundus image
data sets to train a deep CNN (DCNN)in a supervised
manner.They showed that the method based on DL tech-
niques had very high sensitivity and specificity, and the AU
came up to 0.99 for detecting referable DR [61]. In the pas
two years,a number ofDL models with impressive per-
formance have been developed for the automated detectio
of DR [46, 62, 63]. Additionally, some studies applied DL to
automatically stage DR through fundusimages[62–65],
making up the deficiency of Gulshan’s study that they only
detected referable DR but did not provide comparable data
on sight-threatening DR or other DR stages.
The majority of aforementioned studies focused mainly
on the analysis of fundus photographs. There were some o
imaging modalities used to build models for DR.ElTanboly
et al. developed a DL-based computer-aided system to det
DR through 52 optical coherence tomography (OCT) image
achieving an AUC of 0.98 [66]. Despite the good outcomes
the cross-validation process,the system needs to be further
validated in largerpatientcohorts.A computer-aided di-
agnostic (CAD)system based on CML algorithmsusing
optical coherence tomography angiography (OCTA) image
Table 3:The ophthalmic imaging modalities in AI diagnosis.
Imaging modalities Image features Applications
Fundus image Show a magnified and subtle view of the surface of the
retina Retinal diseases diagnose
Opticalcoherence
tomography
Show micrometer-resolution,cross-sectionalimages
of the retina Retinal diseases diagnose
Ocular ultrasound B-scan
Show a rough cross-sectional view of the eye and the
orbit
Evaluate the condition of lens,vitreous,
retina,and tumor
Slit-lamp image Provides a stereoscopic magnified view of the anterior
segment in detail Anterior segment diseases diagnose
Visualfield Show the size and shape of field-of-view To find disorders of the visualsignalprocessing
system that includes the retina, optic nerve, and brain
4 Journal of Ophthalmology
Paraphrase This Document
Need a fresh take? Get an instant paraphrase of this document with our AI Paraphraser
to automatically diagnose nonproliferative DR (NPDR) also
achieved high accuracy and AUC [67].
The visualization ofwhich pixelsplay an important
role in the image-levelpredictions has been applied into
DR diagnostic models [7,46].It represents intuitively the
learning procedure of the DL network and highlights im-
portantabnormalregions,assisting physicians’better un-
derstanding of the DR predictions. The visualization metho
can enhancethe applicabilityof intelligentdiagnostic
models in realclinicalpractice.
Definition: a set of
examples used for
learning, which is to fit
the parameters of the
model
All data
For modeling (2/3~4/5) For testing (1/5~1/3)
Test setTraining set Validation set
Definition: a set of examples
used to tune the parameters
of the model or to select an
optimal model Definition: A set of
examples used only to
assess the performation of
the modelSelection principle: random selection
Grouping method:
(1) Hold-out method
(2) K-fold cross-validation
(K = 5, 10......)
(3) Leave-one-out-cross-validation
(a)
K-fold cross-validation (K = 5)
Data for modeling
Round 1
Round 2
Round 3
Round 4
Round 5
Training set
Validation set
(b)
Figure 2: Data partitioning method during data processing. (a) A brief introduction of data partition. (b) An illustration of a
of 5-fold cross-validation.
Journal of Ophthalmology 5
4.2. Glaucoma.Glaucomais the third largestsight-
threatening eye disease around the world and has critical
impact on global blindness [68]. Glaucoma patients suffered
from high intraocular pressure,damage of the optic nerve
head (ONH),retina nerve fiber layer (RNFL) defect,and
gradual vision loss. Automatically detecting features related
to glaucoma has great significance on its timely diagnosis.
The optic cup-to-disc ratio (CDR) can be used to detect
glaucoma patients [69]. Based on automatically localization of
ONH and extraction of optic disc and optic cup from fundus
images [70],CDR can be calculated to assist glaucoma di-
agnose atan early stage by AI models [71–74].Spectrum
domain OCT (SD-OCT)is anotherimaging modality to
evaluate CDR.After approximately locating the coarse disc
margin by a spatial correlation smoothness constraint, a SVM
model is trained to find the most likely patch on OCT images
to determine a reference plane that can calculate the CDR. The
proposed algorithm can achieve high segmentation accuracy
and a low CDR evaluation error [75].
RNFL defect can serve as the earliest sign of glaucoma
[76].Several researchers have explored diagnostic accuracy
of different methods using RNFL thickness parameters to
diagnose glaucoma [77–79]. However, high myopia patien
can also sufferfrom RNFL thicknessreduction [80–83].
Recently,reports on how to distinguish the normalretina
from glaucoma in high myopia via OCT parameters and
optic disc morphology have been published.This indicates
us to take account into the existence of other eye diseases
future’s research about glaucoma’s intelligent diagnosis to
improve the accuracy of algorithms.
Visualfield (VF)defectis a main alteration ofvisual
function during glaucoma progress.Recent studies showed
that changes in the central visual field may already occurr
the early stage ofthe disease,which is consistent with the
results of imaging studies [84].Thus,the early detection of
glaucomatous VF changes is significant to glaucoma’s suc-
cessfuldetectionand management[85]. ApplyingML
methods can improve the detection ofpreperimetric glau-
coma VFsfrom healthy VFssignificantly [86].Although
a standard automated VF test plays a key role in diagnosin
glaucoma, it consumes too much time and resources. Wha
more,such a manualprocess performed by patients is sub-
jective and hasshown strong variability in epidemiologic
studies [87]. The combination of all features mentioned ab
Table 4:Introduction of metrics to evaluate the performance of a model.
Metrics Definitions
Accuracy Measure the proportion of samples that are correctly identified by a classifier among allsamples
Sensitivity/recallrate The number of actual positives divided by the number of all samples that have been identifi
positive by a gold standard
Specificity The number of actual negatives divided by the number of all samples that have been ident
negative by a gold standard
Precision/positive predictive valueThe number of actualpositives divided by the number of allpositives identified by a classifier
Kappa value To examine the agreement between a model with the ground truth on the assignment of ca
Dice coefficient/F1 score Harmonic average of the precision and recall,where a F1 score reaches its best value at 1 (perfect
precision and recall) and worst at 0
0
DR
Glaucoma
AMD
Macular edema
Cataract
Keratoconus
Dry eye
Retinopathy of prematurity
Retinal vein obstruction
Retinal detachment
Papilledema
20
40
60
80
Number of papers
100
(a)
Number of papers
0
2007
DR
Glaucoma
AMD
Cataract
2008
2009
2010
2011
2012
2013
2014
2015
2016
2017
2018
5
10
15
20
25
(b)
Figure 3: Publication of AI application in diagnosing ophthalmological diseases. (a) Publication statistics per ophthalmolog
Publication statistics per year (Jan 1,2007 to Sep 20,2018).
6 Journal of Ophthalmology
⊘ This is a preview!⊘
Do you want full access?
Subscribe today to unlock all pages.
Trusted by 1+ million students worldwide
is required for the accurate intelligent diagnosis, for any of the
single symptom is not the guarantee sign of glaucoma [83, 88].
This kind of research shows great performance in classifying
glaucoma and healthy eyes.Clinicians may reference these
prediction results and make better decisions.
Studies using DL methods to diagnose glaucoma are few.
So far,fundus images [73,89,90],VFs [91],and wide-field
OCT scans [92] have allbeen used to construct DL-based
glaucomatous diagnostic models.Preperimetric open-angle
glaucoma (OAG)eyes can be detected through DL with
better performance than those gotfrom CML techniques
[91].Holistic and localfeatures ofoptic disc on fundus
images have been used together to mitigate the influence of
misalignmentwhen located optic disc forglaucoma di-
agnosis [89]. The AUC was 0.8384, which is quite close to the
manual detection results. Li et al. demonstrated that DL can
be applied to identify referable glaucomatous optic neu-
ropathy with high sensitivity and specificity [90].
4.3. Age-Related Macular Degeneration.AMD is the leading
cause ofirreversible blindnessamong old people in the
developed world [93]. The goal of using ML algorithms is to
automaticallyidentifyAMD-related lesionsto improve
AMD diagnosis and treatment. Detection of drusen [93, 94],
fluid [94,95],reticular pseudodrusen [96],and geographic
atrophy [97] from fundus images and SD-OCT using ML
[96]has been studied.The accuracy is usually over 80%
[93,96–98],and the agreementbetween the models and
retina specialists can reach 90%.
Drusen regression,an anatomicendpointof in-
termediate AMD and the onset of advanced AMD,can be
predicted through the specifically designed, fully automated,
ML-based classifier.Bogunovic et al.develop a data-driven
interpretable predictive modelto predictthe progression
risk in intermediate AMD [94].Automated image analysis
steps were applied to identify and characterize individual
drusen at baseline, and their development was monitored at
everyfollow-up visit.Using such characterization and
analysis,they developed an ML method based on survival
analysis to estimate a risk score and predict the incoming
regression of individual drusen. Above all, these automated
detectionsof the retinal lesionscombinedwith in-
terpretation ofdisease activity are feasible and have the
potential to become a powerful tool in clinical practice [95].
Using ML to predictanti-vascular endothelialgrowth
factor (anti-VEGF) injection requirements in eye diseases
such as neovascular AMD and PDR can alleviate patients’
economicburden andfacilitateresourcemanagement.
Bogunovic et al. fed corresponding OCT images of patients
with low or high anti-VEGF injection requirements into RF
to obtain a predictive model. A solid AUC of 70% to 80% was
achieved for treatment requirement prediction [99].Prahs
et al.trained a DCNN neuralnetwork by OCT images to
facilitate decision-making regarding anti-VEGF injection
[100], and the outcomes were better than that of using CML
[99].These studies are an importantstep toward image-
guided prediction of treatment intervals in the management
of neovascular AMD or PDR.
Multiple CML techniques have been applied for auto-
mated diagnosis and grading of AMD [101,102].But the
most impressive work was based on DL techniques over th
past2 years [103–105].Treder etal. establish a modelto
automatically detect exudative AMD from SD-OCT [105]. In
research studies based on fundus images, images with AM
were assigned into 4 classes of classification (no evidence
AMD, early-stageAMD, intermediate-stageAMD, and
advanced AMD) [104], or 2-class classification (no or early-
stage AMD and intermediate or advanced stage AMD) [103
The diagnostic accuracy is better in the 2-class classificatio
in current studies.The DCNN appears to perform
a screening function in these experiments,and the perfor-
mance is comparable with physicians.DL algorithms have
also been used to automatically detect abnormalities such
exudates [106],macular edema [51,52],drusen,and cho-
roidalneovascularization [27].
4.4. Cataract.Cataract is a disease with cloudy lens and has
bothered millions of old people. Early detection and treatm
can bring the light to cataract patients and improve their l
quality. ML algorithms such as RF and SVM have been app
to diagnose and grading cataractfrom fundus images,ul-
trasounds images,and visible wavelength eye images [107–
109].The risk prediction model for posterior capsule opaci-
fication after phacoemulsification has also been built [110]
Researchers can now use DL models to diagnose senile
cataract[111],but a more impressive work is aboutthe
pediatric cataract.It is one of the primary causes of child-
hood blindness [112]. Long et al. constructed a CNN-based
computer-aided diagnosis (CAD) framework to classify and
gradepediatriccataract.What is more,a cloud-based
platform integrated the AI agent for multihospitalcollab-
oration has been established. They even developed a softw
to realize clinicalapplication for ophthalmologists and pa-
tients and have applied it in Zhong Shan Ophthalmic Cente
[113,114].These proposed methodsare serviceable for
improving clinicalworkflow ofcataract’s diagnosis in the
background of large-population screening and mainly shed
a light on other ocular images.
In addition to DR, glaucoma, AMD, and cataract, AI has
also been used to diagnose other eye diseases. AI algorithm
can be used to detectkeratoconusor identify eyeswith
preclinical signs of keratoconus using data from a Scheimp
flug camera [115, 116], to evaluate corneal power after my
cornealrefractive surgery [117],to make surgicalplans for
horizontal strabismus [118], and to detect pigment epithel
detachment in polypoidal choroidal vasculopathy [119].
Previousstudieshave summarized articlesaboutthe
application of CML techniques in eye diseases [8].In this
review, we summarized studies on glaucoma, DR, AMD, an
cataract using DL techniques in Table 5.
5. Future of AI Application in Clinic
In recent years,AI techniques have shown to be an effective
diagnostic toolto identify various diseases in healthcare.Ap-
plicationsof AI can make greatcontributionsto provide
Journal of Ophthalmology 7
Paraphrase This Document
Need a fresh take? Get an instant paraphrase of this document with our AI Paraphraser
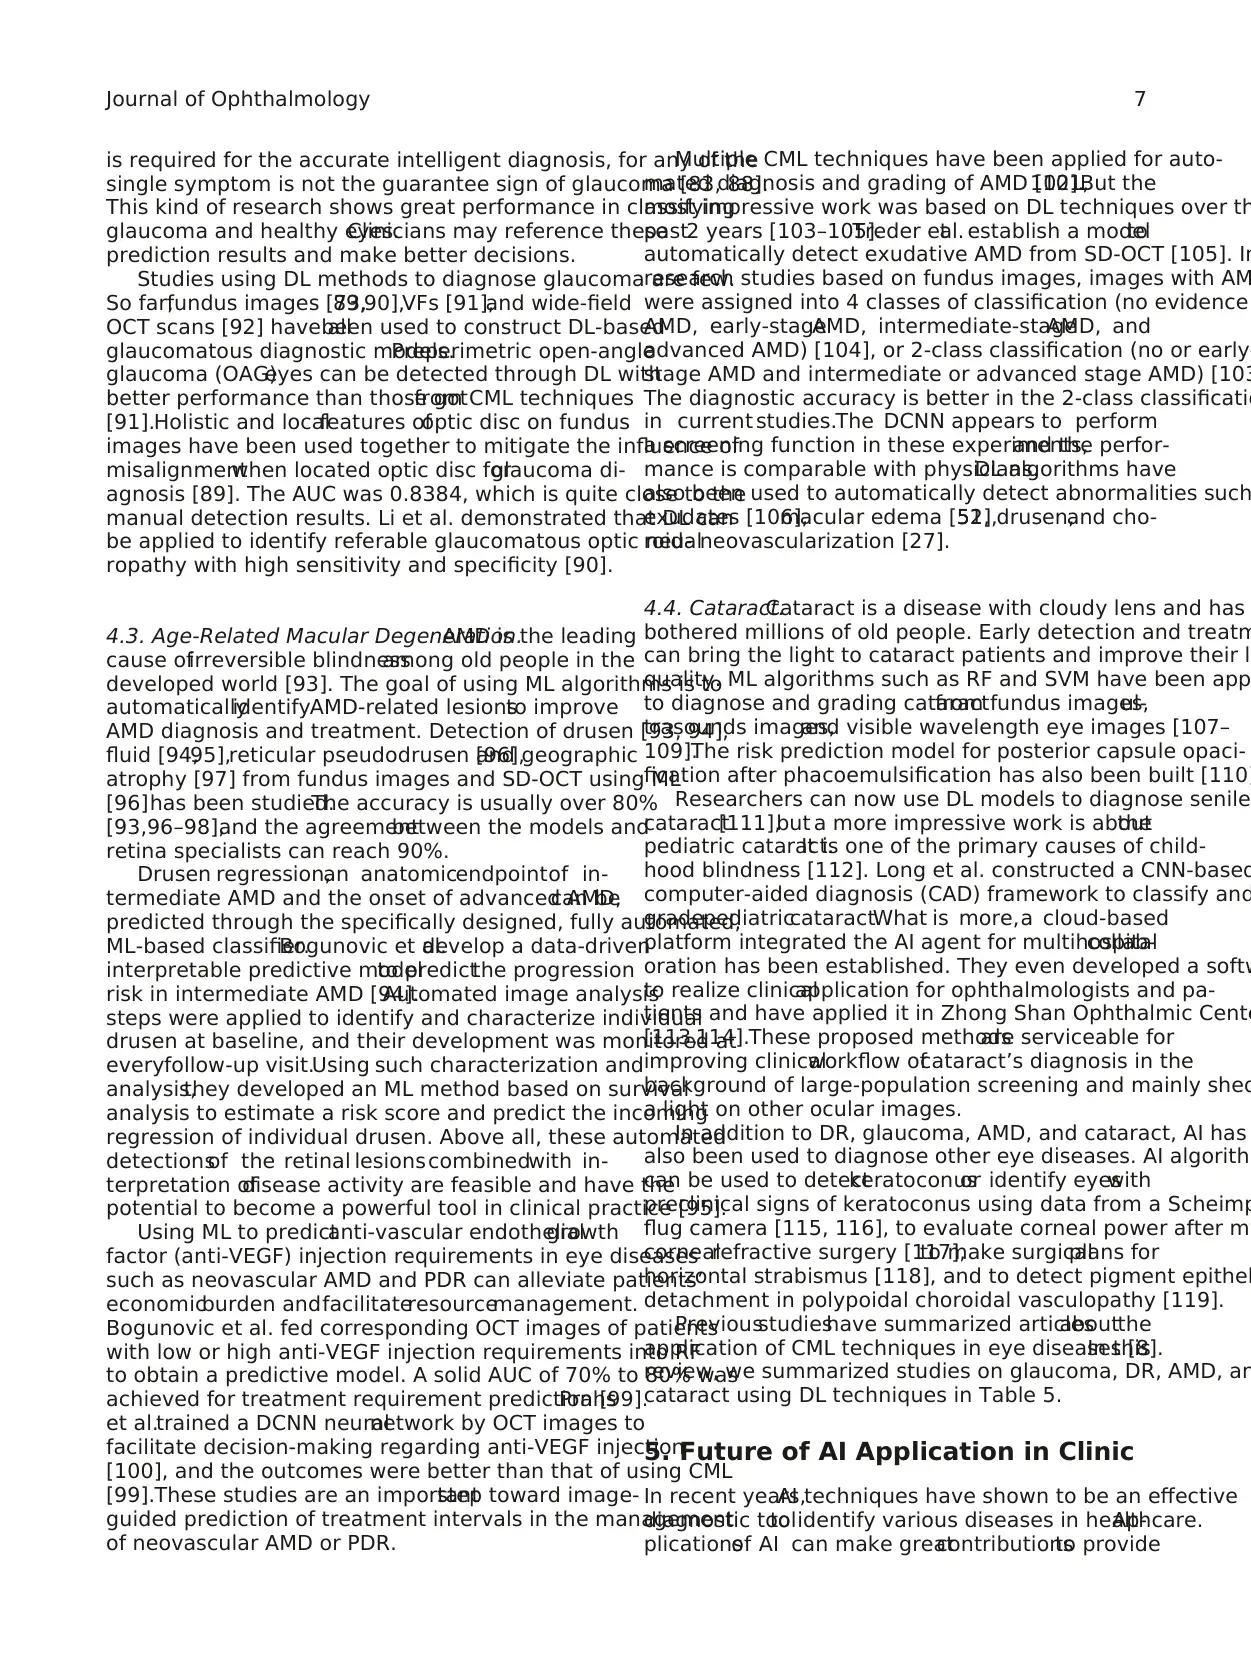
Table 5:Studies on eye diseases using DL techniques.
Groups Aim Data sets Deep learning
techniques Performance Conclusions
Gulshan et al.[6] (Google
Inc.) DR detection
Public:
EyePACS,Messidor 128175
fundus images
DCNN
AUC
0.991 for EyePACS
0.990 for Messidor
The DCNN had high sensitivity and specificity for
detecting referable DR (moderate and worse DR,
referable diabetic macular edema,or both)
Gargeya and Leng [46] (Byers
Eye Institute at Stanford) DR detection
Public:
EyePACS,Messidor,E-
ophtha 77348 fundus images
DCNN
AUC
0.94 for Messidor data set
0.95 for E-ophtha data set
The DCNN can be used to screen fundus images to
identify DR with high reliability
Quellec et al.[7] (Brest
University)
DR detection
heatmaps
creation
Public:
Kaggle,DiaretDB,E-ophtha
196590 fundus images
CNN AUC � 0.954 in Kaggle’s data set
AUC � 0.949 in E-ophtha data set
The proposed method is a promising image
mining tool to discover new biomarkers in images.
The modeltrained to detect referable DR can
detect some lesions and outperforms recent
algorithms trained to detect those lesions
specifically
Ardiyanto et al.[63]
(Universitas Gadjah Mada)DR grading Public:
FINDeRS 315 fundus imagesCNN
Detection
Accuracy:95.71%
Sensitivity:76.92%
Specificity: 100%
Grading
Accuracy:60.28%
Sensitivity:65.40%
Specificity:73.37%
The network needs more data to train.And,this
work opens up the future possibility to establish
an integrated DR system to grade the severity at
a low cost
ElTanboly et al.[66]
(Mansoura University) DR detection Local:
52 SD-OCT scans DFCN
AUC: 0.98
Accuracy:92%
Sensitivity:83%
Specificity: 100%
The proposed CAD system for early DR detection
using the OCT retinalimages has good outcome
and outperforms than other 4 conventional
classifiers
Prahs et al. [100] (Department
of Ophthalmology, University
of Regensburg)
Give an
indication
of the
treatment of
anti-VEGF
injection
Local:
183,402 OCT B-scans
DCNN
(GoogLeNet)
AUC: 0.968
Accuracy:95.5%
Sensitivity:90.1%
Specificity:96.2%
The DCNN neuralnetworks are effective in
assessing OCT scans with regard to treatment
indication with anti-VEGF medications
Abr`amoff et al.[62]
(University of Iowa Hospitals
and Clinics)
DR detection Public:
Messidor 1748 fundus images
CNN
Referable DR:
AUC: 0.980
Sensitivity:96.8%
Specificity:87%
Vision threatening DR:
AUC: 0.989
Sensitivity: 100%
Specificity:90.8%
The DL enhanced algorithms have the potential to
improve the efficiency of DR screening
8 Journal of Ophthalmology
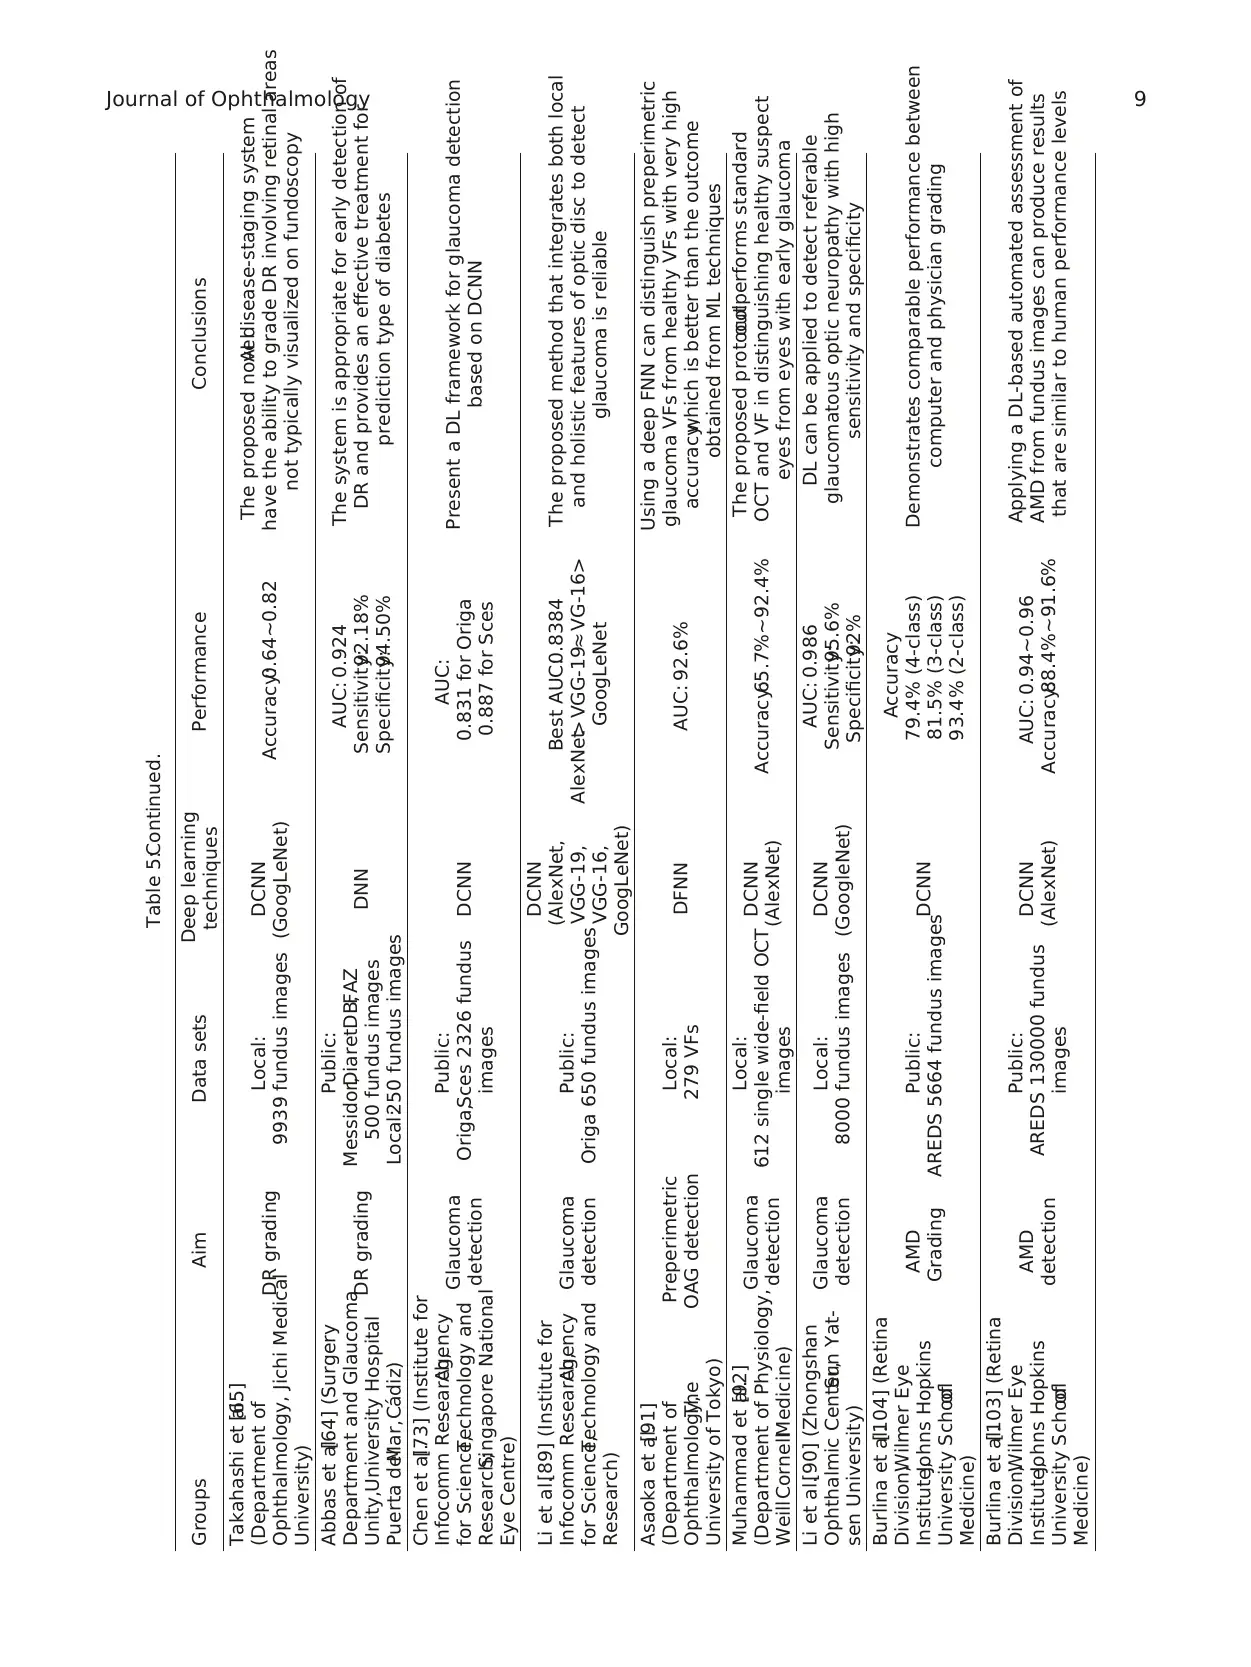
Table 5:Continued.
Groups Aim Data sets Deep learning
techniques Performance Conclusions
Takahashi et al.[65]
(Department of
Ophthalmology, Jichi Medical
University)
DR grading Local:
9939 fundus images
DCNN
(GoogLeNet) Accuracy:0.64∼0.82
The proposed novelAI disease-staging system
have the ability to grade DR involving retinal areas
not typically visualized on fundoscopy
Abbas et al.[64] (Surgery
Department and Glaucoma
Unity,University Hospital
Puerta delMar,C´adiz)
DR grading
Public:
Messidor,DiaretDB,FAZ
500 fundus images
Local:250 fundus images
DNN
AUC: 0.924
Sensitivity:92.18%
Specificity:94.50%
The system is appropriate for early detection of
DR and provides an effective treatment for
prediction type of diabetes
Chen et al.[73] (Institute for
Infocomm Research,Agency
for Science,Technology and
Research;Singapore National
Eye Centre)
Glaucoma
detection
Public:
Origa,Sces 2326 fundus
images
DCNN
AUC:
0.831 for Origa
0.887 for Sces
Present a DL framework for glaucoma detection
based on DCNN
Li et al.[89] (Institute for
Infocomm Research,Agency
for Science,Technology and
Research)
Glaucoma
detection
Public:
Origa 650 fundus images
DCNN
(AlexNet,
VGG-19,
VGG-16,
GoogLeNet)
Best AUC:0.8384
AlexNet> VGG-19≈ VG-16>
GoogLeNet
The proposed method that integrates both local
and holistic features of optic disc to detect
glaucoma is reliable
Asaoka et al.[91]
(Department of
Ophthalmology,The
University of Tokyo)
Preperimetric
OAG detection
Local:
279 VFs DFNN AUC: 92.6%
Using a deep FNN can distinguish preperimetric
glaucoma VFs from healthy VFs with very high
accuracy,which is better than the outcome
obtained from ML techniques
Muhammad et al.[92]
(Department of Physiology,
WeillCornellMedicine)
Glaucoma
detection
Local:
612 single wide-field OCT
images
DCNN
(AlexNet) Accuracy:65.7%∼92.4%
The proposed protocoloutperforms standard
OCT and VF in distinguishing healthy suspect
eyes from eyes with early glaucoma
Li et al.[90] (Zhongshan
Ophthalmic Center,Sun Yat-
sen University)
Glaucoma
detection
Local:
8000 fundus images
DCNN
(GoogleNet)
AUC: 0.986
Sensitivity:95.6%
Specificity:92%
DL can be applied to detect referable
glaucomatous optic neuropathy with high
sensitivity and specificity
Burlina et al.[104] (Retina
Division,Wilmer Eye
Institute,Johns Hopkins
University Schoolof
Medicine)
AMD
Grading
Public:
AREDS 5664 fundus imagesDCNN
Accuracy
79.4% (4-class)
81.5% (3-class)
93.4% (2-class)
Demonstrates comparable performance between
computer and physician grading
Burlina et al.[103] (Retina
Division,Wilmer Eye
Institute,Johns Hopkins
University Schoolof
Medicine)
AMD
detection
Public:
AREDS 130000 fundus
images
DCNN
(AlexNet)
AUC: 0.94∼0.96
Accuracy:88.4%∼91.6%
Applying a DL-based automated assessment of
AMD from fundus images can produce results
that are similar to human performance levels
Journal of Ophthalmology 9
⊘ This is a preview!⊘
Do you want full access?
Subscribe today to unlock all pages.
Trusted by 1+ million students worldwide
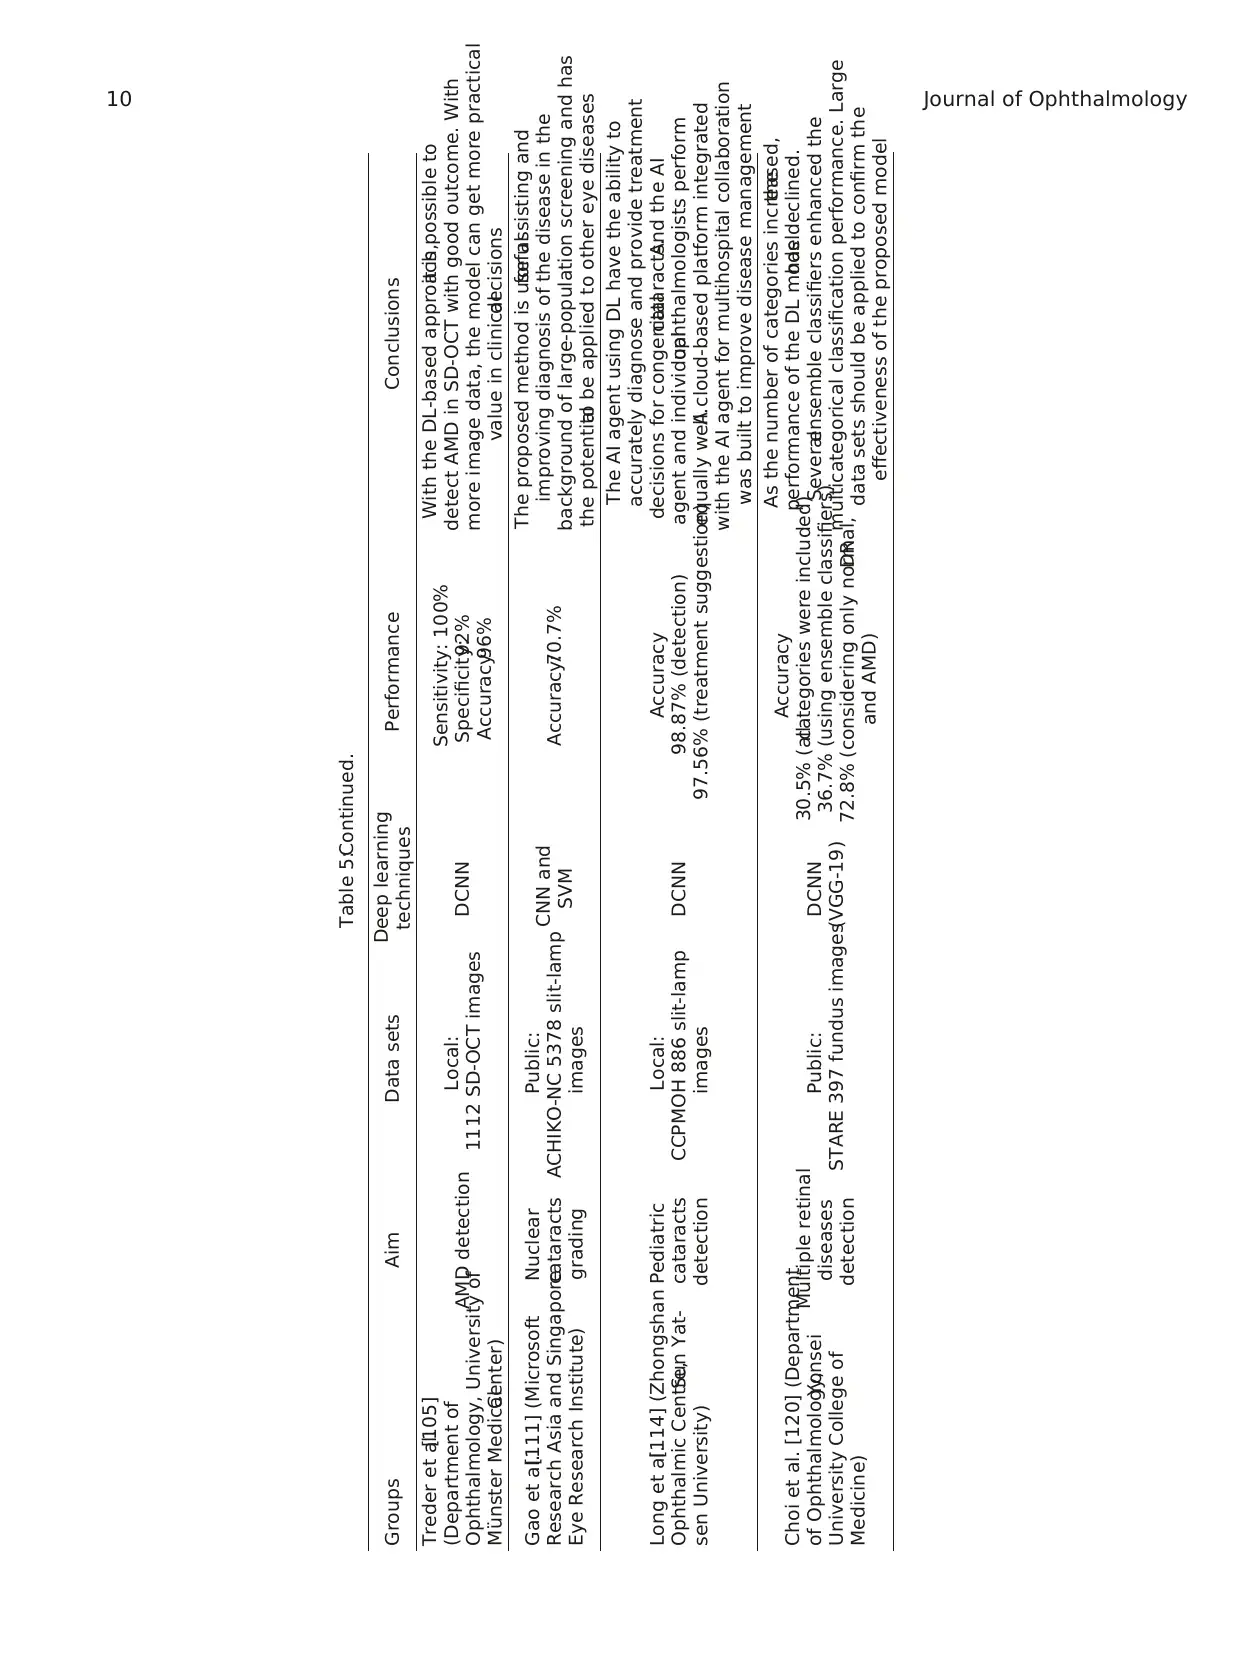
Table 5:Continued.
Groups Aim Data sets Deep learning
techniques Performance Conclusions
Treder et al.[105]
(Department of
Ophthalmology, University of
M¨unster MedicalCenter)
AMD detection Local:
1112 SD-OCT images DCNN
Sensitivity: 100%
Specificity:92%
Accuracy:96%
With the DL-based approach,it is possible to
detect AMD in SD-OCT with good outcome. With
more image data, the model can get more practical
value in clinicaldecisions
Gao et al.[111] (Microsoft
Research Asia and Singapore
Eye Research Institute)
Nuclear
cataracts
grading
Public:
ACHIKO-NC 5378 slit-lamp
images
CNN and
SVM Accuracy:70.7%
The proposed method is usefulfor assisting and
improving diagnosis of the disease in the
background of large-population screening and has
the potentialto be applied to other eye diseases
Long et al.[114] (Zhongshan
Ophthalmic Centre,Sun Yat-
sen University)
Pediatric
cataracts
detection
Local:
CCPMOH 886 slit-lamp
images
DCNN
Accuracy
98.87% (detection)
97.56% (treatment suggestion)
The AI agent using DL have the ability to
accurately diagnose and provide treatment
decisions for congenitalcataracts.And the AI
agent and individualophthalmologists perform
equally well.A cloud-based platform integrated
with the AI agent for multihospital collaboration
was built to improve disease management
Choi et al. [120] (Department
of Ophthalmology,Yonsei
University College of
Medicine)
Multiple retinal
diseases
detection
Public:
STARE 397 fundus images
DCNN
(VGG-19)
Accuracy
30.5% (allcategories were included)
36.7% (using ensemble classifiers)
72.8% (considering only normal,DR
and AMD)
As the number of categories increased,the
performance of the DL modelhas declined.
Severalensemble classifiers enhanced the
multicategorical classification performance. Large
data sets should be applied to confirm the
effectiveness of the proposed model
10 Journal of Ophthalmology
Paraphrase This Document
Need a fresh take? Get an instant paraphrase of this document with our AI Paraphraser
support to patients in remote areas by sharing expert knowledge
and limited resources.While the accuracy ofthe models is
incredible promising,we need to remain prudent and sober
when considering how to deploy these models to the real world.
Most studies regarding intelligent diagnosis of eye dis-
eases focused on binary classification problems,whereas in
clinical setting, visiting patients suffer from multicategorical
retinal diseases. For instance, a model trained to detect AMD
will fail to consider a patientwith glaucoma as diseased
because the model only has the ability to discriminate AMD
from non-AMD. Choi and his colleagues carried out a work
applying DL to automatically detect multiple different ret-
inaldiseases with fundus photographs.When only normal
and DR fundus images were involved in the proposed DL
model,the classification accuracy was 87.4%.However,the
accuracy fell to 30.5% when all 10 categories were included
[120].It indicated that the model’s accuracy declined while
the number ofdiseases increased.To further enhance the
applicability of AI in clinic practice,we should make more
efforts to build intelligent systems that can detect different
retinaldiseases with high accuracy.
Additionally,a single abnormality detected from one
imaging techniquecannotalwaysguaranteethe correct
diagnosis of a specific retinal disease (e.g., DR or glaucoma)
in clinicalpractice.Multimodalclinicalimages,such as
optical coherence tomography angiography, visual field, and
fundusimages,should beintegrated togetherto build
a generalized AI system for more reliable AI diagnosis.
However,the need of huge amount of data remains the
most fundamental problem.Although various data sets have
been available,they only incorporate a small part of diseases
human suffered from.Images with severe diseases or rare
diseases are particularly insufficient.The population charac-
teristics,the existence of various systematic diseases,and the
diverse disease’ phenotypes should be considered when select
input data. Larger data sets from larger patient cohorts under
different settings and conditions,such as diverse ethnics and
environments,are also needed in some automated diagnosis
systems with impressive outcomes for further validation.
The high dependency on the data quality should be
considered.Differentimagingdevices,variousimaging
protocols,and intrinsic noise ofdata can affect the data’s
quality,which may have huge influences on models’per-
formance [38].In addition to data preprocessing,universal
usefulmethods to analyze images with differentqualities
need to be developed urgently.
Although the DL-based methods show excellent results
most of the time, their “black box” nature makes it difficult
to interpret how algorithms make decisions.In this era of
“evidence-based medicine,” it is difficult for clinicians and
patients to trust a mysterious machine that cannot provide
explanations of why the patient is diagnosed with a certain
disease.Whatis more,the techniques thatmake the AI
models more transparent can also detect potential bias in
the training data and ensure that the algorithms perform well
[121]. Heatmaps and the occlusion test are two of these kinds
of techniques thatcan highlighthighly possible abnormal
regions for predictions and make models interpretable to
some extent [7,27].More methods to interpret AI models
should be developed and applied in AI diagnosis. Moreover
the standards to systematically assess these methods sho
also be considered and developed.
Above all,by building interpretable systematic AI plat-
forms using sufficient high-quality and multimodal data an
advanced techniques, we can enhance the applicability of
in clinicalcircumstances.In some day,we mightmake it
possible to adoptintelligentsystems in certain process of
clinicalwork.Though ethical,regulatory,and legalissues
arise,AI will contribute remarkably to revolutionize current
disease diagnostic pattern and generate a significant clinic
impact in the near future.
Conflicts of Interest
The authors declare that they have no conflicts of interest.
Acknowledgments
Thiswork wassupported by the NationalNaturalScience
Foundation of China (81470628) and International Science
Technology Cooperation Program of China (2017YFE01034
References
[1] N. Graham,ArtificialIntelligence,Vol. 1076,Blue Ridge
Summit:Tab Books,Philadelphia,PA, USA,1979.
[2] B.E. Bejnordi,G. Zuidhof,M. Balkenholet al.,“Context-
aware stacked convolutionalneuralnetworks for classifica-
tion of breastcarcinomasin whole-slidehistopathology
images,” Journalof MedicalImaging,vol.4, no. 4, article
44504,2017.
[3] A. Esteva, B. Kuprel, R. A. Novoa et al., “Dermatologist-leve
classification ofskin cancerwith deep neuralnetworks,”
Nature,vol.542,no.7639,pp. 115–118,2017.
[4] S.F. Weng,J. Reps,J. Kai,J. M. Garibaldi,and N.Qureshi,
“Can machine-learning improve cardiovascularrisk pre-
diction using routine clinical data?,” PLoS One, vol. 12, no. 4
Article ID e174944,2017.
[5] B.van Ginneken,“Fifty years of computer analysis in chest
imaging:rule-based,machine learning,deep learning,” Ra-
diologicalPhysics and Technology,vol. 10,no. 1,pp.23–32,
2017.
[6] V. Gulshan,L. Peng,M. Coram et al.,“Developmentand
validation ofa deep learning algorithm fordetection of
diabetic retinopathy in retinal fundus photographs,” JAMA,
vol.316,no.22,p. 2402,2016.
[7] G. Quellec,K. Charri`ere, Y. Boudi,B. Cochener,and
M. Lamard,“Deep image mining for diabetic retinopathy
screening,” Medical Image Analysis, vol. 39, pp. 178–193, 2
[8] M. Caixinha and S. Nunes, “Machine learning techniques in
clinical vision sciences,” Current Eye Research, vol. 42, no.
pp. 1–15,2017.
[9] G.Litjens,T. Kooi,B. E. Bejnordi et al.,“A survey on deep
learning in medical image analysis,” Medical Image Analysi
vol.42,pp.60–88,2017.
[10] A.Lee,P. Taylor,J. Kalpathy-Cramer,and A.Tufail,“Ma-
chine learning has arrived!,” Ophthalmology, vol. 124, no. 1
pp. 1726–1728,2017.
[11] E.Rahimy,“Deep learning applications in ophthalmology,”
Current Opinion in Ophthalmology,vol.29,no.3,pp.254–
260,2018.
Journal of Ophthalmology 11
[12] L.J. Catania and E.Nicolitz,“Artificialintelligence and its
applications in vision and eye care,” Advances in Ophthal-
mology and Optometry,vol.3,no. 1,pp.21–38,2018.
[13] Z.Ghahramani,“Probabilistic machine learning and artifi-
cialintelligence,” Nature,vol.521,no. 7553,pp.452–459,
2015.
[14] A. K. Ambastha and T. Y. Leong, “A deep learning approach
to neuroanatomical characterisation of Alzheimer’s disease,”
Studiesin Health Technologyand Informatics,vol. 245,
p. 1249,2017.
[15] Y. LeCun,Y. Bengio,and G. Hinton,“Deep learning,”
Nature,vol.521,no.7553,pp.436–444,2015.
[16] D.E. Freund,N. Bressler,and P.Burlina,“Automated de-
tection of drusen in the macula,” in Proceedings of the IEEE
International Symposium on Biomedical Imaging: From Nano
to Macro,pp.61–64,Boston,MA, USA,June 2009.
[17] L. Rokach and O. Maimon, “Top-down induction of decision
trees classifiers - a survey,” IEEE Transactions on Systems
Man and Cybernetics PartC, vol.35,no. 4, pp.476–487,
2005.
[18] L.Breiman,“Random forests,” Machine Learning,vol.45,
no. 1,pp.5–32,2001.
[19] C.C. Chang and C.J. Lin, “LIBSVM:a library for support
vector machines,” ACM Transactions on Intelligent Systems
and Technology,vol.2,no.3,pp. 1–27,2011.
[20]P. Langley and K.Thompson,“An analysisof Bayesian
classifiers,” in Proceedings ofAAAI, pp.223–228,San Jose,
CA, USA,March 1992.
[21] J. M. Keller, M. R. Gray, and J. A. Givens, “A fuzzy K-nearest
neighbor algorithm,” IEEE Transactions on Systems Man and
Cybernetics,vol. 15,no.4,pp.580–585,2012.
[22]T. Kanungo,D. M. Mount,N. S.Netanyahu,C. D. Piatko,
R. Silverman, and A. Y. Wu, “An efficient k-means clustering
algorithm: analysis and implementation,” IEEE Transactions
on Pattern Analysis and Machine Intelligence, vol.24, no. 7,
pp.881–892,2002.
[23]J. Ye, “Two-dimensionallinear discriminant analysis,” Ad-
vancesin NeuralInformation Processing Systems,vol.17,
no.6,pp. 1431–1441,2005.
[24]M. T. Hagan, H. B. Demuth, and M. Beale, Neural Network
Design,PWS Publishing Co.,Boston,MA, USA, 1997.
[25]A. Statnikov, L. Wang, and C. F. Aliferis, “A comprehensive
comparison of random forests and support vector machines
for microarray-basedcancerclassification,”BMC BIO-
INFORMATICS,vol.9,no. 1,pp. 1–10,2008.
[26]P. Sermanet, D. Eigen, X. Zhang, M. Mathieu, R. Fergus, and
Y. Lecun, “OverFeat: integrated recognition, localization and
detection using convolutionalnetworks,” Arxiv,2013.
[27]D. S. Kermany,M. Goldbaum,W. Cai et al.,“Identifying
medicaldiagnosesand treatable diseasesby image-based
deep learning,” Cell,vol. 172,no.5,pp. 1122–1131,2018.
[28]R. Salakhutdinov and G.Hinton,“An efficientlearning
procedure for deep Boltzmann machines,” NeuralCompu-
tation,vol.24,no.8,pp. 1967–2006,2012.
[29]Y. Cho and L. K. Saul, “Kernel methods for deep learning,” in
Advancesin Neural Information ProcessingSystems22:
Conferenceon Neural InformationProcessingSystems,
pp.342–350,Vancouver,British Columbia,Canada,2009.
[30]N. V. Chawla, K. W. Bowyer, L. O. Hall, and
W. P. Kegelmeyer,“SMOTE: syntheticminorityover-
sampling technique,” Journalof ArtificialIntelligence Re-
search,vol. 16,no. 1,pp.321–357,2002.
[31] A.Krizhevsky,I. Sutskever,and G.E. Hinton,“ImageNet
classification with deep convolutionalneuralnetworks,” in
Proceedingsof InternationalConferenceon Neural In-
formation Processing Systems,pp.1097–1105,Lake Tahoe,
Nevada,December 2012.
[32] K.Simonyan and A.Zisserman,“Very deep convolutional
networksfor large-scaleimagerecognition,”Computer
Science,http://arxiv.org/abs/arXiv:1409.1556,2014.
[33] K. He, X. Zhang, S. Ren, and J. Sun, “Deep residual learning
for image recognition,” in Proceedings of2016 IEEE Con-
ference on Computer Vision and Pattern Recognition (CVPR
pp.770–778,Las Vegas,NV, June 2016.
[34] C.Szegedy,W. Liu, Y. Jia et al.,“Going deeper with con-
volutions,” http://arxiv.org/abs/arXiv:1409.4842,2014.
[35] S.Ioffe and C.Szegedy,“Batch normalization:accelerating
deep network training by reducing internal covariate shift,”
http://arxiv.org/abs/arXiv:1502.03167,2015.
[36] C. Szegedy, V. Vanhoucke, S. Ioffe, J. Shlens, and Z. Wojna,
“Rethinking the inception architecture for computer vision,”
in Proceedings of 2016 IEEE Conference on Computer Vision
and Pattern Recognition (CVPR), pp. 2818–2826, Las Vegas,
NV, June 2016.
[37] C. Szegedy, S. Ioffe, V. Vanhoucke, and A. Alemi, “Inception
v4,inception-ResNet and the impact of residual connections
on learning,” http://arxiv.org/abs/arXiv:1602.07261,2016.
[38] J.Lee,S.Jun,Y. Cho et al.,“Deep learning in medicalim-
aging:generaloverview,”Korean Journalof Radiology,
vol. 18,no.4,p. 570,2017.
[39] S.Savalia and V.Emamian,“Cardiac arrhythmia classifi-
cation by multi-layerperceptron and convolution neural
networks,” Bioengineering,vol.5,no.2,p. 35,2018.
[40] P. Fergus,D. Hignett,A. Hussain,D. Al-Jumeily,and
K. Abdel-Aziz, “Automatic epileptic seizure detection using
scalp EEG and advanced artificialintelligence techniques,”
BioMed Research International, vol. 2015, Article ID 986736
17 pages,2015.
[41] S.Yu, K. K. Tan,L. S.Ban,S.Li, and A.T. H. Sia,“Feature
extraction and classification for ultrasound images of lumba
spine with support vector machine,” in Proceedings of 36th
Annual International Conference of the IEEE Engineering in
Medicine and Biology Society,pp.4659–4662,Chicago,IL,
USA,August 2014.
[42] G. Xiong, D. Kola, R. Heo, K. Elmore, I. Cho, and J. K. Min,
“Myocardialperfusion analysisin cardiaccomputed to-
mographyangiographicimagesat rest,”MedicalImage
Analysis,vol.24,no. 1,pp.77–89,2015.
[43] X.Jiang and Y.Huang,“Research on data pre-process and
featureextraction based on waveletpacketanalysis,”in
Proceedings of 6th World Congress on Intelligent Control an
Automation,pp.5850–5853,Dalian,China,June 2006.
[44] V.Cherkassky and F.Mulier,“Statisticallearning theory,”
Encyclopedia ofthe Sciencesof Learning,vol. 41,no. 4,
p. 3185,1998.
[45] K. Hajian-Tilaki,“Receiveroperating characteristic (ROC)
curve analysis for medical diagnostic test evaluation,” Casp
Journal of Internal Medicine, vol. 4, no. 2, pp. 627–635, 2013
[46] R.Gargeya and T.Leng,“Automated identification ofdi-
abeticretinopathy using deep learning,”Ophthalmology,
vol. 124,no.7,pp.962–969,2017.
[47] N. G. Congdon, D. S. Friedman, and T. Lietman, “Important
causes ofvisualimpairmentin the world today,” JAMA,
vol.290,no. 15,pp.2057–2060,2003.
[48] E. Oh, T. K. Yoo, and E. C. Park, “Diabetic retinopathy risk
prediction for fundus examination using sparse learning:
a cross-sectionalstudy,”BMC MedicalInformaticsand
Decision Making,vol. 13,no. 1,p. 106,2013.
12 Journal of Ophthalmology
⊘ This is a preview!⊘
Do you want full access?
Subscribe today to unlock all pages.
Trusted by 1+ million students worldwide
1 out of 16
Your All-in-One AI-Powered Toolkit for Academic Success.
+13062052269
info@desklib.com
Available 24*7 on WhatsApp / Email
![[object Object]](/_next/static/media/star-bottom.7253800d.svg)
Unlock your academic potential
Copyright © 2020–2026 A2Z Services. All Rights Reserved. Developed and managed by ZUCOL.