AIC Resources Wealth Management: A Financial Performance Analysis

Verified

Added on  2023/04/20

|6
|1606
|330
Report
AI Summary
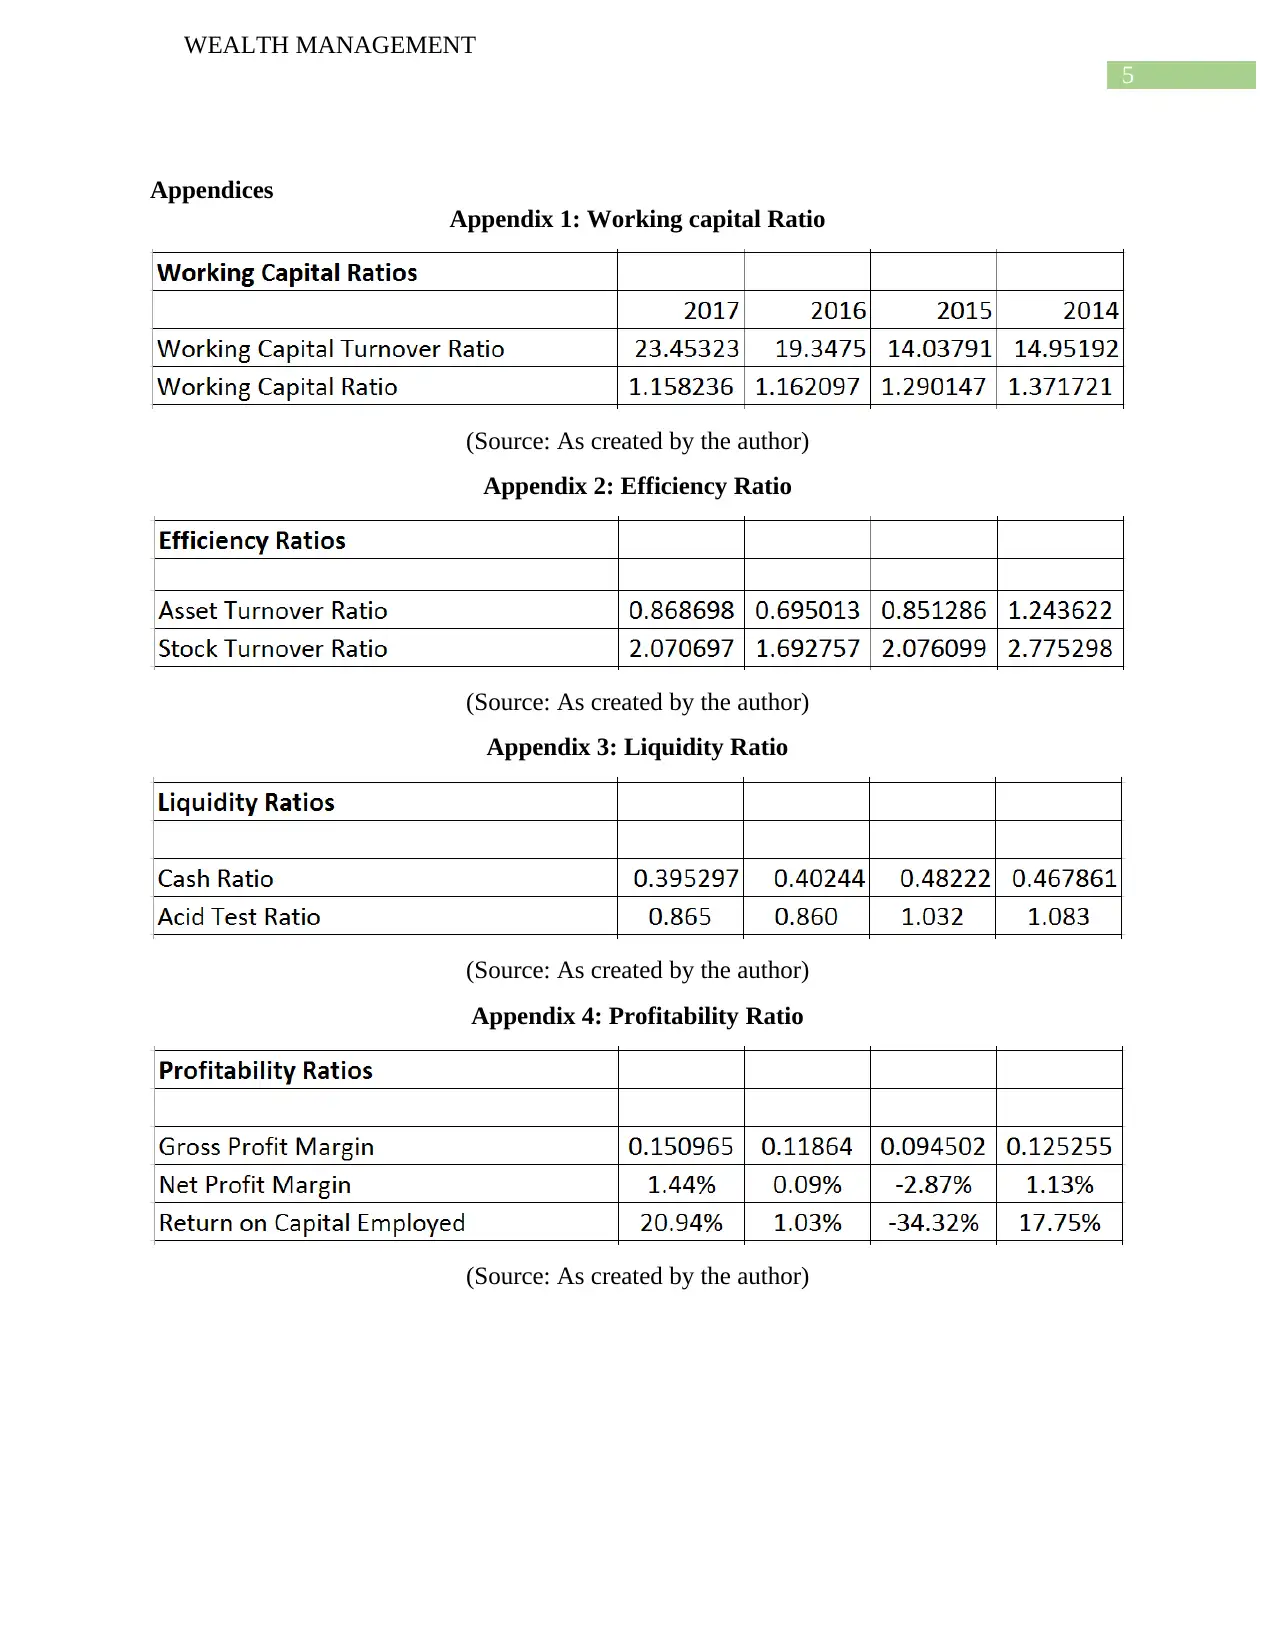
This report provides a comprehensive financial analysis of AIC Resources Limited, focusing on wealth management through the examination of key financial ratios. The analysis includes working capital ratios, efficiency ratios, liquidity ratios, and profitability ratios, covering the period from 2014 to 2017. The findings indicate that AIC Resources Limited faces challenges in maintaining adequate liquidity, particularly in covering its short-term liabilities. The report also highlights declining asset turnover ratios and identifies areas for improvement in efficiency and profitability. Recommendations are made to enhance the company's financial performance, including better management of liabilities and assets to improve cash ratios and overall financial stability. The analysis concludes that while AIC Resources Limited demonstrates potential, strategic adjustments are necessary to optimize wealth management and ensure sustainable growth.
tabler-icon-diamond-filled.svg

Contribute Materials

Your contribution can guide someone’s learning journey. Share your documents today.
Document Page
0
Running head: WEALTH MANAGEMENT
WEALTH MANAGEMENT
Name of the Student
Name of the University
Author’s Note
tabler-icon-diamond-filled.svg

Secure Best Marks with AI Grader

Need help grading? Try our AI Grader for instant feedback on your assignments.
Document Page
1
WEALTH MANAGEMENT
Executive Summary
Wealth management not only helps in understanding the existing fiscal scenario of a firm
in the particular year but also allows to interpret the past trends of the financial performance
From a wider aspect it can be said that to understand the financial health of an organization it is
important to compute the financial analysis through estimation of its financial ratios which help
the stakeholders to acquire a better sense of the accounts that is been revealed by the financial
statements in an informative way. In this paper AIC RESOURCES LIMITED is been examined
and recommendation is been proposed to ensure effective wealth management for the company.
It is been found that the liquidity of the firm is quite low for which the firm is confronted with
problem regarding funding its future investments and cover up its short term liabilities.
Introduction
Wealth management is essential in order to help a company as well as other stakeholders to
understand its financial health. The purpose of the financial statement is to reflect the actual facts
and figures within the organization in the fiscal year. The analysis of AIC RESOURCES
LIMITED is being presented to incorporate the corresponding financial health of the company
within its market place can be understood (Dang, Forsyth and Vetzal. 2016).
Analysis
Working Capital Ratios
Working capital ratios helps to measure the exiting state of capital that is being invested
and circulated in the financial year to identify the short-term assets available to pay for the short
term debts or obligations in the organization. Clearly the valuations reveals thatAIC
RESOURCES LIMITED is able to manage its short term liabilities and assets which helps it to
smoothen up its global operations which can be seen in appendix 1 (Kliman and Arinze. 2019).
Interpretation
It is been seen that the value of working capital ratio was good within the year 2014 and
2015 as it was between 1. 2 to 2. However, in the year 2016 it is 1.162 while by 2017 it
deteriorated to 1.158 which is not good. By formula of working capital ratio, the values of 2017
represents the fact that to cover up one unit of current liabilities the amount of current assets that
is available is 1.15 units. However, in case of 2016 to cover up one unit of current liabilities the
units of current assets that is available is 1.162. Thus the valuations of working capital ratio
reflects the fact that to cover up short-term obligations, 2016 was better than 2017 in case of AIC
RESOURCES LIMITED.
Efficiency Ratios
The degree of efficiency of AIC RESOURCES LIMITED in management of its assets
and other resources can be shown by the efficiency ratios in appendix 2
Interpretation
It is been seen that the asset turnover ratio have decreased overtime. By 2014 it was 1.24
while by 2015 it was 0.85, by 2016 it was 0.69 while by 2017 it was 0.86. The asset turnover
ratio was higher by 2014. The asset turnover ratio, got decreased by 2015 till 2016 it was lowest.
However, by 2017 it increased to 0.86 which is a good sign of the fact that by 2016. This is not a
good value of asset turnover as a good asset turnover is the ratio valuation that is more than 1.
However, it can be said that the asset turnover by 2017 is better than 2016. Since by 2017 it is
Document Page
2
WEALTH MANAGEMENT
2.07, the sales have increased due to fast rising demand. However, by 2016 the price were
expected to rise and hence a low stock turnover ratio of 1.69 is good.
Liquidity Ratios
The liquidity ratio can be seen in appendix 3
Interpretation
The cash ratio reflects the company’s ability to pay-off its short term liabilities and hence
the valuation of cash ratios from 2014 till 2017 is not at all good for AIC RESOURCES
LIMITED as the values are not only less than 1 but also less than 0.5 which is not at all
acceptable. It shows that the company have a very low ability to cover up its short term
liabilities. Similarly, the acid test ratio reflects the difference between the assets and inventory
with respect to per unit of liabilities. This reveals the fact that how much AIC RESOURCES
LIMITED have short term assets to pay off its immediate liabilities. In case of AIC
RESOURCES LIMITED it is been found that only by 2014 and 2015, the ability of firm to cover
up its immediate liabilities is good but not by 2016 or 2017 as its values are below 1.
Profitability Ratios
The profitability ratio can be seen in appendix 4
Interpretation
The acceptable range of gross profit margin ratio is 25 % or above. The ratio stated is
being the profit after paying off the cost of goods sold and expressed as a percentage of sales. It
is important to understand that how much the gross profit has been increased after rise in the
operating expenses.
Financial Aspects
The financial analysis reveals that AIC RESOURCES LIMITED is able to meet the
stakeholder’s needs if it is in profitable position. The numerical valuation is for measuring
profitability for the organization (Arora, and Verma. 2018). It is been found that forAIC
RESOURCES LIMITED, the gross profit margin is 0.15, 0.11, 0.09 and 0.12 respectively by
2017, 2016, 2015 and 2014 which are very poor. A net profit margin of at least 4 % is good.
However, AIC RESOURCES LIMITED have loss by 2015 while it have recovered by 2016 and
by 2017 it has a net profit margin of 1.44 % which is very low compared to 4 % net profit
margin. Since, net profit margin is the per unit valuation of net profit with respect to per unit of
revenue hence the value of 1.44 % can be considered better.The company is able to maximize is
efficiency in terms of utilizing assets and covering of its liabilities. When sales are up by 0.63 %
there exist possibility of aggressive promotional approach towards price towards is potential
clients and acquire prospective consumers.
Non-financial aspects that impacts the economic state of AIC Resource Ltd
Maintaining a proper trade agreement and provide the same quality of goods at a cheaper
cost the proposition of import is a good initiative. Exploration of mineral products and
acquisition of them for rendering better output is the objective of the firm. The company has
exported its resources from countries which have lower currency exchange rate like India China,
etc. ascends advantage in terms of valuations in currency which help them to acquire the same
kind of product but at a cheaper rate (Scott and Cavaglia. 2018).
Recommendation &Conclusion
Efficiency ratios and the performance of the company should be better off for increasing
future earnings.
Document Page
3
WEALTH MANAGEMENT
Company needs to maintain a balance between the liabilities and assets to cover up its
liabilities with its existing assets as the cash ratios are found to monotonically decrease
from 2014 to 2017.
tabler-icon-diamond-filled.svg

Secure Best Marks with AI Grader

Need help grading? Try our AI Grader for instant feedback on your assignments.
Document Page
4
WEALTH MANAGEMENT
References
Arnold, T., Earl, J.H., Marshall, C.D. and Schwartz, A., 2017. Excel Calculators for Determining
Retirement Accumulation and Disbursement Information. The Journal of Wealth
Management, 20(2), pp.94-101.
Arora, A. and Verma, R., 2018. Perception of advisors' regarding behaviour of investors' while
selecting wealth management services: an AHP approach. International Journal of Business and
Globalisation, 21(4), pp.484-504.
Dang, D.M., Forsyth, P. and Vetzal, K., 2016. The 4 percent Strategy Revisited: A Pre-
Commitment Optimal Mean-Variance Approach to Wealth Management.
Kliman, R. and Arinze, B., 2019. Cognitive Computing: Impacts on Financial Advice in Wealth
Management. In Aligning Business Strategies and Analytics (pp. 11-23). Springer, Cham.
Ong, S., 2018. Wealth Management–Preparing for a Digital Revolution. The WealthTech Book:
The FinTech Handbook for Investors, Entrepreneurs and Finance Visionaries, pp.120-122.
Perry, E. and Weltewitz, F., 2015. Wealth management products in China. RBA Bulletin, pp.59-
68.
Pirker, A. and Schmitt, S., 2018. Building a wealth management practice: Measuring CFP
professionals’ contribution. Retrieved February, 12.
Scott, L. and Cavaglia, S., 2018. Practical Applications of A Wealth Management Perspective on
Factor Premia and the Value of Downside Protection. Practical Applications, 6(1), pp.1-5.
Document Page
5
WEALTH MANAGEMENT
Appendices
Appendix 1: Working capital Ratio
(Source: As created by the author)
Appendix 2: Efficiency Ratio
(Source: As created by the author)
Appendix 3: Liquidity Ratio
(Source: As created by the author)
Appendix 4: Profitability Ratio
(Source: As created by the author)
chevron_up_icon
1 out of 6
circle_padding
hide_on_mobile
zoom_out_icon
logo.png

Your All-in-One AI-Powered Toolkit for Academic Success.

Available 24*7 on WhatsApp / Email

[object Object]