BEng Mechanical Engineering FYP Project: Air-conditioning Analysis
VerifiedAdded on 2022/11/28
|28
|7162
|121
Project
AI Summary
This project analyzes the performance of an air-conditioning and mechanical ventilation system, focusing on a chilled-water system at the National University of Singapore. The study investigates chiller loads, operating temperatures, flow rates, power consumption, and plant efficiency. The methodology includes data collection, data processing, and a life cost assessment. The project aims to alleviate ΔT degradation challenges, quantify improvements, and provide recommendations for enhancing the system's efficiency. The findings reveal that the setpoint cannot be maintained by a chilled water loop. The project also includes a literature review on chilled water systems and the degradation of ΔT. The study suggests recommendations for improvement based on the analyzed situation and recommends alternative components/control strategies to improve performances using an analytical approach. The project concludes with a life cycle cost assessment and recommendations for future research. The document serves as a project confirmation form for a Bachelor of Engineering in Mechanical Engineering.
TU MMD3047-N - FYP Project Top up Confirmation Form (BEng
Mechanical Engineering)
Project Confirmation Form
Student's Name and ID (Print):Thanavelkumar
S7567355H……………………………………………………
Project Title: Performance Analysis of an Air-conditioning & Mechanical
Ventilation System .
…………………………………………………………………………
………………………………………………………………………………………
….
Project Supervisor (Print): Dr Kang Kok Hin
Paraphrase This Document
Need a fresh take? Get an instant paraphrase of this document with our AI Paraphraser
Contents
Contents......................................................................................................................................................2
INTRODUCTION...........................................................................................................................................3
LITERATURE REVIEW....................................................................................................................................5
AIM..............................................................................................................................................................7
SPECIFIC OBJECTIVES...................................................................................................................................7
METHODOLOGY...........................................................................................................................................7
Data Collection........................................................................................................................................7
Chiller Loads........................................................................................................................................7
Operating Temperatures (Condenser water temperature).................................................................7
Chilled Water Operating Temperatures..................................................................................................7
CHWS/R flow rate....................................................................................................................................7
Power Consumption................................................................................................................................8
Flow rates (Condenser water flow rates).............................................................................................8
Plant Efficiency....................................................................................................................................8
Data Processing.....................................................................................................................................10
Life Cost assessment..............................................................................................................................14
FINDINGS AND RECOMMENDATIONS.......................................................................................................15
The first discovery or finding: The setpoint cannot be maintained by a chilled water loop..............15
Life Cost assessment..............................................................................................................................21
CONCLUSION.............................................................................................................................................22
REFERENCES..............................................................................................................................................24
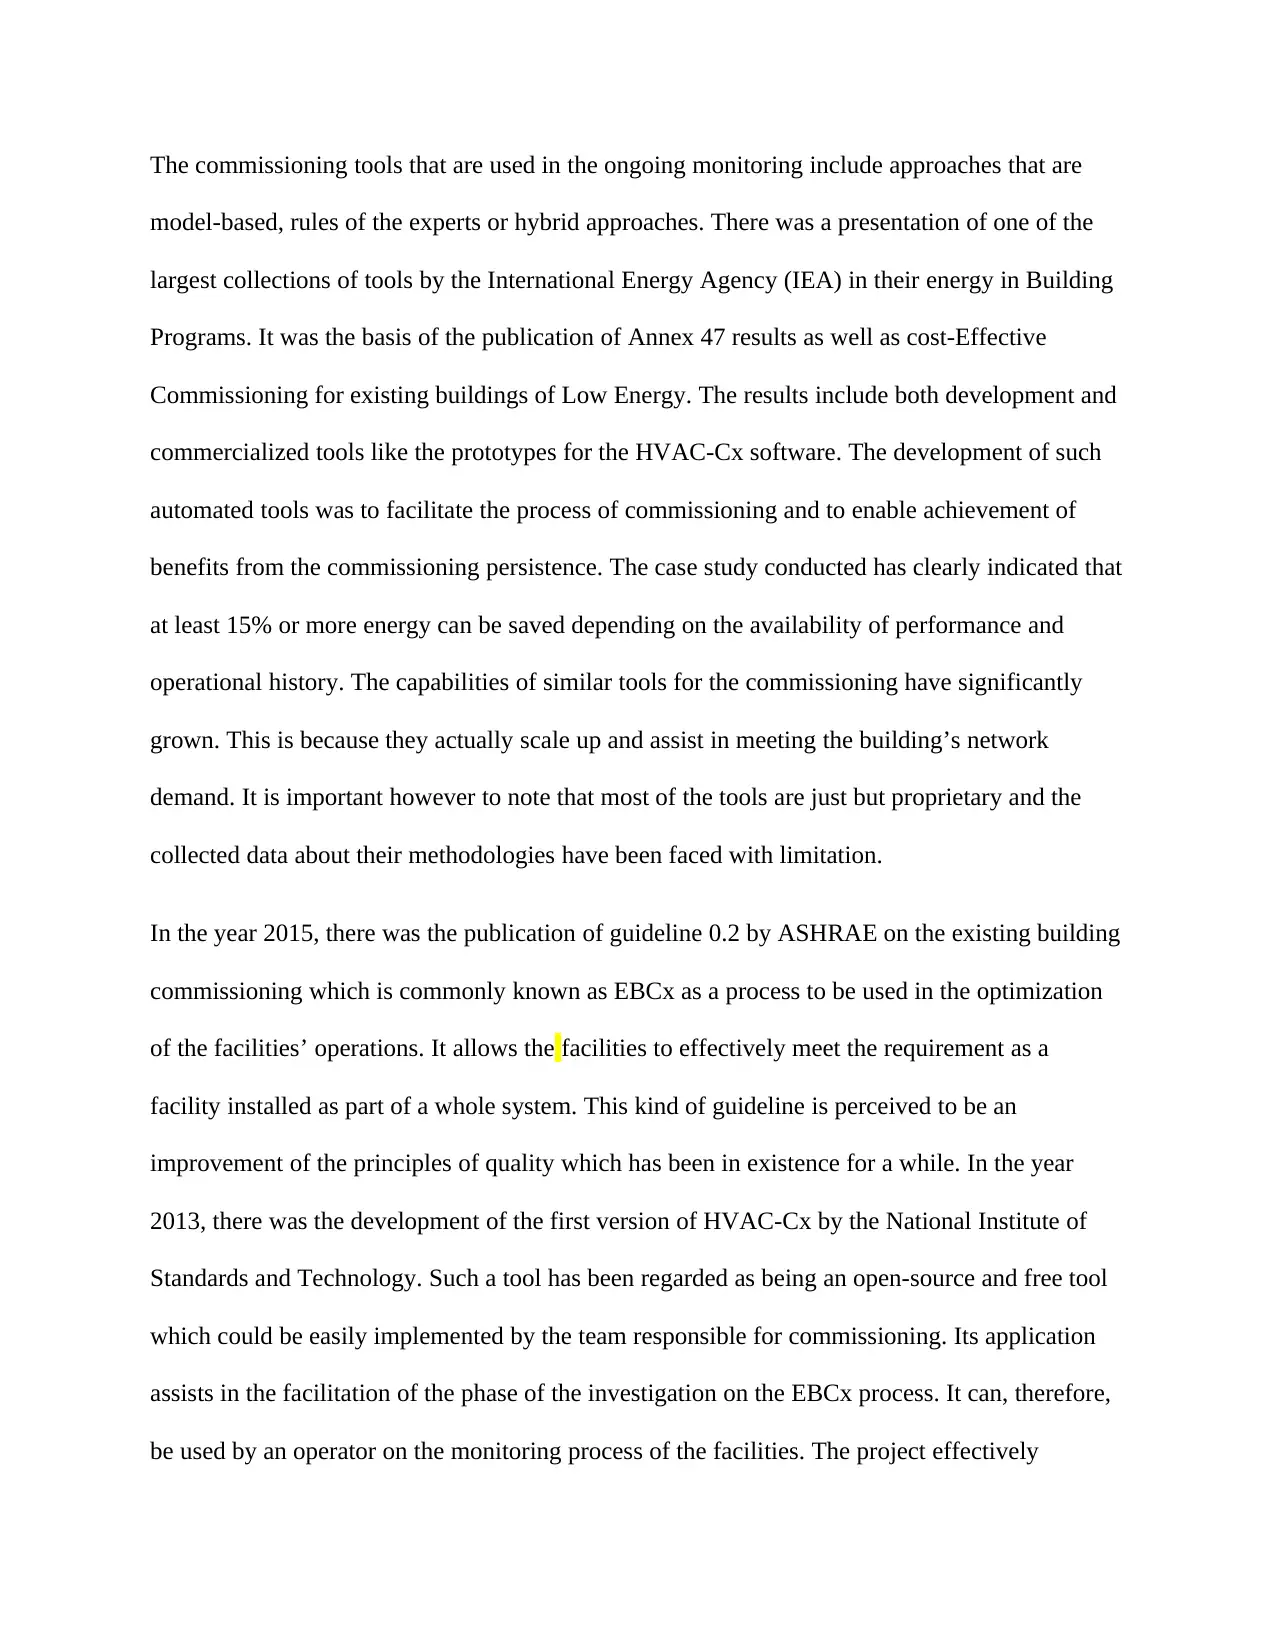
INTRODUCTION
Owners of the buildings are gaining a proper understanding of the benefits of commissioning
buildings. When investments are made in the process of commissioning, it is possible to have
reduced energy use, minimized life-cycle costs, and improved comfort of the occupants as well
as their productivity. It is important to note that cost-effective maintenance is possible from a
similar understanding. When there is a better understanding of the commissioning of the
building, it lays the basis or rather forms the foundation for effective maintenance and operation.
The operator will, therefore, be capable of getting valuable feedback on an ongoing process
which aims at maintenance of system performance (Yan 2016).
This is the case, particularly for the ongoing commissioning. It is regrettable however to note
that commissioning has never been standard practice and the costs are still very high with the
exceptions being for schools and government buildings in Singapore. The building construction
including those which are involved in the activities of commissioning have already recognized
the need for the tools which can effectively automate some of the commissioning steps that are
generally labor-intensive. Such tools are capable of detection and analysis of the faults within the
mechanical system.
⊘ This is a preview!⊘
Do you want full access?
Subscribe today to unlock all pages.
Trusted by 1+ million students worldwide
The commissioning tools that are used in the ongoing monitoring include approaches that are
model-based, rules of the experts or hybrid approaches. There was a presentation of one of the
largest collections of tools by the International Energy Agency (IEA) in their energy in Building
Programs. It was the basis of the publication of Annex 47 results as well as cost-Effective
Commissioning for existing buildings of Low Energy. The results include both development and
commercialized tools like the prototypes for the HVAC-Cx software. The development of such
automated tools was to facilitate the process of commissioning and to enable achievement of
benefits from the commissioning persistence. The case study conducted has clearly indicated that
at least 15% or more energy can be saved depending on the availability of performance and
operational history. The capabilities of similar tools for the commissioning have significantly
grown. This is because they actually scale up and assist in meeting the building’s network
demand. It is important however to note that most of the tools are just but proprietary and the
collected data about their methodologies have been faced with limitation.
In the year 2015, there was the publication of guideline 0.2 by ASHRAE on the existing building
commissioning which is commonly known as EBCx as a process to be used in the optimization
of the facilities’ operations. It allows the facilities to effectively meet the requirement as a
facility installed as part of a whole system. This kind of guideline is perceived to be an
improvement of the principles of quality which has been in existence for a while. In the year
2013, there was the development of the first version of HVAC-Cx by the National Institute of
Standards and Technology. Such a tool has been regarded as being an open-source and free tool
which could be easily implemented by the team responsible for commissioning. Its application
assists in the facilitation of the phase of the investigation on the EBCx process. It can, therefore,
be used by an operator on the monitoring process of the facilities. The project effectively
Paraphrase This Document
Need a fresh take? Get an instant paraphrase of this document with our AI Paraphraser
describes a field study on the chilled -water system which was conducted on the National
University of Singapore during the cooling season.
LITERATURE REVIEW
Temperature difference degradation between the return and supply flow which is commonly
known as ΔT degradation in the system of the chilled water system has been observed widely
and documented for a period of not less than 25 years(Leong et al.2016). Despite the fact that the
most common problem has been decreasing temperature difference of the waterside, the actual
challenge has been corresponding water flow rate which increases. In cases where there are part-
load conditions, there is an increase in the mass flow rate relative to the load of the cooling. This
implies that there is a need for an additional cooling tower and chiller that is supposed to be
brought online so as to ensure that the flow requirement is maintained(Zeigler et al.2013). This
will have to be carried out despite the fact that the cooling capacity limits of the chillers have not
been reached. The decrease of the overall efficiency of the system which is common in the plants
of chilled water is caused by reduced chillers’ efficiency when they are operating under
conditions of part-load as well as high pumping energy consumption(Xiao and Fan 2014).
In chilled water plants, the common causes of a ΔT degradation includes control valves which
might be oversized. When the valves are oversized, there is usually two-position behavior,
suboptimal use of flow and valve hunting. For the purposes of illustration, take for instance a
central chilled water plant that is equipped with two 200-ton chillers arranged in parallel. In case
each of the units is served by a specially dedicated water pump under control of drive that has a
variable frequency, the impacts will be evident. The plant is assumed to be operating at 12°F
(6.7K) ΔT which exist between the return temperature and chilled water supply,180 ton(633Kw)
load which is in such a way that 45% being part load. This results in 360 GPM flow of loop
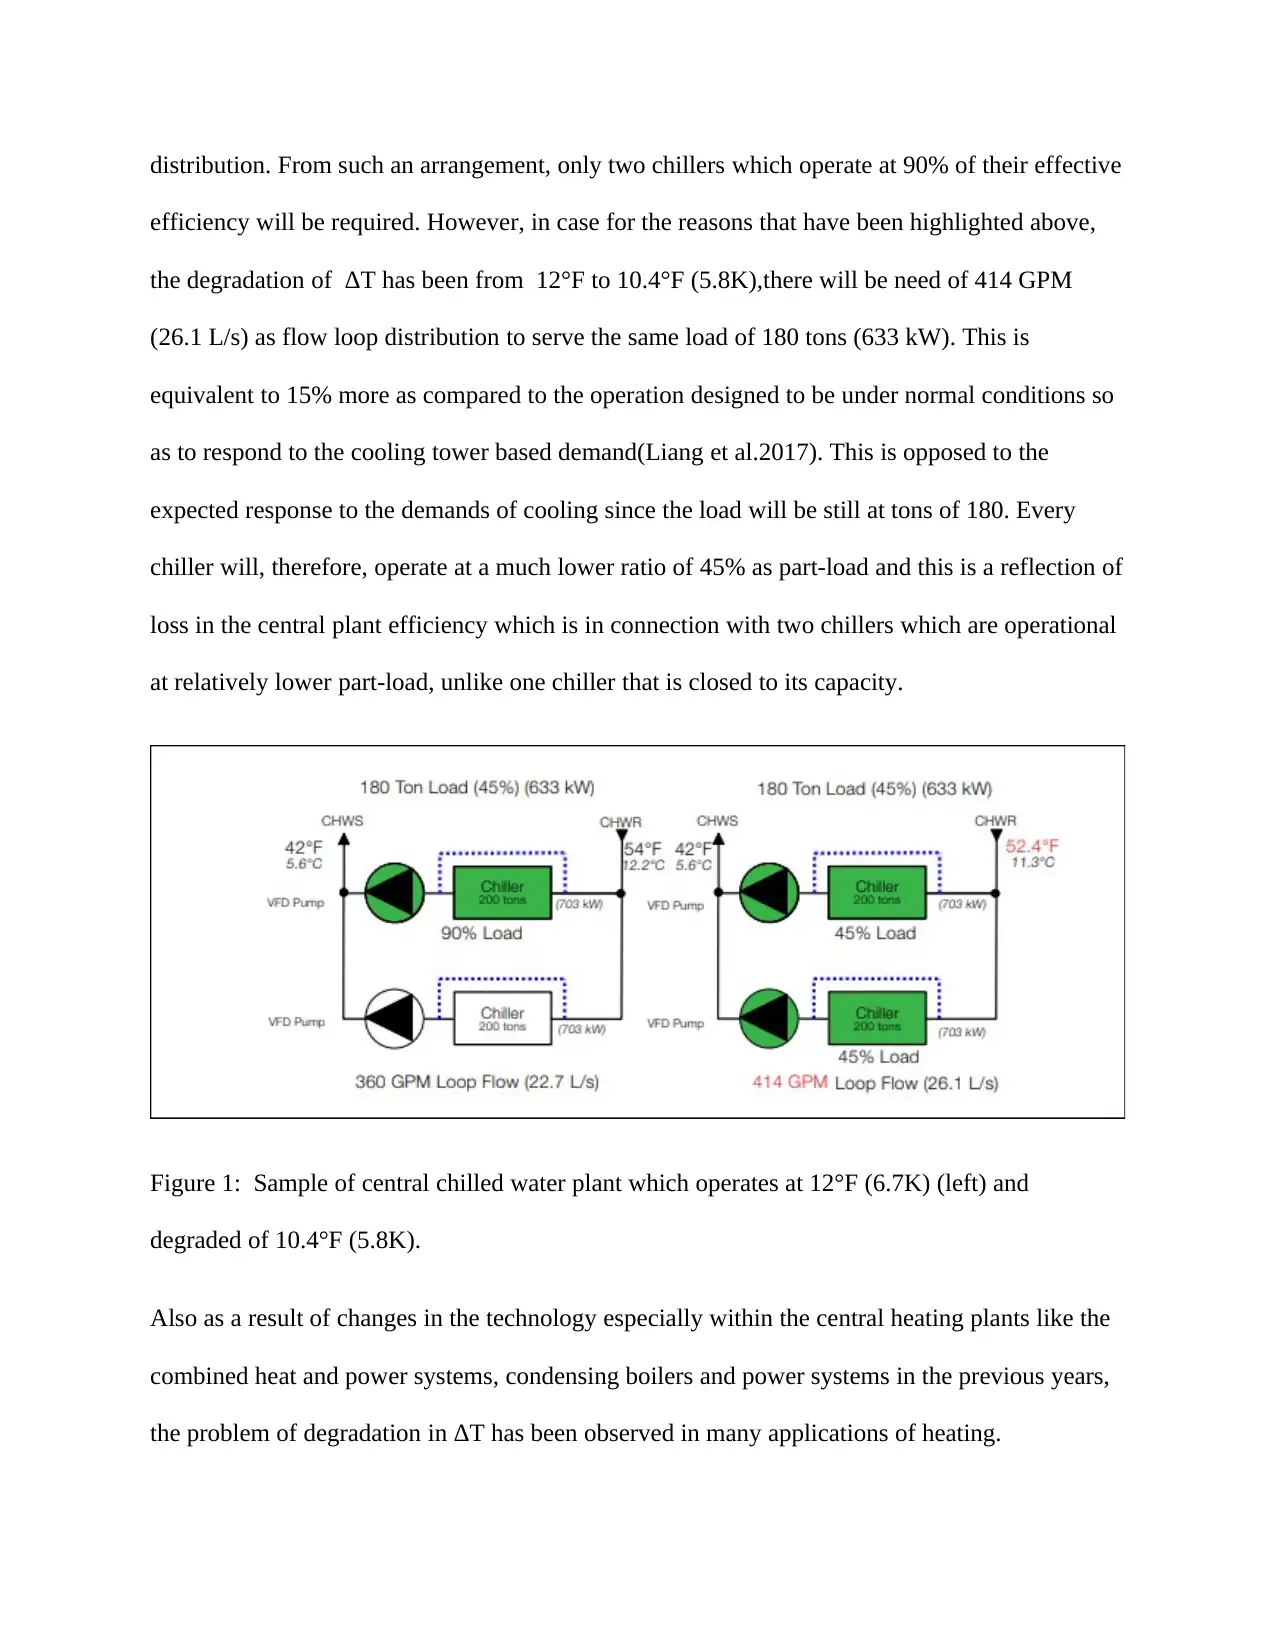
distribution. From such an arrangement, only two chillers which operate at 90% of their effective
efficiency will be required. However, in case for the reasons that have been highlighted above,
the degradation of ΔT has been from 12°F to 10.4°F (5.8K),there will be need of 414 GPM
(26.1 L/s) as flow loop distribution to serve the same load of 180 tons (633 kW). This is
equivalent to 15% more as compared to the operation designed to be under normal conditions so
as to respond to the cooling tower based demand(Liang et al.2017). This is opposed to the
expected response to the demands of cooling since the load will be still at tons of 180. Every
chiller will, therefore, operate at a much lower ratio of 45% as part-load and this is a reflection of
loss in the central plant efficiency which is in connection with two chillers which are operational
at relatively lower part-load, unlike one chiller that is closed to its capacity.
Figure 1: Sample of central chilled water plant which operates at 12°F (6.7K) (left) and
degraded of 10.4°F (5.8K).
Also as a result of changes in the technology especially within the central heating plants like the
combined heat and power systems, condensing boilers and power systems in the previous years,
the problem of degradation in ΔT has been observed in many applications of heating.
⊘ This is a preview!⊘
Do you want full access?
Subscribe today to unlock all pages.
Trusted by 1+ million students worldwide
AIM
To analyze the existing system of chilled- water in order to reveal its performance dependency
on the individual components of the same parts.
SPECIFIC OBJECTIVES
To alleviate degradation of ΔT challenges in National University of Singapore by the use
of control valves which are advanced pressure-independent?
To quantify the achieved improvement
To provide other recommendations based on the analyzed situation.
METHODOLOGY
Data Collection
Chiller Loads
In National University of Singapore central chilled –water system is made up of 30400 tons
(107MW). These were electric centrifugal chillers which work on the basis of the absorption.
Operating Temperatures (Condenser water temperature)
An internal study which was carried out in the recent time indicated that the ΔT of the plant has
been as low as 2°F (1.1K). This translates to an average annual parameter approximate of ΔT as
6°F (3.3K).
Chilled Water Operating Temperatures
The operation temperature of chilled water was at 2°F (1.1K)..
CHWS/R flow rate
The CHWS/R flow rate as estimated from the installed flow metres is 1400L/s.
Paraphrase This Document
Need a fresh take? Get an instant paraphrase of this document with our AI Paraphraser
Power Consumption
The annual power consumption of the plant was estimated to be (107MW).
Flow rates (Condenser water flow rates)
Other than the number of coils of the fans, the structure (Library) is being conditioned by at least
six air handlers with the capacity ranging from 7500 to 30000 cfm. This is equivalent to the flow
rate of the condenser as 3540 to 14 160L/s.
Plant Efficiency
The power operation efficiency was estimated to be between 40% and 80%.
Retrofit project description
The main library on the National University of Singapore has a there story 153,000 gross square
foot. This an approximate of 14286m2.The building was actually constructed in the year 1968.
Other than the number of the fan coils, this particular structure is conditioned by at least six
handlers of air with the capacity ranging from 7500 to 30000 cfm .
This is equivalent to (3,540 to 14,160 L/s). As already indicated, the majority of the handlers of
air are averaged at 6°F (3.3K) for coil ΔT. The main cause of the low value of ΔT was
overpumping on the coils. In order to have this particular situation improved there was testing of
two control strategies. In the initial stages, there was testing of two air handlers. One of the
testings involved the use of the strategy of a ΔT control which is conventionally applied to new
motorize. For the one which is pressure dependent, the deteriorated valve was replaced by a
globe valve(Mohan et al 2016). The last case was the use of pressure independent valves of ΔT
control types and were occurring in pairs. The use of two tandem valves was to ensure that the
flow rate for the coil exceeded the pressure independent valve capacities(Shen et al 2013).
During this particular time, the valves were never equipped with the meters of the flow which
today form part of the intelligent control valve. Instead, the system used was a mechanical
independent pressure control mechanism. In order to allow for the comparison between the
pressure dependent and pressure independent valves, a new globe valve was installed. All the
entire valves on the handlers of air used the same strategy of a ΔT control(Foo et al 2014). In
either approach, there was an increase in the ΔT of the handlers of air from certain values to 12°F
(6.7K). The arrangement of the pressure independent gave a proper control which was evident by
standard deviation which was as small as 0.7°F (0.4K). This value has been small when
compared to the values of standard deviation in the case of the pressure-dependent valves which
is 1.5°F (0.8K). It was, therefore, possible to conclude that both the management of ΔT as a
strategy as well as pressure independence were crucial in getting the most successful and
consistent result.
A larger pressure independent valve with the strategy of ΔT has in the meantime become
available. The other four air handlers remaining together with the one that uses a new valve of
the globe were taken through retrofitting program before they could be tested with the new
intelligent valves for the control. The air handling unit which is commonly known as AHU-5
equipped with the manager of ΔT and mechanically pressures independent valve was just left in
the present state configuration since the performance of the set up was found to be okay(Paiva et
al.2012). Considering that the same arrangement of the valve lack flow measurement which is
accurate as per the intelligent control valve, it was not included in the detailed analysis of the
data(Foo et al 2014).
A sketch of the prototypical retrofit is as indicated below. In the sketch, there is an illustration of
the cooling coil in a unit of air handling that has been equated with the intelligent valve control
⊘ This is a preview!⊘
Do you want full access?
Subscribe today to unlock all pages.
Trusted by 1+ million students worldwide
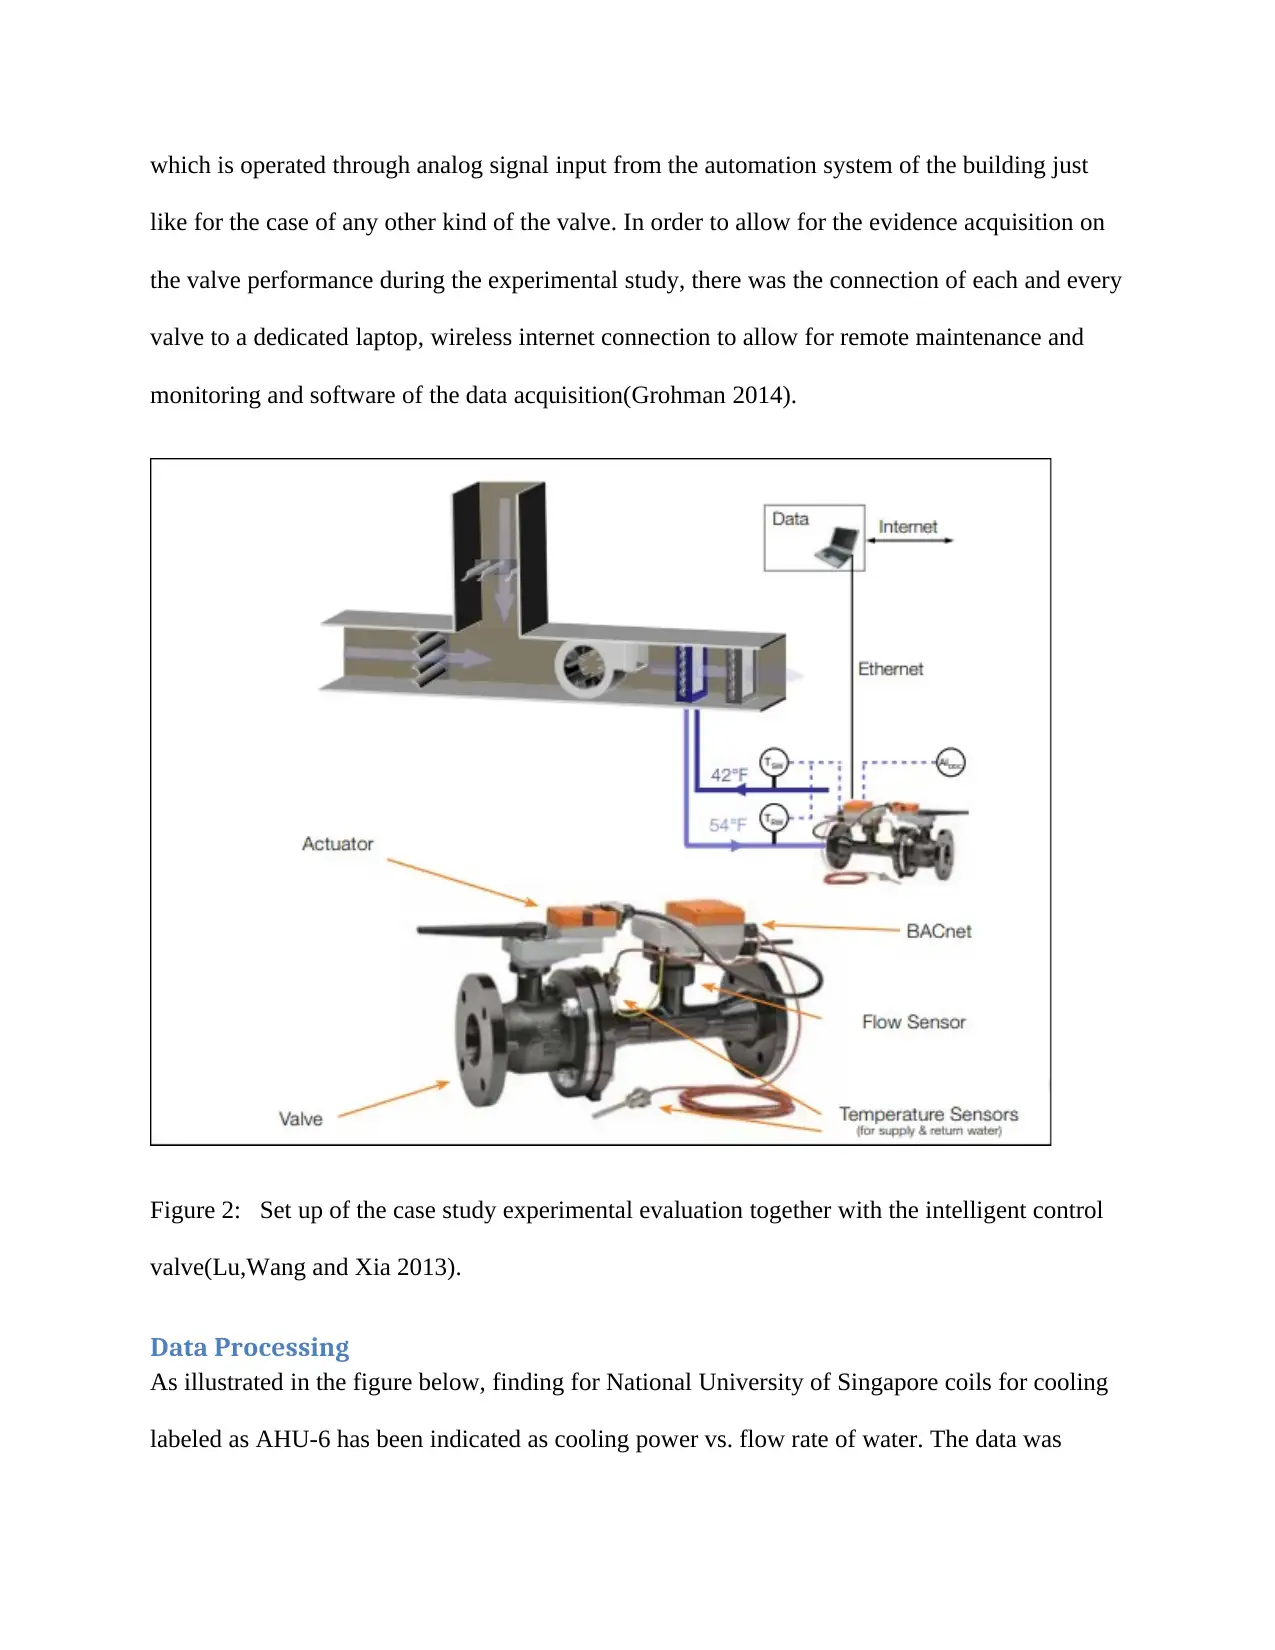
which is operated through analog signal input from the automation system of the building just
like for the case of any other kind of the valve. In order to allow for the evidence acquisition on
the valve performance during the experimental study, there was the connection of each and every
valve to a dedicated laptop, wireless internet connection to allow for remote maintenance and
monitoring and software of the data acquisition(Grohman 2014).
Figure 2: Set up of the case study experimental evaluation together with the intelligent control
valve(Lu,Wang and Xia 2013).
Data Processing
As illustrated in the figure below, finding for National University of Singapore coils for cooling
labeled as AHU-6 has been indicated as cooling power vs. flow rate of water. The data was
Paraphrase This Document
Need a fresh take? Get an instant paraphrase of this document with our AI Paraphraser
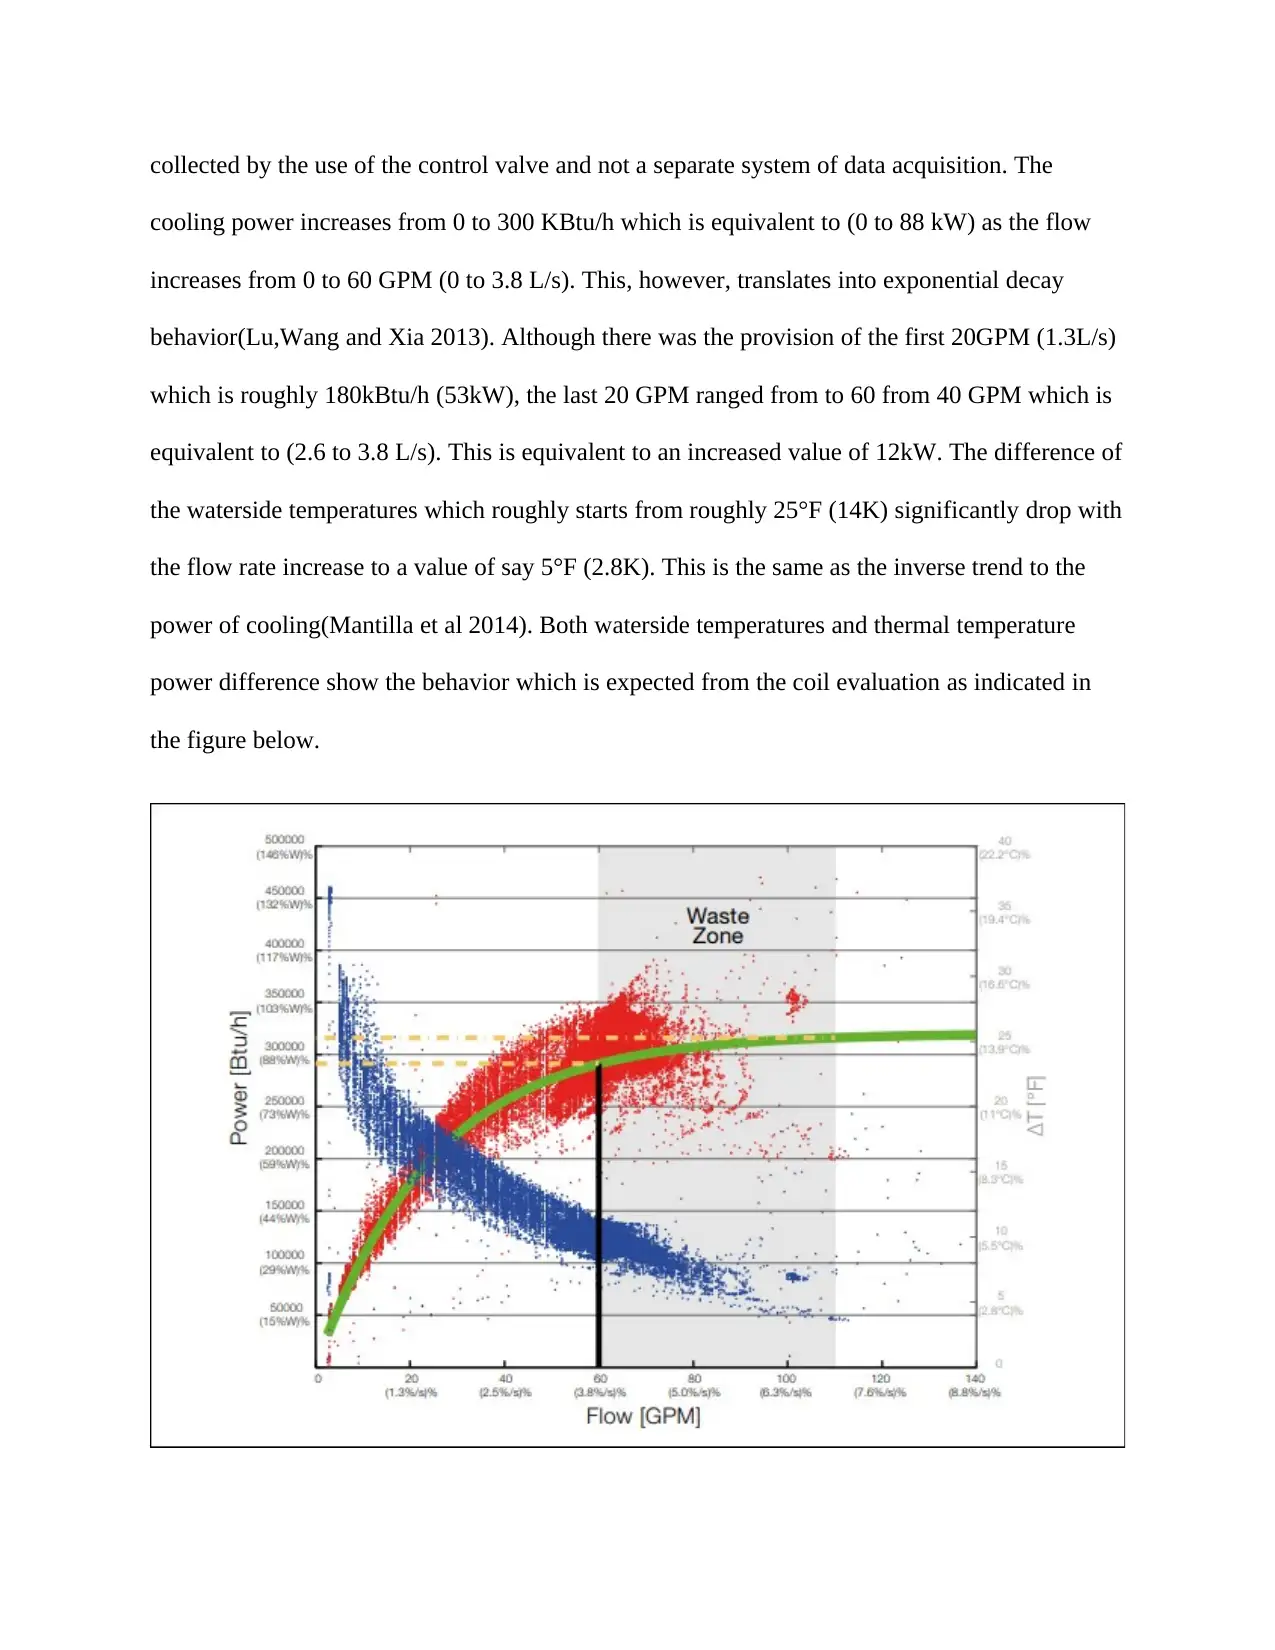
collected by the use of the control valve and not a separate system of data acquisition. The
cooling power increases from 0 to 300 KBtu/h which is equivalent to (0 to 88 kW) as the flow
increases from 0 to 60 GPM (0 to 3.8 L/s). This, however, translates into exponential decay
behavior(Lu,Wang and Xia 2013). Although there was the provision of the first 20GPM (1.3L/s)
which is roughly 180kBtu/h (53kW), the last 20 GPM ranged from to 60 from 40 GPM which is
equivalent to (2.6 to 3.8 L/s). This is equivalent to an increased value of 12kW. The difference of
the waterside temperatures which roughly starts from roughly 25°F (14K) significantly drop with
the flow rate increase to a value of say 5°F (2.8K). This is the same as the inverse trend to the
power of cooling(Mantilla et al 2014). Both waterside temperatures and thermal temperature
power difference show the behavior which is expected from the coil evaluation as indicated in
the figure below.
Figure 3: Performance of the cooling Coil(Lu,Wang and Xia 2013)
The ability of the intelligent control valves to effectively monitor the entire cooling as delivered
when compared with the flow rate enable for the coil response characterization. The changes
would be easily recognized in the characteristics of the coil over time so as to allow for the
detection of the fault(Monteiro et al.2012). As expected from the analysis an impact of reducing
return coils output with the increasing flow of water is evident as had been shown in the figure.
In case it would be possible for the operator to know the marginal benefit of the 20GMP
pumping via AHU-6 as well as the corresponding temperature difference from 14 to 10°F (7.8 to
5.6K), it would be easier for the pump power and additional flow to be determined. The
determination of the effect of saturation may not be significant considering that it depends on the
state of entering air particularly on the temperature of the entering water(Du et al.2014).
It is important to note that monitoring of the flow curve vs. Power, the definition of the waste
zone would be by a ΔT as the limit. All these values are closely connected to each other. The
manager of ΔT will be interested in the implementation of a flow limit or just the operation of a
ΔT limit. Depending on the kind of the application, there may be a preference of one setting over
the existing one. In the case, if the National University of Singapore this particular strategy
evidently offered perfect results(Fang et al 2013).
HVAC-Cx
This is a type of software that allows for the interaction of the users with the past as well as the
current information from building structures compost of BACnet facilitated Building Automation
System (BAS). As a tool, HVAC-Cx is purposefully to enhance the analysis as well as testing on
the building mechanical system. Building operators together with commissioning agents by use
of HVAC-Cx can take a close watch on the concert of logics in buildings or group of buildings.
⊘ This is a preview!⊘
Do you want full access?
Subscribe today to unlock all pages.
Trusted by 1+ million students worldwide
1 out of 28
Related Documents


Your All-in-One AI-Powered Toolkit for Academic Success.
+13062052269
info@desklib.com
Available 24*7 on WhatsApp / Email
![[object Object]](/_next/static/media/star-bottom.7253800d.svg)
Unlock your academic potential
Copyright © 2020–2026 A2Z Services. All Rights Reserved. Developed and managed by ZUCOL.