Data Analysis: Air and GHG Emissions Report - ITECH7406
VerifiedAdded on 2023/01/11
|22
|4471
|25
Report
AI Summary
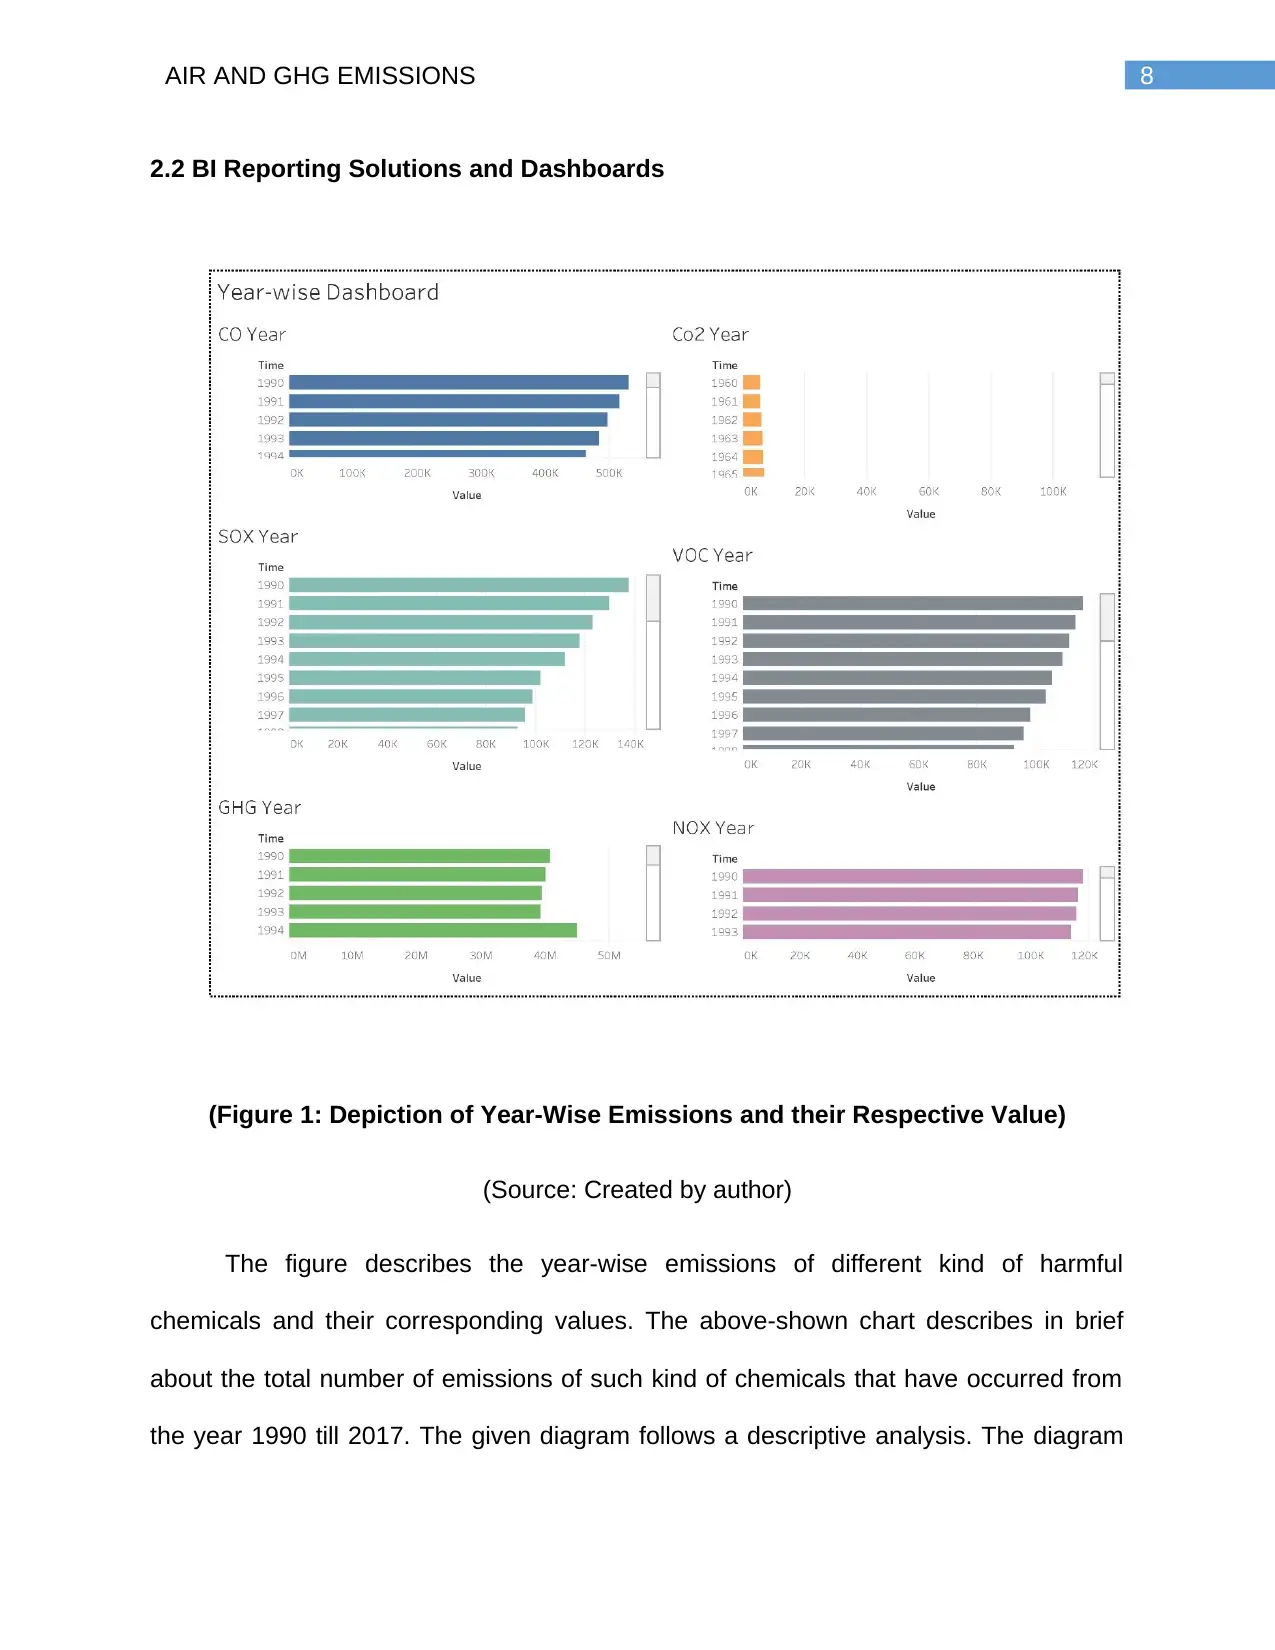
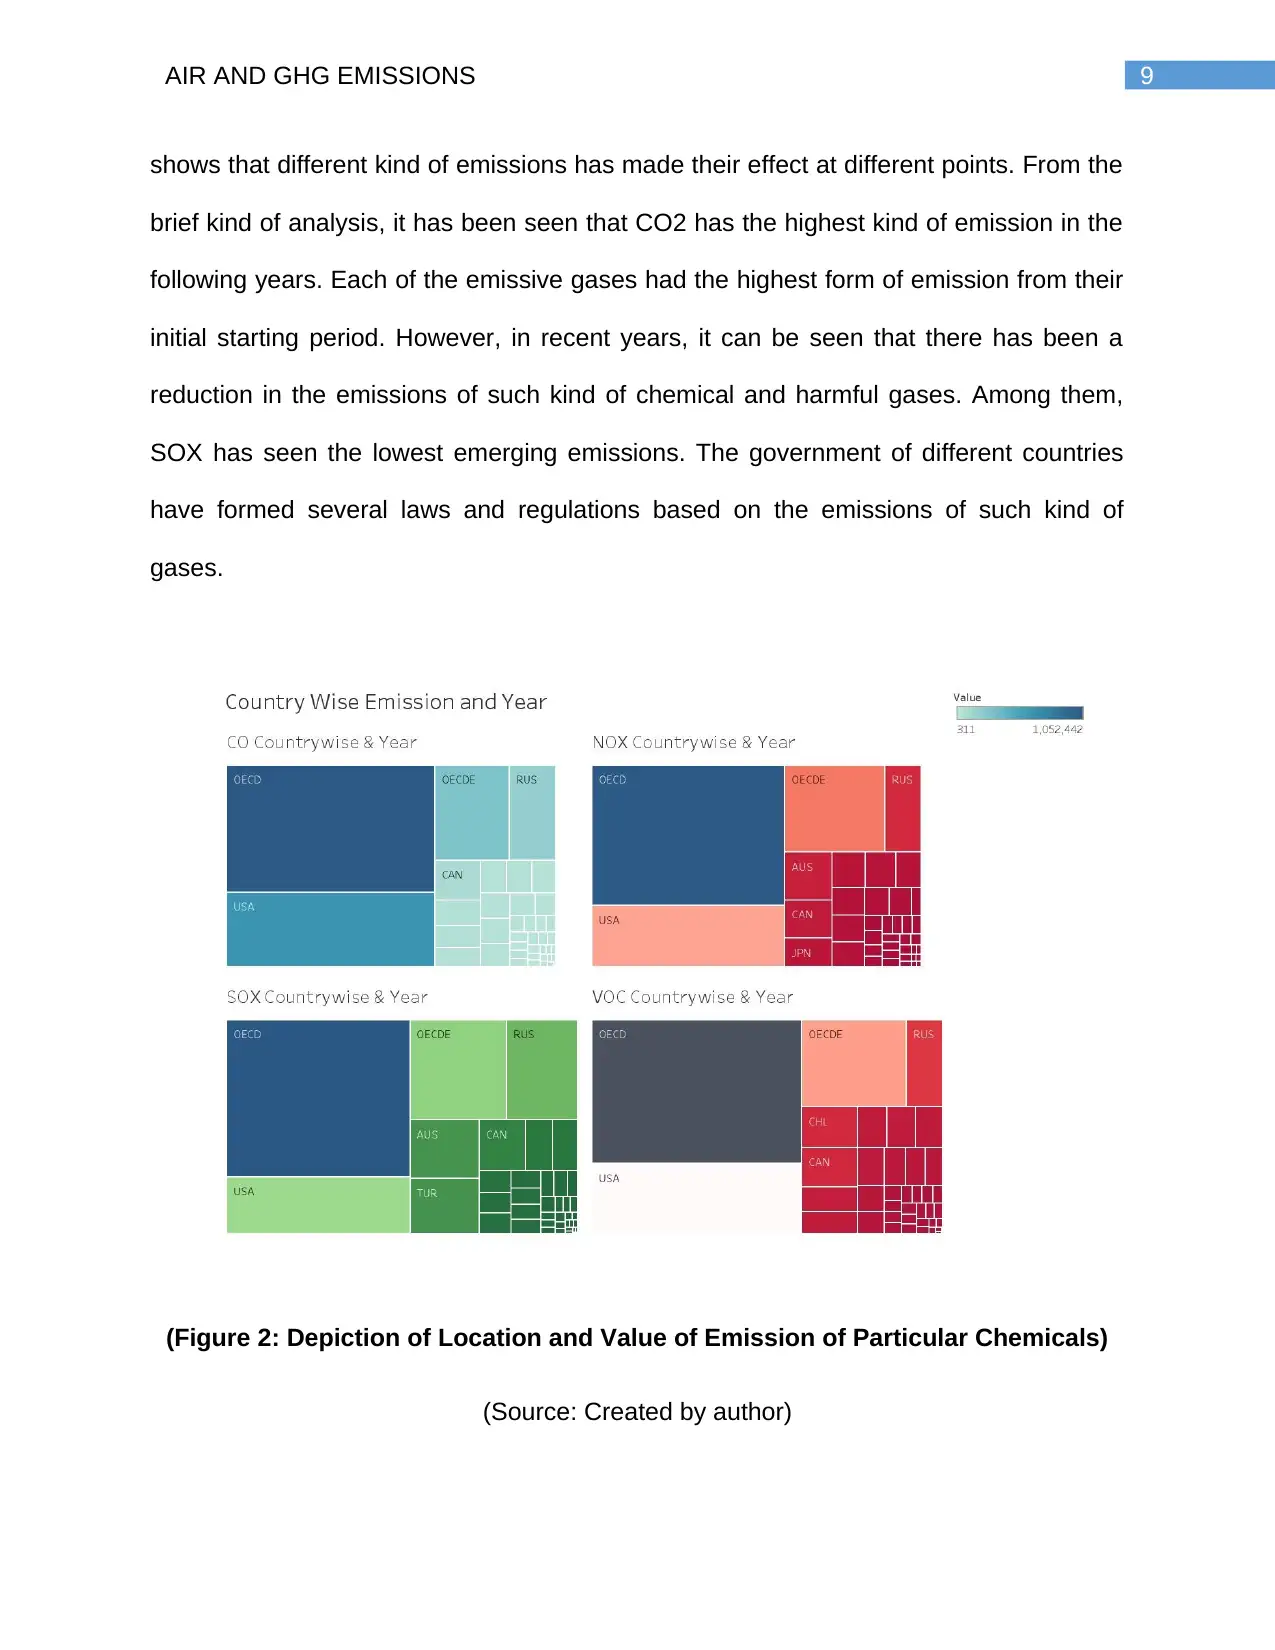
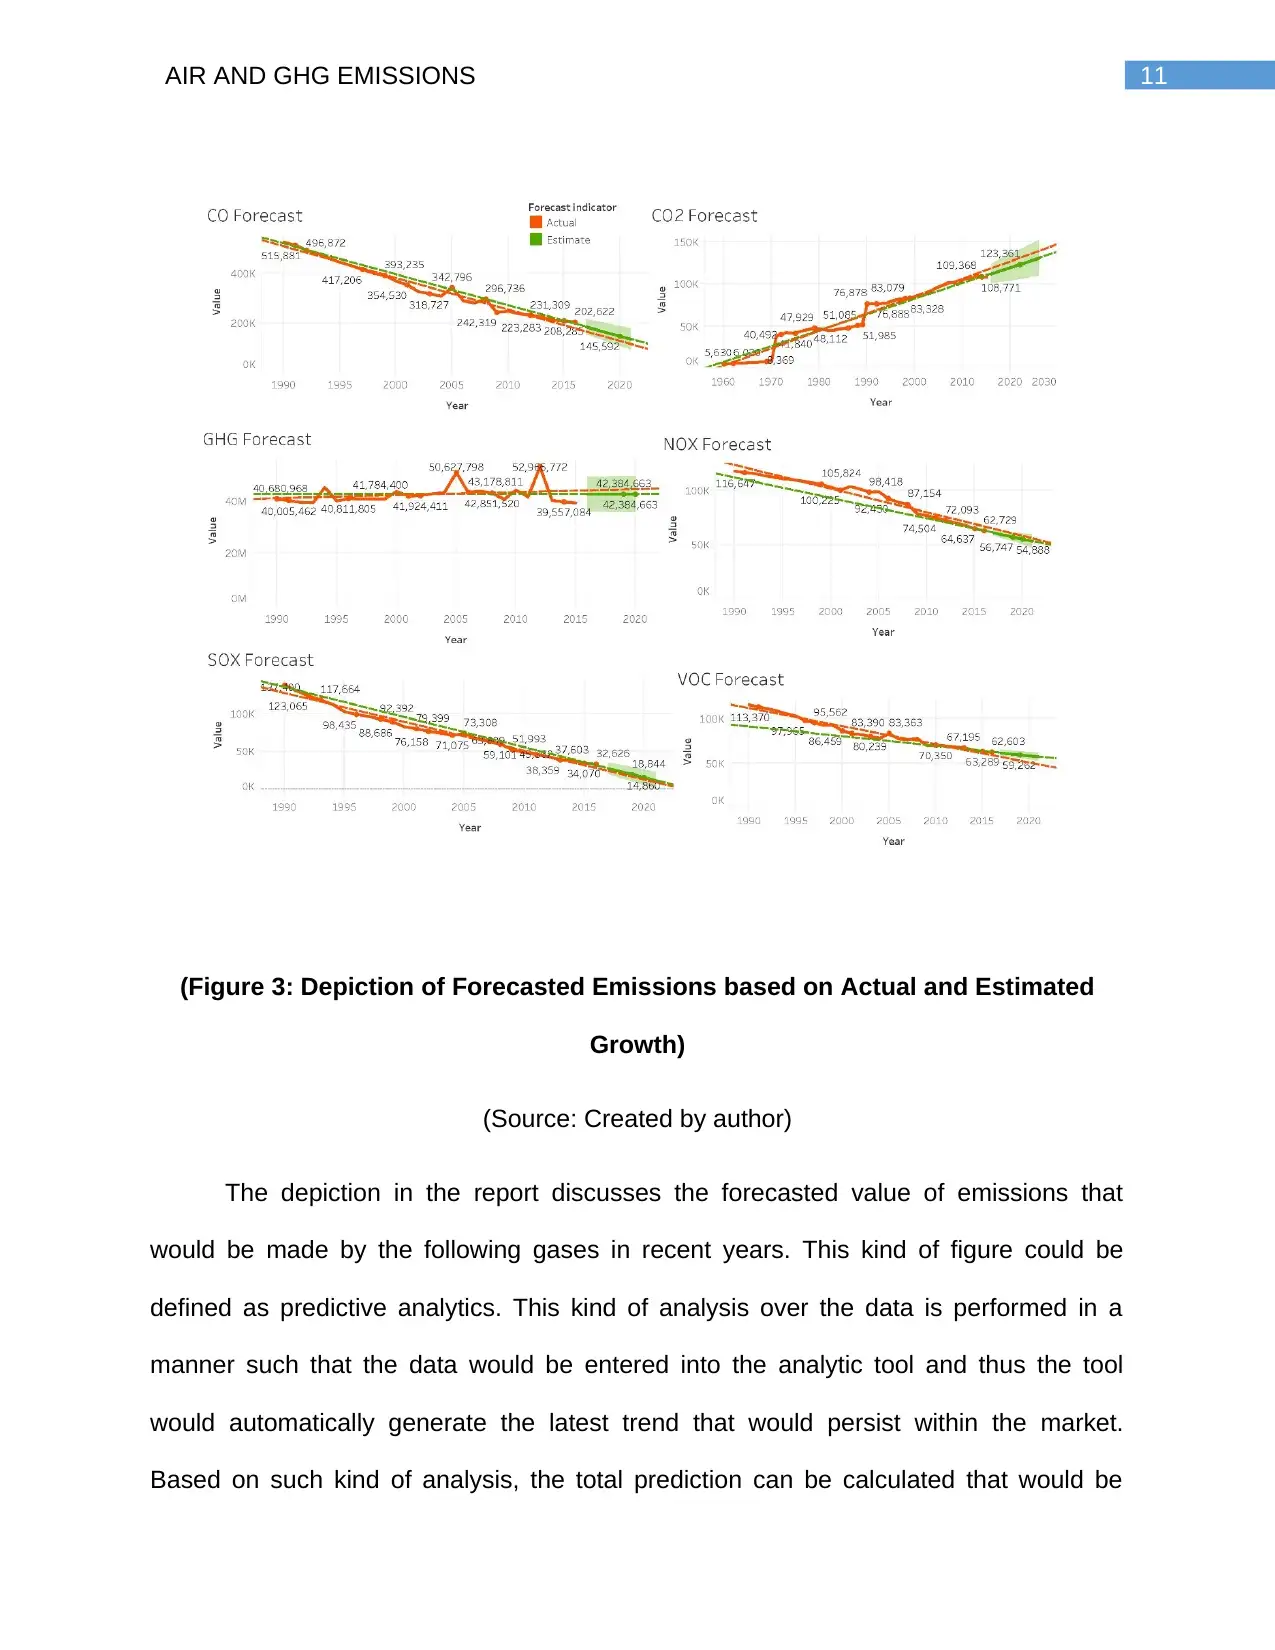
This report analyzes air and greenhouse gas (GHG) emissions, focusing on their environmental impact and the use of business analytics for data interpretation. The report examines the increasing levels of harmful emissions and their effects on air quality and the agricultural sector, utilizing data collected from OECD countries. It explores the application of business intelligence tools, including BI reporting solutions and dashboards, to visualize and interpret emission trends from 1990 to 2017. The analysis includes year-wise emission trends, geographic distribution of emissions, and forecasted emission values, offering insights through descriptive and predictive analytics. The report highlights the use of business analytics for identifying patterns, trends, and making informed decisions related to environmental concerns, with a focus on CO2, SOX, and other harmful emissions, and their impact on the farming industry. It also provides visualizations to show the emission patterns of various gases and their respective values. This report provides a comprehensive overview of the environmental issues and the application of business intelligence to address them.

Running head: AIR AND GHG EMISSIONS
Air and GHG emissions
Name of the Student
Name of the University
Author note
Air and GHG emissions
Name of the Student
Name of the University
Author note
Paraphrase This Document
Need a fresh take? Get an instant paraphrase of this document with our AI Paraphraser

1AIR AND GHG EMISSIONS
Executive Summary
The discussion in this report focuses on the major forms of impacts that would be made
with the impact of air emissions. In recent times, it has been seen that there is a huge
rise in such kind of harmful emissions. This has thus resulted in the rise of significant
problems based on the different kind of environmental problems. Various kind of traces
of chemicals and gases have been found to exist in recent times that have led to huge
kind of problems for the people. This has further resulted in problems for the people and
also for the farming industry. The discussion in this report puts a major kind of focus on
the rise of such kind of emissions in air that has put impact over the people and majorly
the farming sector. With the rise of such kind of emissions, the quality of air is also
decreasing. This report focuses on the gathered data collected from the OECD
countries. These countries are facing a major kind of problem-based on the rising
number of emissions that are being made with the rise of such harmful emissions.
These kind of emissions are thus making the lives of the people to be degrading. The
quality of air that is being inhaled by people is also decreasing. Such kind of data is
being processed with the help of business analytics tools that would further degrade the
quality of service in the air. Hence, this report would be critical in understanding a brief
of the emissions that are impacting the globally located countries.

2AIR AND GHG EMISSIONS
Table of Contents
1. Introduction....................................................................................................................3
2. Discussion......................................................................................................................4
2.1 Discussion on Business Analytics...........................................................................4
2.2 BI Reporting Solutions and Dashboards..................................................................7
3. Conclusion...................................................................................................................12
4. Cover Letter.................................................................................................................14
References.......................................................................................................................15
Bibliography.....................................................................................................................17
⊘ This is a preview!⊘
Do you want full access?
Subscribe today to unlock all pages.

Trusted by 1+ million students worldwide

3AIR AND GHG EMISSIONS
1. Introduction
In recent times, there is a huge rise in greenhouse gases that have led to
tremendous forms of harmful effects for the planet. The greenhouse gases generally
refer to the total sum of seven gases, which form their direct form of effects on the
changing effects of the climate (Seager et al., 2014). The seven different kinds of gases
that form the total seven gases are referred as: methane (CH4), carbon dioxide (CO2),
nitrous oxide (N2O), chlorofluorocarbons (CFSs), perfluorocarbons (PFCs), nitrogen
trifluoride (NF3) and sulphur hexafluoride (SF6). The data gathered from the different
kind of emissions would be based on the equivalents of CO2 and thus they refer to the
gross kind of direct emissions based on the different forms of activities performed by
humans (Nisbet, Dlugokencky & Bousquet, 2014). CO2 refers to the direct forms of
emerging gas emissions that have been formed from the combustion of fuel. The
primary form of data is gathered and formed by the International Energy Agency.
These different kinds of gas emissions form a major effect over the farming
industry. Both the terms climate change and agriculture could be intertwined together.
The different forms of effects formed by the emission of gases have a direct effect on
climate change and also form a major impact on global warming ( Smil, 2014). With the
passage of time, global warming forms a major kind of effect over the process of food
supply and agricultural growth. With the intensifying pressure of global farming based
on global emissions, the major effect is being produced over the factors of production of
crops. The discussion in this report would focus on the use of business intelligence tools
for depicting the different forms of analysis over the data collected from sources.
Paraphrase This Document
Need a fresh take? Get an instant paraphrase of this document with our AI Paraphraser

4AIR AND GHG EMISSIONS

5AIR AND GHG EMISSIONS
2. Discussion
2.1 Discussion on Business Analytics
In the recent times, there has been a major rise of different kind of platforms and
tools that are used together in the proper form of succession in order to prepare the
companies to analyse them and thus make use of them. There has been a rapid growth
in the different form of use of technologies (Holsapple, Lee-Post & Pakath, 2014).
Different business from all over the world has made use of such kinds of business
analytic tools that would be used for performing a detailed form of analysis over
statistical data. Different kind of business analytics tool is used in collaboration for
assisting the business in performing various kind of operations based on the integration
of data, collaborating with the various forms of analytics and thus managing them in a
proper manner.
Business analytics forms a major portion of the business sectors. Business
analytics can be thus defined as the study of different forms of data for the purpose of
performing operations and statistical analysis (Gillon et al., 2014). The use of business
analytics would also be useful for forming a different kind of predictive models, applying
the techniques based on the optimization of data. This kind of analytic tool would also
allow the business form developing a partnership with other business partners and
various executives who make important kind of decisions based on the market
conditions. The process of business analytics requires the use of developing
quantitative methods and also performing analysis with the help of evidence-based data
(Schniederjans, Schniederjans & Starkey, 2014). Big Data is defined as a term that
generally describes the large volumes of data that is gathered from a wide range of
⊘ This is a preview!⊘
Do you want full access?
Subscribe today to unlock all pages.

Trusted by 1+ million students worldwide

6AIR AND GHG EMISSIONS
sources. This kind of data could be in both unstructured and structured form. Hence,
this data mostly inundates the daily process of the business. Whenever companies
would make use of Big Data, they would be making use of Business Analytics for
deriving the insights that would be required based on the making of better kind of
business decisions and thus would also be able to make strategic moves that would suit
to the perspectives of the business.
In the discussion that would be presented for the report, the different kind of
characteristics and trends would be evaluated based on the emission of different kind of
gases, which majorly put an effect over the farming industry (Noe et al., 2017). With the
emission of different kind of harmful gases, there is a major kind of problem that is
primarily arising for the farming industry. the primary form of data has been gathered
from the Organisation for Economic Co-operation and Development (OECD), which is
an international organisation. OECD primarily works for the purpose of building different
kind of policies based on determining the lives of individuals and thus building a better
kind of society (Sun, Strang & Firmin, 2017). The primary goal of OECD is to define and
thus shape various policies for fostering equality, prosperity and thus bringing
opportunity for everyone. The detailed analysis that would be drawn would be based on
the effects made by the different forms of emissions on air and climate. The changes in
climate conditions would further make a major impact over the farming sector and would
also form their presence in the OECD countries (Göb, 2014). The dataset would further
help in presenting the vast forms of trends based on determining the man-made
emissions based on different kind of major air pollutants from different collectible
sources.
Paraphrase This Document
Need a fresh take? Get an instant paraphrase of this document with our AI Paraphraser

7AIR AND GHG EMISSIONS
The dataset that is presented contains a total number of 26472 data, which has
been further classified according to different parameters. The dataset comprises of six
main rows over which different kind of analysis would be performed. The first column in
the dataset discusses the location of the country over which the emissions have made
their major impacts. The second column discusses the type of emission that is being
made. The third column is defined as a subject, which details the gas that is being
emitted. In the dataset that is being presented, the different emissions are further
classified as CO, CO2, GHG, NOX, SOX and VOC. The fourth column in the dataset
discusses the particular measure at which the different harmful chemicals would be
emitted. The count is further determined in terms of million tonnes and a thousand
tonnes. The fifth column in the dataset discusses the year in which the different
emissions have been made. The sixth column depicts the value of emissions that have
been made in accordance with the various other kinds of parameters. The detailed
analysis of the observation and analysis from the dataset have been provided in the
next sections.

8AIR AND GHG EMISSIONS
2.2 BI Reporting Solutions and Dashboards
(Figure 1: Depiction of Year-Wise Emissions and their Respective Value)
(Source: Created by author)
The figure describes the year-wise emissions of different kind of harmful
chemicals and their corresponding values. The above-shown chart describes in brief
about the total number of emissions of such kind of chemicals that have occurred from
the year 1990 till 2017. The given diagram follows a descriptive analysis. The diagram
⊘ This is a preview!⊘
Do you want full access?
Subscribe today to unlock all pages.

Trusted by 1+ million students worldwide

9AIR AND GHG EMISSIONS
shows that different kind of emissions has made their effect at different points. From the
brief kind of analysis, it has been seen that CO2 has the highest kind of emission in the
following years. Each of the emissive gases had the highest form of emission from their
initial starting period. However, in recent years, it can be seen that there has been a
reduction in the emissions of such kind of chemical and harmful gases. Among them,
SOX has seen the lowest emerging emissions. The government of different countries
have formed several laws and regulations based on the emissions of such kind of
gases.
(Figure 2: Depiction of Location and Value of Emission of Particular Chemicals)
(Source: Created by author)
Paraphrase This Document
Need a fresh take? Get an instant paraphrase of this document with our AI Paraphraser

10AIR AND GHG EMISSIONS
In this diagram, the emissions of gases and chemicals have been seen to have
an emissive value. The different kind of values that have been shown in the figure
describes the total number of emissions that are made by different countries. The
different kind of emissions that are made in various countries is defined in ascending
order. The different values that are emitted from the emissive gases are being depicted
in the figure. The different kind of countries is depicted in terms of colours. The total
value of emission of the gases is based in the range of 311 till 1,052,442. The countries,
which have the highest number of emissions of such gases is OECD and the lowest
number of emissions is based in Luxemburg. From the discussed scenario, it can be
seen that the different forms of emissions are forming a major effect over the countries.
Although some countries have taken various kind of measures for reducing the number
of emissions, yet most of the countries have the highest number of emissions of harmful
gases and chemicals. These countries should take different forms of measures based
on reducing the number of emissions that have been made by the countries. Such kind
of emissions should be highly reduced in order to bring in better kind of effects towards
the countries. This kind of analysis could be defined as a descriptive form of analysis.

11AIR AND GHG EMISSIONS
(Figure 3: Depiction of Forecasted Emissions based on Actual and Estimated
Growth)
(Source: Created by author)
The depiction in the report discusses the forecasted value of emissions that
would be made by the following gases in recent years. This kind of figure could be
defined as predictive analytics. This kind of analysis over the data is performed in a
manner such that the data would be entered into the analytic tool and thus the tool
would automatically generate the latest trend that would persist within the market.
Based on such kind of analysis, the total prediction can be calculated that would be
⊘ This is a preview!⊘
Do you want full access?
Subscribe today to unlock all pages.

Trusted by 1+ million students worldwide
1 out of 22
Related Documents
Your All-in-One AI-Powered Toolkit for Academic Success.
+13062052269
info@desklib.com
Available 24*7 on WhatsApp / Email
Unlock your academic potential
Copyright © 2020–2025 A2Z Services. All Rights Reserved. Developed and managed by ZUCOL.


