CLIMATIC AND ENVIRONMENTAL IMAGE OF AIR INDUSTRY ANALYSIS REPORT
VerifiedAdded on  2022/08/13
|6
|907
|12
Report
AI Summary
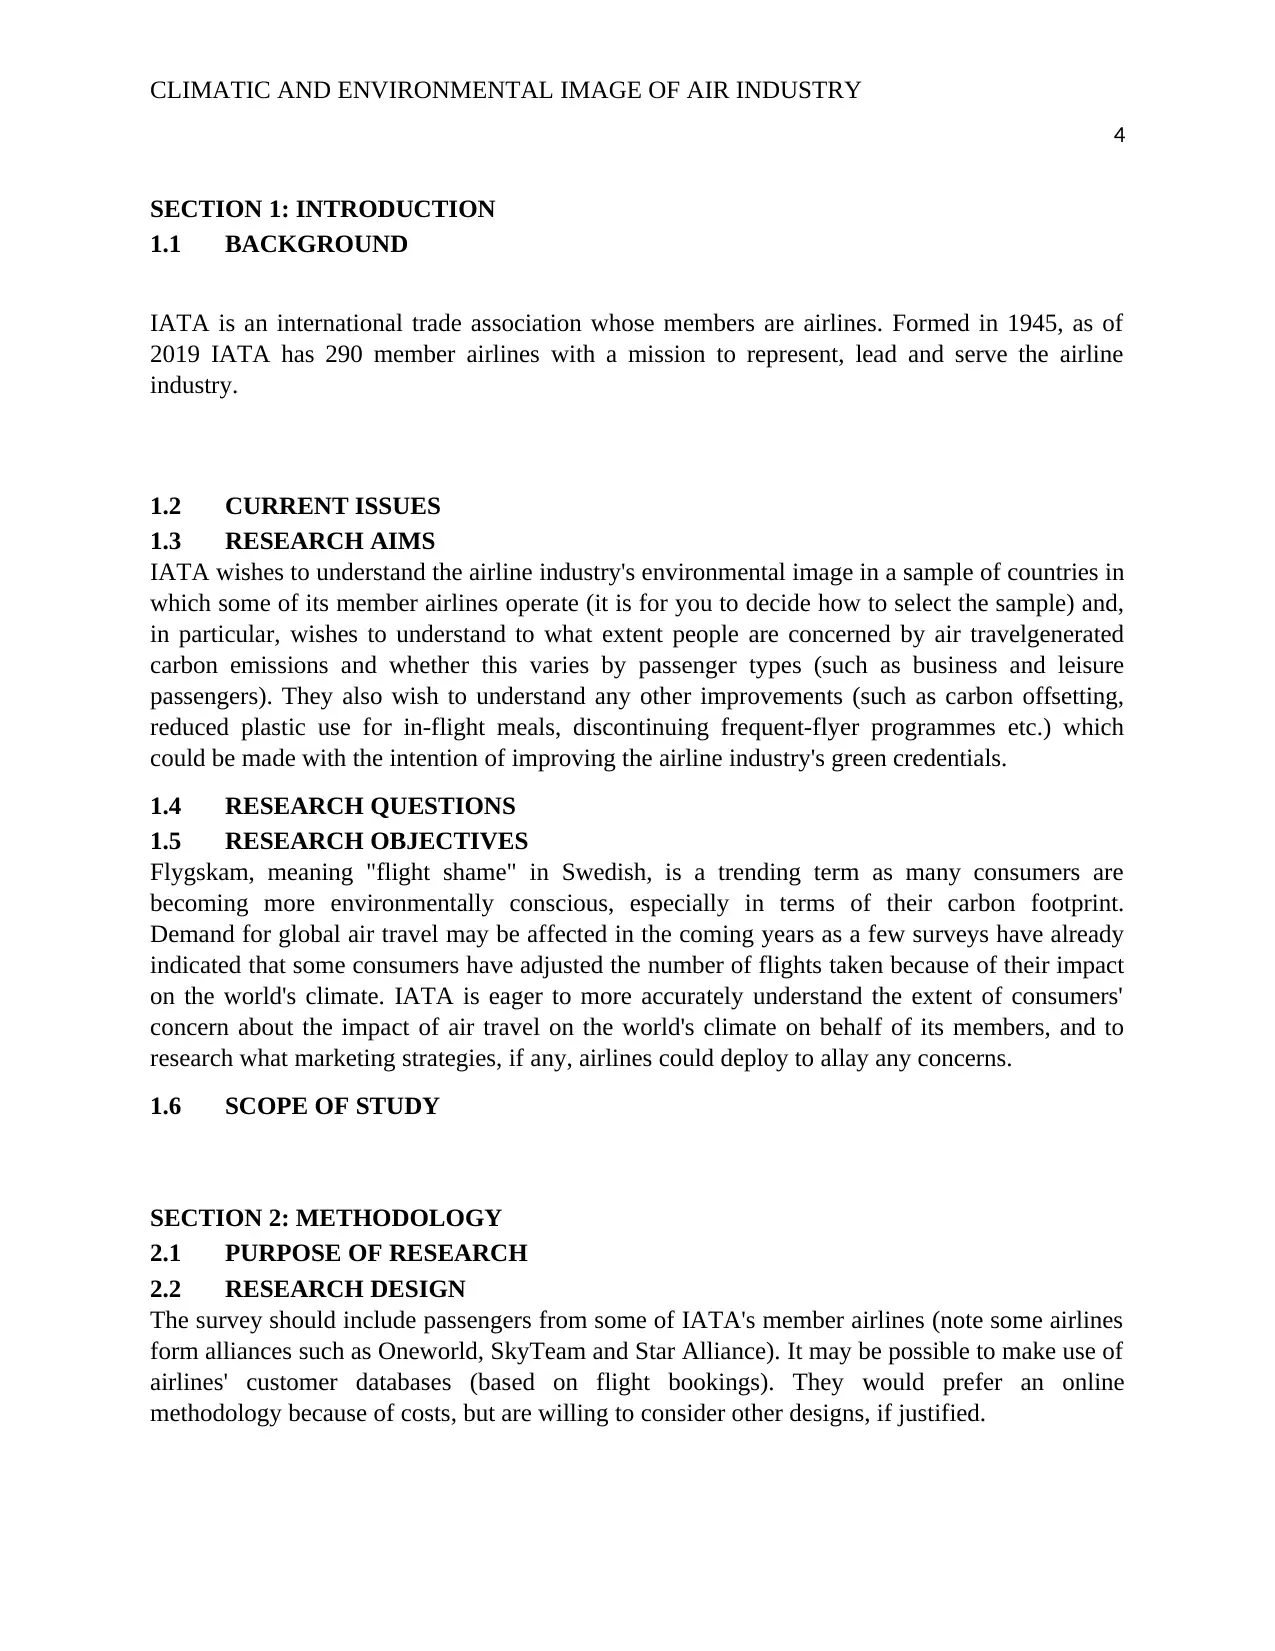
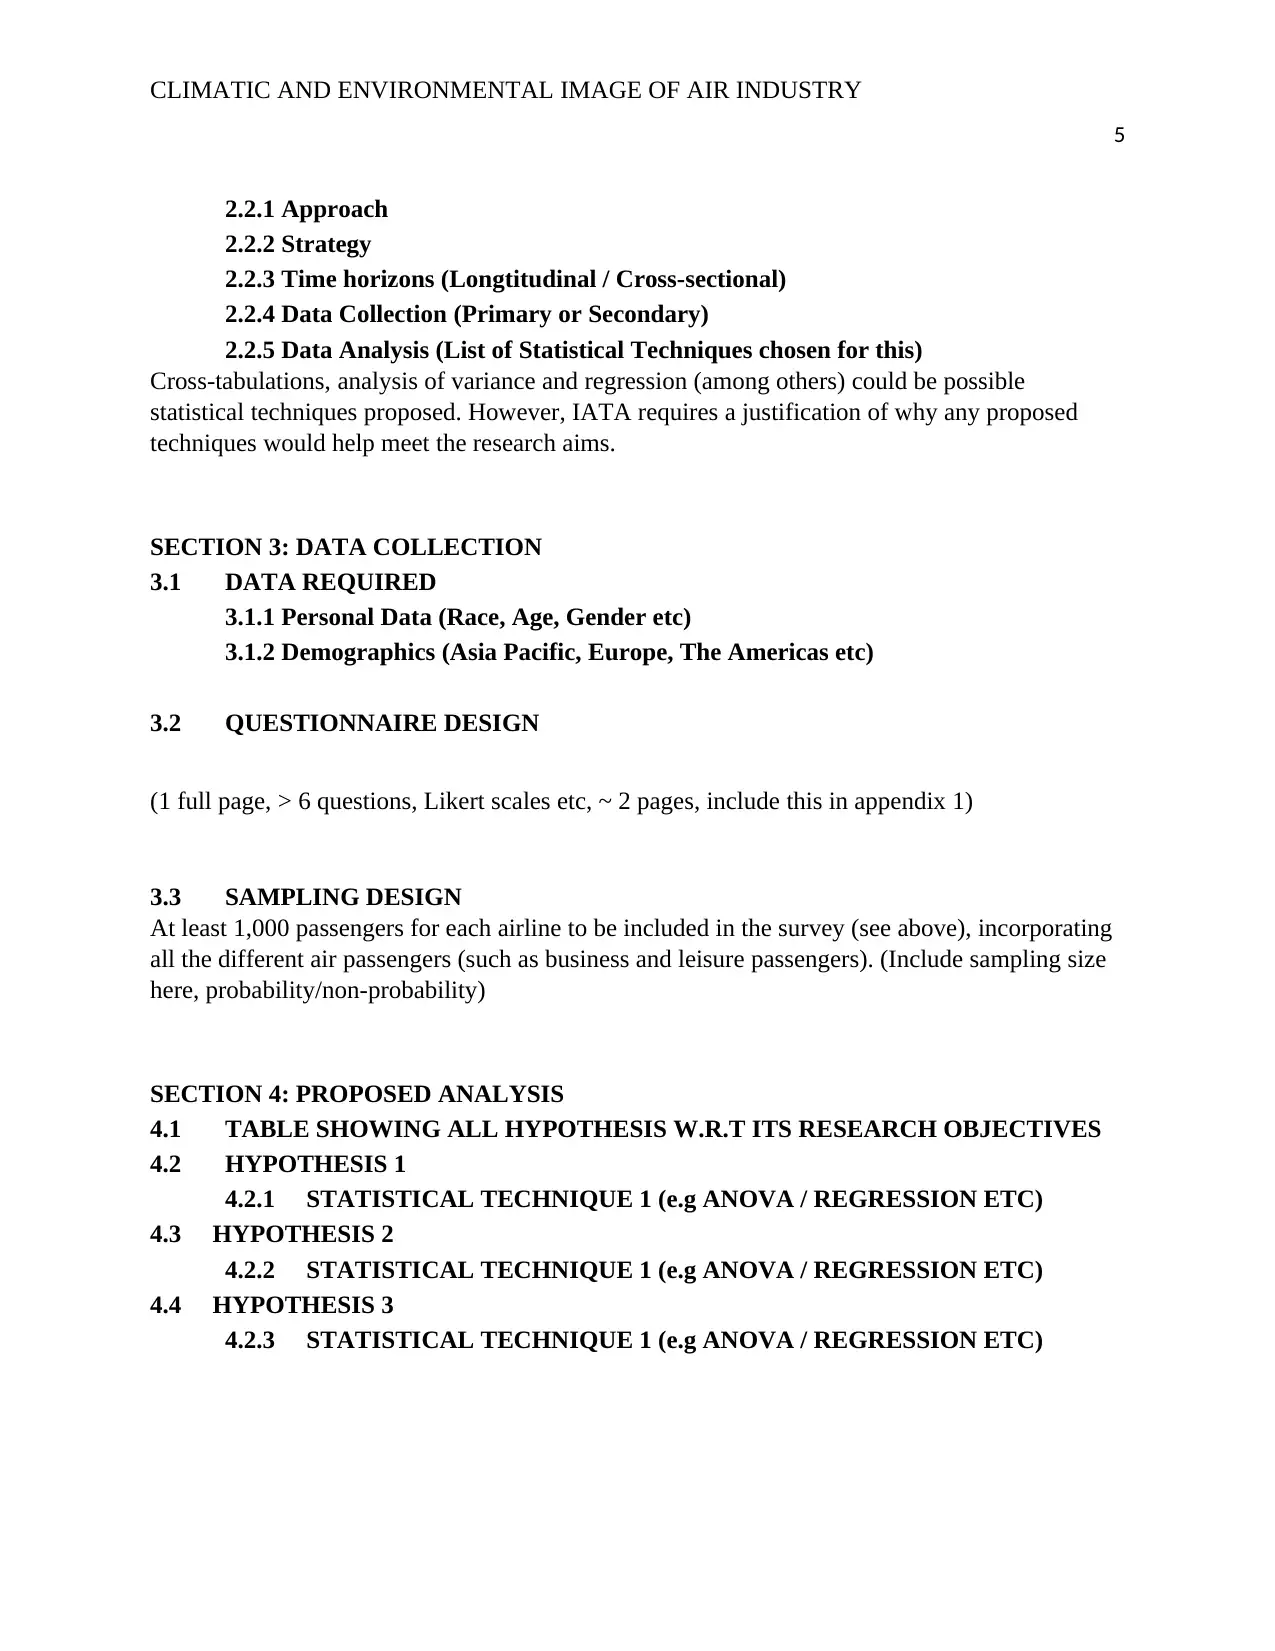
This report analyzes the climatic and environmental image of the air industry, focusing on behalf of IATA. It aims to understand consumer concerns regarding air travel-generated carbon emissions, differentiating between business and leisure passengers, and to identify potential marketing strategies to mitigate these concerns. The research includes a detailed methodology section, covering research design, data collection methods (questionnaire design, sampling), and proposed analysis techniques (cross-tabulations, ANOVA, regression). The report also outlines a proposed schedule, cost breakdown, and team structure for conducting the research, including a Gantt chart and cost analysis. Furthermore, it explores potential further research areas and recommendations for the airline industry to improve its environmental image, addressing issues such as carbon offsetting, plastic use, and frequent-flyer programs.

CLIMATIC AND ENVIRONMENTAL IMAGE OF AIR INDUSTRY
1
ANALYSIS OF THE CLIMATIC AND ENVIRONMENTAL IMAGE OF AIR INDUSTRY
Name of Institution:
Name of Author:
Date:
1
ANALYSIS OF THE CLIMATIC AND ENVIRONMENTAL IMAGE OF AIR INDUSTRY
Name of Institution:
Name of Author:
Date:
Paraphrase This Document
Need a fresh take? Get an instant paraphrase of this document with our AI Paraphraser

CLIMATIC AND ENVIRONMENTAL IMAGE OF AIR INDUSTRY
2
EXECUTIVE SUMMARY
2
EXECUTIVE SUMMARY

CLIMATIC AND ENVIRONMENTAL IMAGE OF AIR INDUSTRY
3
Table of Contents
SECTION 1: INTRODUCTION.....................................................................................................4
1.1 BACKGROUND..............................................................................................................4
1.2 CURRENT ISSUES..........................................................................................................4
1.3 RESEARCH AIMS...........................................................................................................4
1.4 RESEARCH QUESTIONS...............................................................................................4
1.5 RESEARCH OBJECTIVES.............................................................................................4
1.6 SCOPE OF STUDY..........................................................................................................4
SECTION 2: METHODOLOGY....................................................................................................4
2.1 PURPOSE OF RESEARCH.............................................................................................4
2.2 RESEARCH DESIGN......................................................................................................4
2.2.1 Approach.........................................................................................................................4
2.2.2 Strategy............................................................................................................................4
2.2.3 Time horizons (Longtitudinal / Cross-sectional).............................................................4
2.2.4 Data Collection (Primary or Secondary).........................................................................4
2.2.5 Data Analysis (List of Statistical Techniques chosen for this).......................................4
SECTION 3: DATA COLLECTION..............................................................................................4
3.1 DATA REQUIRED..........................................................................................................4
3.1.1 Personal Data (Race, Age, Gender etc)...........................................................................4
3.1.2 Demographics (Asia Pacific, Europe, The Americas etc)...............................................4
3.2 QUESTIONNAIRE DESIGN...........................................................................................4
3.3 SAMPLING DESIGN.......................................................................................................4
SECTION 4: PROPOSED ANALYSIS..........................................................................................5
4.1 TABLE SHOWING ALL HYPOTHESIS W.R.T ITS RESEARCH OBJECTIVES......5
4.2 HYPOTHESIS 1...............................................................................................................5
4.2.1 STATISTICAL TECHNIQUE 1 (e.g ANOVA / REGRESSION ETC).....................5
4.3 HYPOTHESIS 2................................................................................................................5
4.2.2 STATISTICAL TECHNIQUE 1 (e.g ANOVA / REGRESSION ETC).....................5
4.4 HYPOTHESIS 3................................................................................................................5
4.2.3 STATISTICAL TECHNIQUE 1 (e.g ANOVA / REGRESSION ETC).....................5
SECTION 5: SCHEDULE/COSTS/TEAM STRUCTURE............................................................5
SECTION 6: FURTHER RESEARCH / RECOMMENDATIONS...............................................5
⊘ This is a preview!⊘
Do you want full access?
Subscribe today to unlock all pages.

Trusted by 1+ million students worldwide

CLIMATIC AND ENVIRONMENTAL IMAGE OF AIR INDUSTRY
4
SECTION 1: INTRODUCTION
1.1 BACKGROUND
IATA is an international trade association whose members are airlines. Formed in 1945, as of
2019 IATA has 290 member airlines with a mission to represent, lead and serve the airline
industry.
1.2 CURRENT ISSUES
1.3 RESEARCH AIMS
IATA wishes to understand the airline industry's environmental image in a sample of countries in
which some of its member airlines operate (it is for you to decide how to select the sample) and,
in particular, wishes to understand to what extent people are concerned by air travelgenerated
carbon emissions and whether this varies by passenger types (such as business and leisure
passengers). They also wish to understand any other improvements (such as carbon offsetting,
reduced plastic use for in-flight meals, discontinuing frequent-flyer programmes etc.) which
could be made with the intention of improving the airline industry's green credentials.
1.4 RESEARCH QUESTIONS
1.5 RESEARCH OBJECTIVES
Flygskam, meaning "flight shame" in Swedish, is a trending term as many consumers are
becoming more environmentally conscious, especially in terms of their carbon footprint.
Demand for global air travel may be affected in the coming years as a few surveys have already
indicated that some consumers have adjusted the number of flights taken because of their impact
on the world's climate. IATA is eager to more accurately understand the extent of consumers'
concern about the impact of air travel on the world's climate on behalf of its members, and to
research what marketing strategies, if any, airlines could deploy to allay any concerns.
1.6 SCOPE OF STUDY
SECTION 2: METHODOLOGY
2.1 PURPOSE OF RESEARCH
2.2 RESEARCH DESIGN
The survey should include passengers from some of IATA's member airlines (note some airlines
form alliances such as Oneworld, SkyTeam and Star Alliance). It may be possible to make use of
airlines' customer databases (based on flight bookings). They would prefer an online
methodology because of costs, but are willing to consider other designs, if justified.
Paraphrase This Document
Need a fresh take? Get an instant paraphrase of this document with our AI Paraphraser

CLIMATIC AND ENVIRONMENTAL IMAGE OF AIR INDUSTRY
5
2.2.1 Approach
2.2.2 Strategy
2.2.3 Time horizons (Longtitudinal / Cross-sectional)
2.2.4 Data Collection (Primary or Secondary)
2.2.5 Data Analysis (List of Statistical Techniques chosen for this)
Cross-tabulations, analysis of variance and regression (among others) could be possible
statistical techniques proposed. However, IATA requires a justification of why any proposed
techniques would help meet the research aims.
SECTION 3: DATA COLLECTION
3.1 DATA REQUIRED
3.1.1 Personal Data (Race, Age, Gender etc)
3.1.2 Demographics (Asia Pacific, Europe, The Americas etc)
3.2 QUESTIONNAIRE DESIGN
(1 full page, > 6 questions, Likert scales etc, ~ 2 pages, include this in appendix 1)
3.3 SAMPLING DESIGN
At least 1,000 passengers for each airline to be included in the survey (see above), incorporating
all the different air passengers (such as business and leisure passengers). (Include sampling size
here, probability/non-probability)
SECTION 4: PROPOSED ANALYSIS
4.1 TABLE SHOWING ALL HYPOTHESIS W.R.T ITS RESEARCH OBJECTIVES
4.2 HYPOTHESIS 1
4.2.1 STATISTICAL TECHNIQUE 1 (e.g ANOVA / REGRESSION ETC)
4.3 HYPOTHESIS 2
4.2.2 STATISTICAL TECHNIQUE 1 (e.g ANOVA / REGRESSION ETC)
4.4 HYPOTHESIS 3
4.2.3 STATISTICAL TECHNIQUE 1 (e.g ANOVA / REGRESSION ETC)

CLIMATIC AND ENVIRONMENTAL IMAGE OF AIR INDUSTRY
6
SECTION 5: SCHEDULE/COSTS/TEAM STRUCTURE
- Include a table indicating the activities needed to carry this out in this market research
- Gannt Chart
- Costs (Total ~100k, include the breakdown in a table format - e.g Logistics, FLights, Analysis,
Primary Data collection etc)
- Time ~ 3-4 months
ATA has a large budget and would like the research to be completed
within a six-month window.
SECTION 6: FURTHER RESEARCH / RECOMMENDATIONS
⊘ This is a preview!⊘
Do you want full access?
Subscribe today to unlock all pages.

Trusted by 1+ million students worldwide
1 out of 6
Related Documents

Your All-in-One AI-Powered Toolkit for Academic Success.
 +13062052269
info@desklib.com
Available 24*7 on WhatsApp / Email
Unlock your academic potential
Copyright © 2020–2025 A2Z Services. All Rights Reserved. Developed and managed by ZUCOL.