Detailed Financial Analysis of Air New Zealand Limited: A Ratio Report
VerifiedAdded on 2019/09/30
|20
|2919
|226
Report
AI Summary
This report presents a financial ratio analysis of Air New Zealand Limited, examining the company's performance for the year 2016. The analysis includes profitability ratios, financial stability metrics, and asset utilization assessments, providing insights into the company's ability to generate earnings, manage its finances, and efficiently use its assets. The report also delves into the share market performance, price-earnings ratio, and non-financial information, including environmental and social issues. The conclusion provides recommendations for the company, focusing on cost control, revenue generation, debt management, and customer service improvements. The report utilizes data from financial statements and industry benchmarks to provide a comprehensive overview of Air New Zealand Limited's financial health and market position.

Running head: FINANCIAL RATIO ANALYSIS
Financial ratio analysis
[Document subtitle]
[DATE]
[Company name]
[Company address]
Financial ratio analysis
[Document subtitle]
[DATE]
[Company name]
[Company address]
Paraphrase This Document
Need a fresh take? Get an instant paraphrase of this document with our AI Paraphraser
1
FINANCIAL RATIO ANALYSIS
Table of Contents
Introduction to Company..............................................................................................................2
Ratio Analysis.................................................................................................................................2
Profitability of the Company........................................................................................................2
Financial Stability of the Company.............................................................................................5
Asset Utilization of the Company................................................................................................6
Movement in Share Price of Company........................................................................................7
Price Earnings Ratio......................................................................................................................7
Definition.....................................................................................................................................7
Factors which influence Price Earnings ratio..............................................................................8
Share Market Ratio.......................................................................................................................9
Statement of Accounting Policies...............................................................................................10
Non-Financial Information.........................................................................................................10
Environmental and Social Issues...............................................................................................10
Conclusion and Recommendation..............................................................................................11
REFERENCES............................................................................................................................12
Appendix.......................................................................................................................................13
2
FINANCIAL RATIO ANALYSIS
Introduction to Company
Air New Zealand Limited is national airline based in New Zealand. The airline executes as per
the scheduled flights of the passenger to international and domestic destinations in various
nations near United Kingdom and Pacific Rim. Since the year 1999, the airline is a part of Star
Alliance. This report will analyze the financial performance and operations of the corporation for
the year 2016. This report aims to provide an analysis and assessment of the financial position,
performance, liquidity and profitability of the Air New Zealand Limited using the figures from
statements of fiancé for the year 2016. Financial ratios, in analysis, were utilized to earn
significant review of particular area of examination of performance of company. In the following
sections, the Profitability, financial stability and asset utilization of the company have been
discussed. Furthermore, the share market and price earnings ratio as well as the Non-Financial
information is detailed in this report to provide an overarching view of the company and give the
advice regarding investment decision in this company.
Ratio Analysis
Profitability of the Company
Profitability ratios are considered as most famous metrics to analyze the financial information.
They are significant as they are used for different comparative studies like industry benchmark
analysis and competitive analysis. They also assess the ability of the business to create more
earnings than the expenses.
Particulars Ratios (2013) Ratios (2014) Ratios (2015)
⊘ This is a preview!⊘
Do you want full access?
Subscribe today to unlock all pages.
Trusted by 1+ million students worldwide
3
FINANCIAL RATIO ANALYSIS
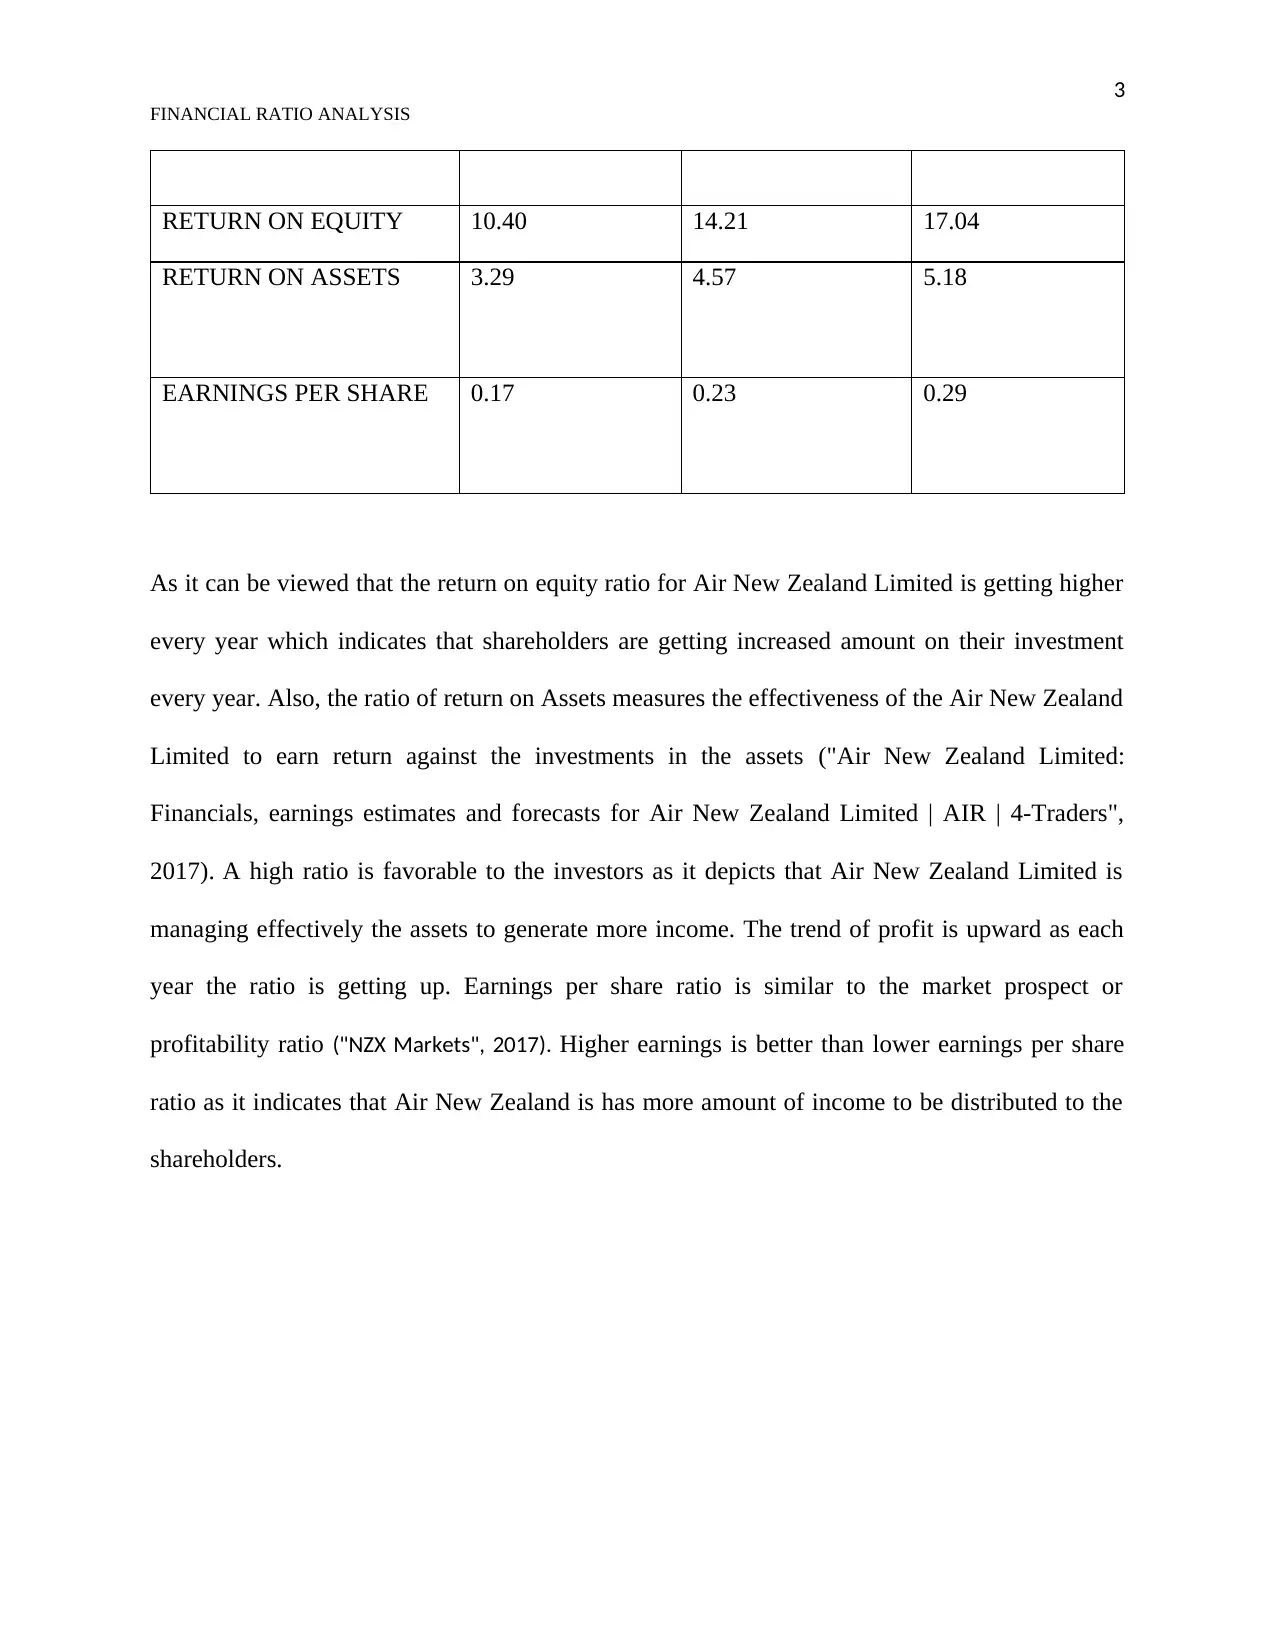
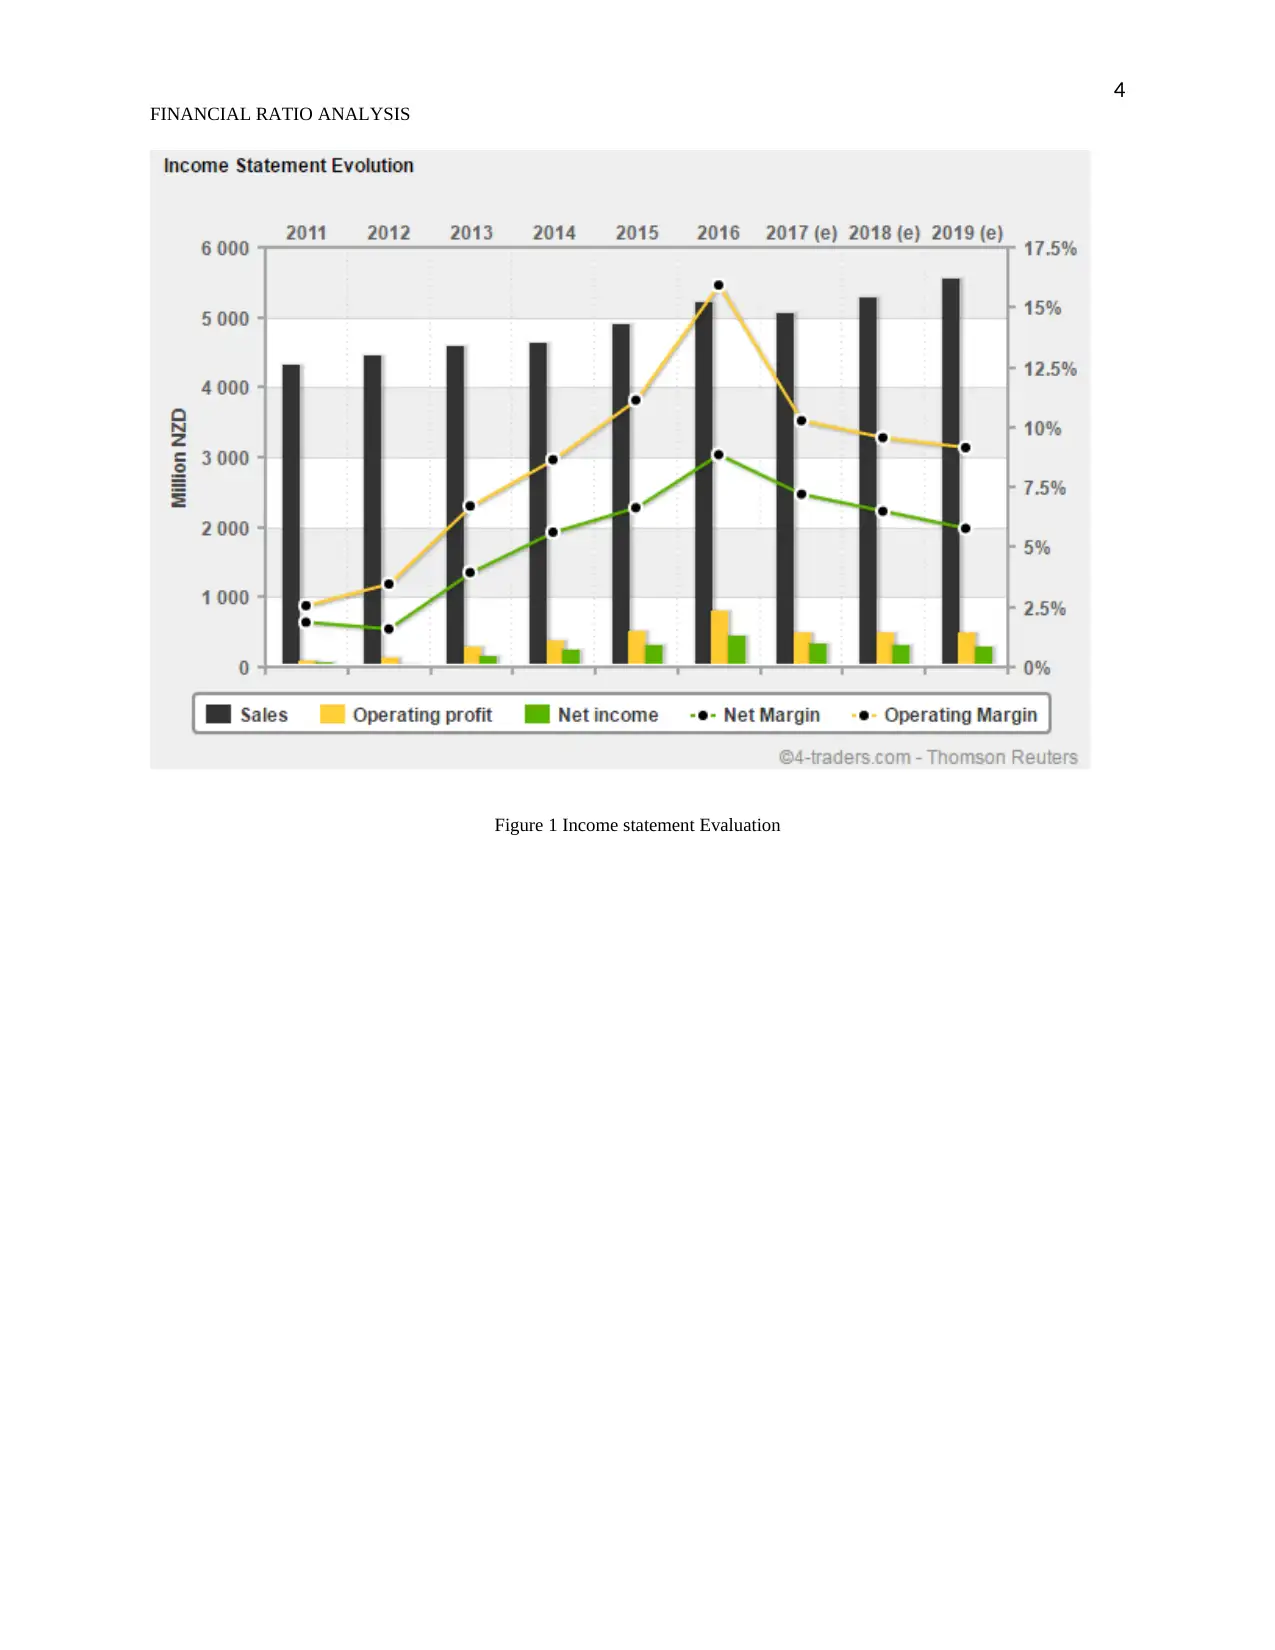
RETURN ON EQUITY 10.40 14.21 17.04
RETURN ON ASSETS 3.29 4.57 5.18
EARNINGS PER SHARE 0.17 0.23 0.29
As it can be viewed that the return on equity ratio for Air New Zealand Limited is getting higher
every year which indicates that shareholders are getting increased amount on their investment
every year. Also, the ratio of return on Assets measures the effectiveness of the Air New Zealand
Limited to earn return against the investments in the assets ("Air New Zealand Limited:
Financials, earnings estimates and forecasts for Air New Zealand Limited | AIR | 4-Traders",
2017). A high ratio is favorable to the investors as it depicts that Air New Zealand Limited is
managing effectively the assets to generate more income. The trend of profit is upward as each
year the ratio is getting up. Earnings per share ratio is similar to the market prospect or
profitability ratio ("NZX Markets", 2017). Higher earnings is better than lower earnings per share
ratio as it indicates that Air New Zealand is has more amount of income to be distributed to the
shareholders.
FINANCIAL RATIO ANALYSIS
RETURN ON EQUITY 10.40 14.21 17.04
RETURN ON ASSETS 3.29 4.57 5.18
EARNINGS PER SHARE 0.17 0.23 0.29
As it can be viewed that the return on equity ratio for Air New Zealand Limited is getting higher
every year which indicates that shareholders are getting increased amount on their investment
every year. Also, the ratio of return on Assets measures the effectiveness of the Air New Zealand
Limited to earn return against the investments in the assets ("Air New Zealand Limited:
Financials, earnings estimates and forecasts for Air New Zealand Limited | AIR | 4-Traders",
2017). A high ratio is favorable to the investors as it depicts that Air New Zealand Limited is
managing effectively the assets to generate more income. The trend of profit is upward as each
year the ratio is getting up. Earnings per share ratio is similar to the market prospect or
profitability ratio ("NZX Markets", 2017). Higher earnings is better than lower earnings per share
ratio as it indicates that Air New Zealand is has more amount of income to be distributed to the
shareholders.
Paraphrase This Document
Need a fresh take? Get an instant paraphrase of this document with our AI Paraphraser
4
FINANCIAL RATIO ANALYSIS
Figure 1 Income statement Evaluation
FINANCIAL RATIO ANALYSIS
Figure 1 Income statement Evaluation
5
FINANCIAL RATIO ANALYSIS
Financial Stability of the Company
Particulars Ratios (2013) Ratios (2014) Ratios (2015)
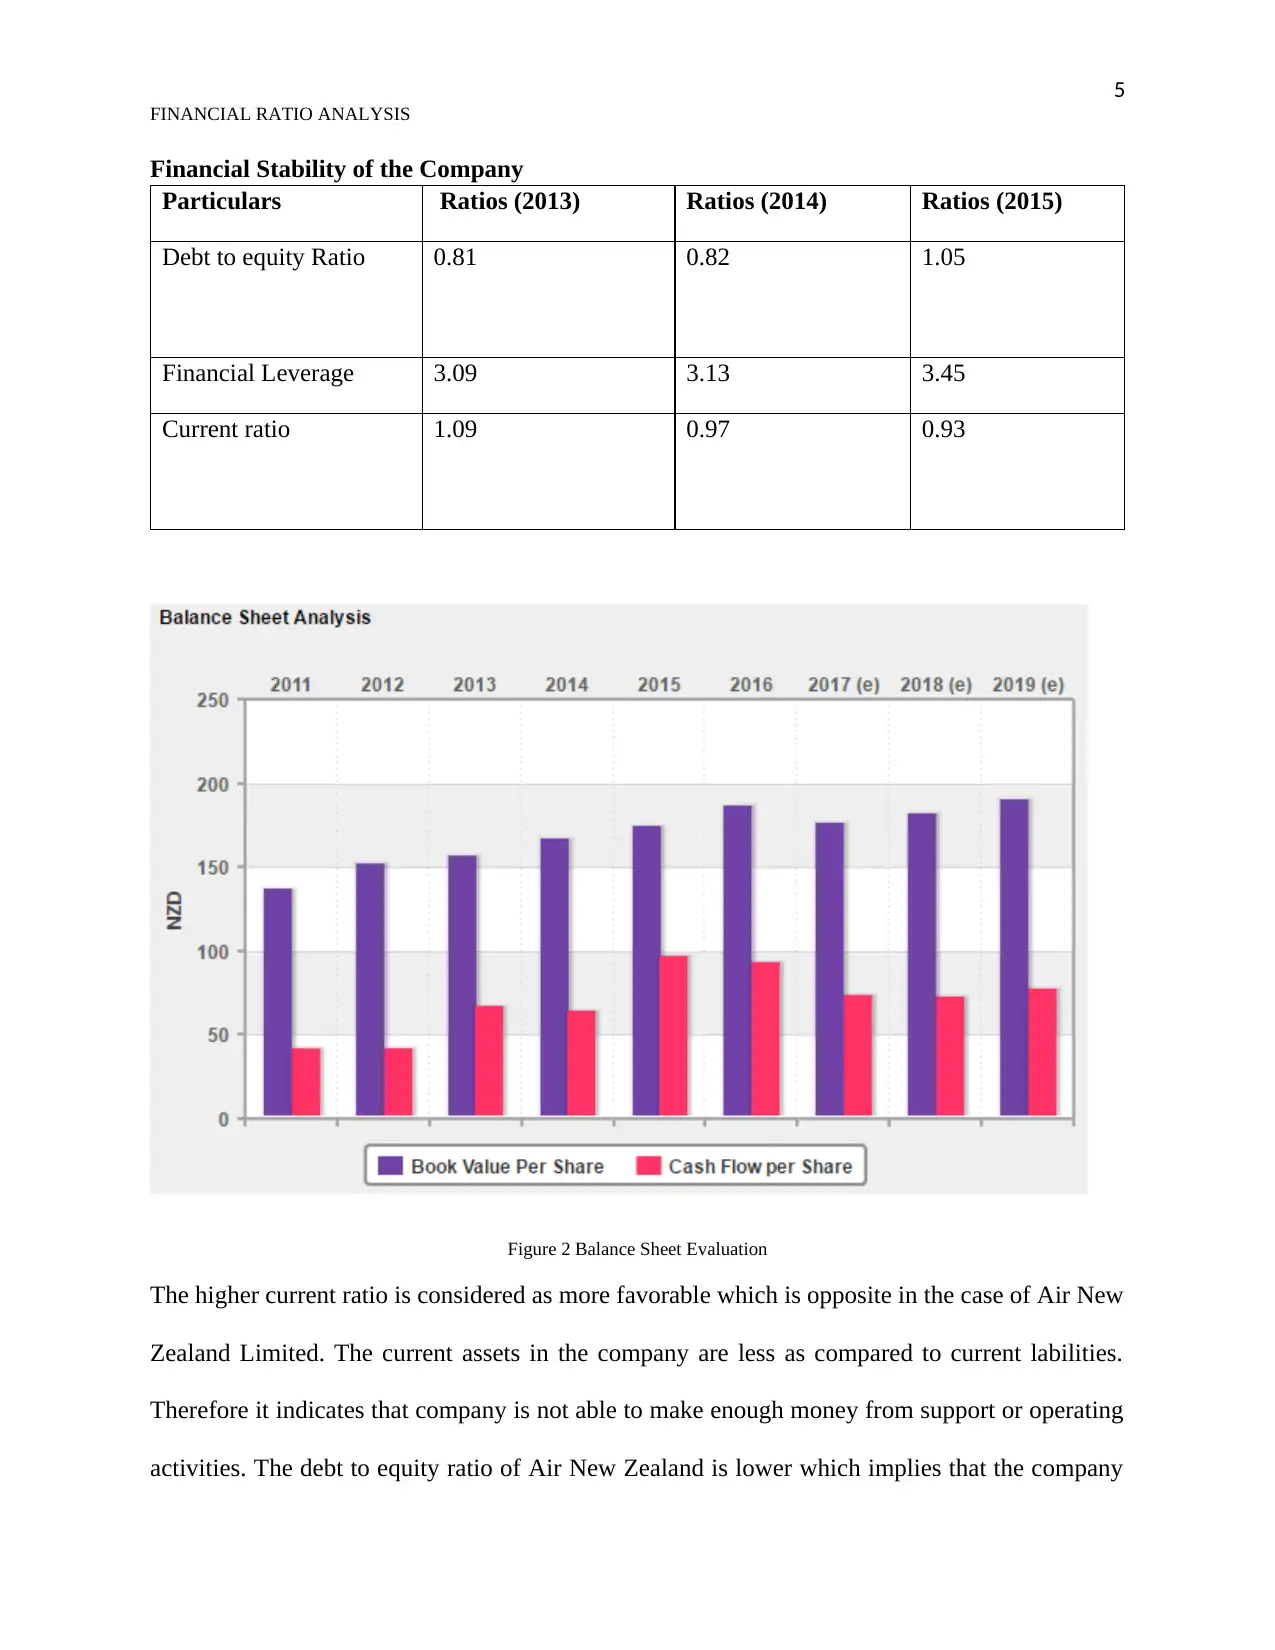
Debt to equity Ratio 0.81 0.82 1.05
Financial Leverage 3.09 3.13 3.45
Current ratio 1.09 0.97 0.93
Figure 2 Balance Sheet Evaluation
The higher current ratio is considered as more favorable which is opposite in the case of Air New
Zealand Limited. The current assets in the company are less as compared to current labilities.
Therefore it indicates that company is not able to make enough money from support or operating
activities. The debt to equity ratio of Air New Zealand is lower which implies that the company
FINANCIAL RATIO ANALYSIS
Financial Stability of the Company
Particulars Ratios (2013) Ratios (2014) Ratios (2015)
Debt to equity Ratio 0.81 0.82 1.05
Financial Leverage 3.09 3.13 3.45
Current ratio 1.09 0.97 0.93
Figure 2 Balance Sheet Evaluation
The higher current ratio is considered as more favorable which is opposite in the case of Air New
Zealand Limited. The current assets in the company are less as compared to current labilities.
Therefore it indicates that company is not able to make enough money from support or operating
activities. The debt to equity ratio of Air New Zealand is lower which implies that the company
⊘ This is a preview!⊘
Do you want full access?
Subscribe today to unlock all pages.
Trusted by 1+ million students worldwide
6
FINANCIAL RATIO ANALYSIS
is more stable. Unlike equity financing, the debt amount is repaid to the giver of money. The
debt equity ratio rose significantly in 2016 which is a matter of concern for Air New Zealand
Limited.
Asset Utilization of the Company
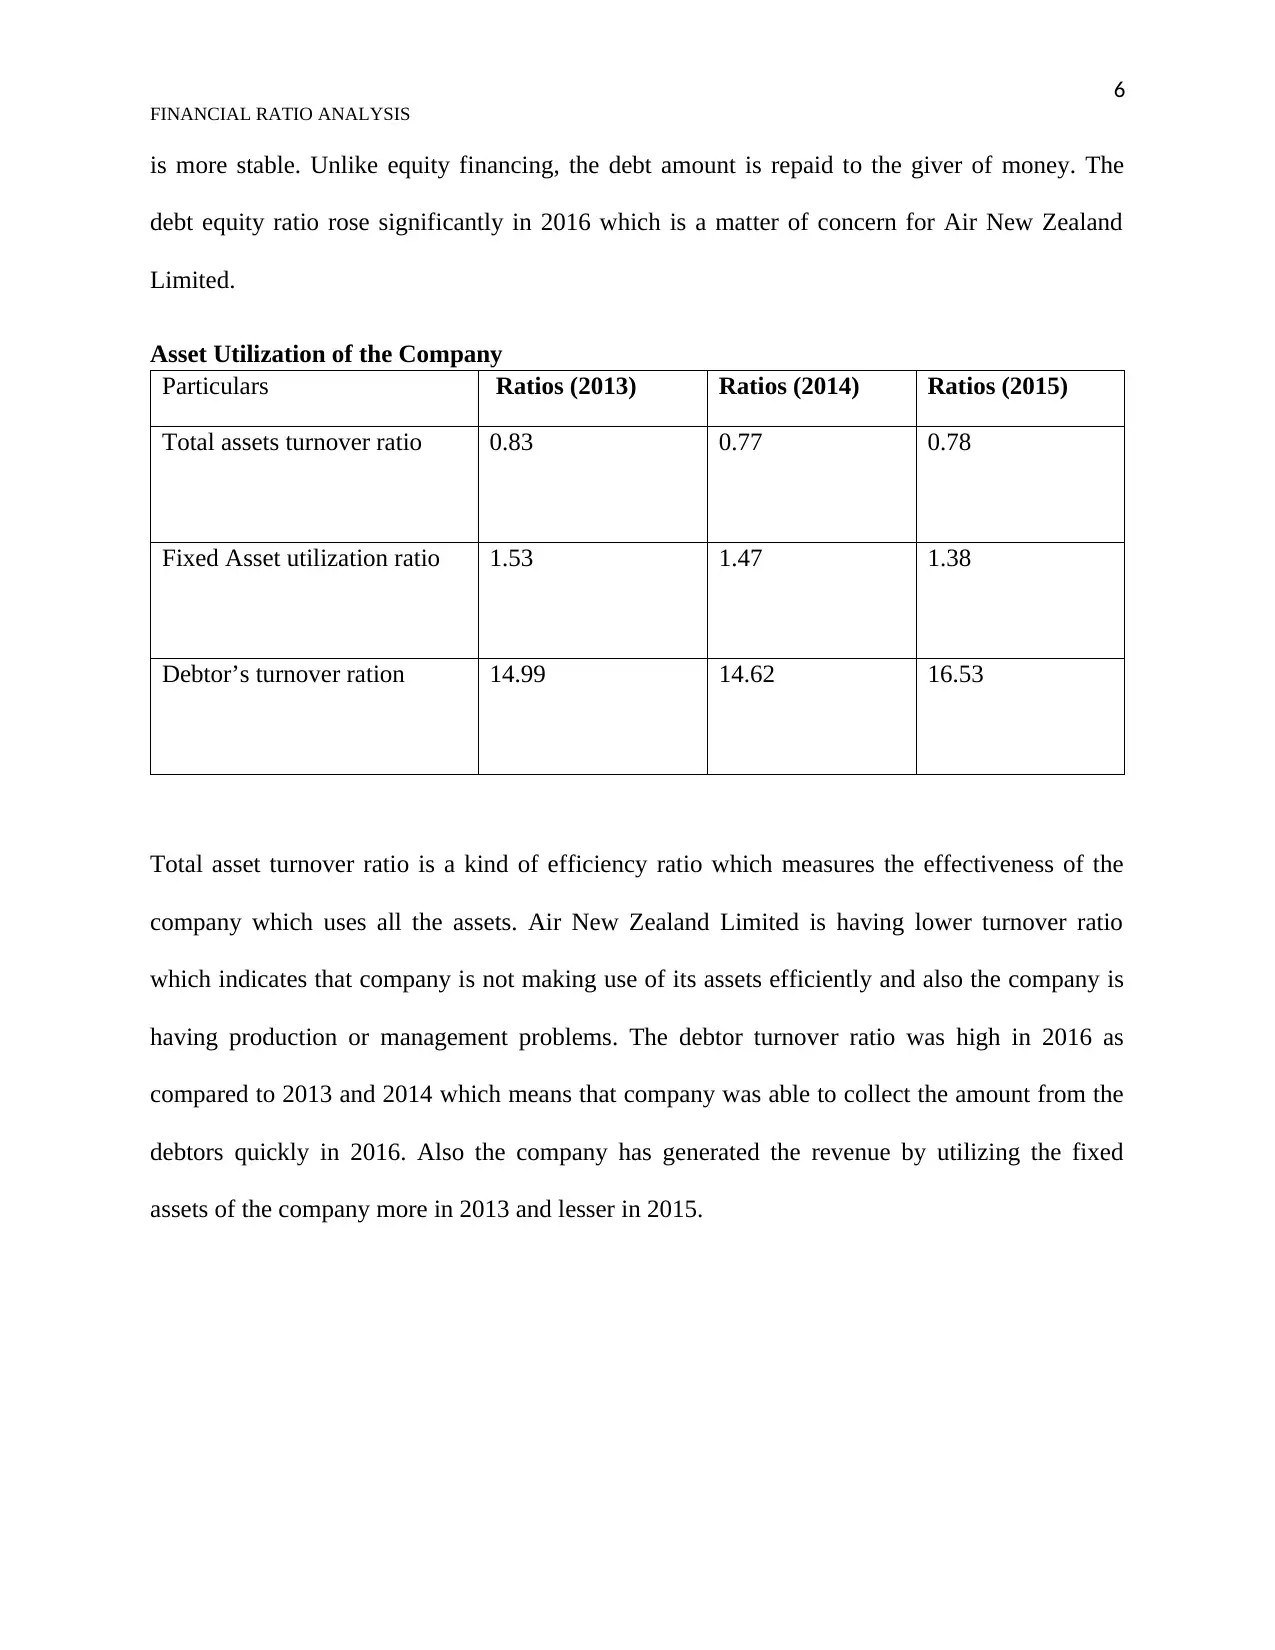
Particulars Ratios (2013) Ratios (2014) Ratios (2015)
Total assets turnover ratio 0.83 0.77 0.78
Fixed Asset utilization ratio 1.53 1.47 1.38
Debtor’s turnover ration 14.99 14.62 16.53
Total asset turnover ratio is a kind of efficiency ratio which measures the effectiveness of the
company which uses all the assets. Air New Zealand Limited is having lower turnover ratio
which indicates that company is not making use of its assets efficiently and also the company is
having production or management problems. The debtor turnover ratio was high in 2016 as
compared to 2013 and 2014 which means that company was able to collect the amount from the
debtors quickly in 2016. Also the company has generated the revenue by utilizing the fixed
assets of the company more in 2013 and lesser in 2015.
FINANCIAL RATIO ANALYSIS
is more stable. Unlike equity financing, the debt amount is repaid to the giver of money. The
debt equity ratio rose significantly in 2016 which is a matter of concern for Air New Zealand
Limited.
Asset Utilization of the Company
Particulars Ratios (2013) Ratios (2014) Ratios (2015)
Total assets turnover ratio 0.83 0.77 0.78
Fixed Asset utilization ratio 1.53 1.47 1.38
Debtor’s turnover ration 14.99 14.62 16.53
Total asset turnover ratio is a kind of efficiency ratio which measures the effectiveness of the
company which uses all the assets. Air New Zealand Limited is having lower turnover ratio
which indicates that company is not making use of its assets efficiently and also the company is
having production or management problems. The debtor turnover ratio was high in 2016 as
compared to 2013 and 2014 which means that company was able to collect the amount from the
debtors quickly in 2016. Also the company has generated the revenue by utilizing the fixed
assets of the company more in 2013 and lesser in 2015.
Paraphrase This Document
Need a fresh take? Get an instant paraphrase of this document with our AI Paraphraser
7
FINANCIAL RATIO ANALYSIS
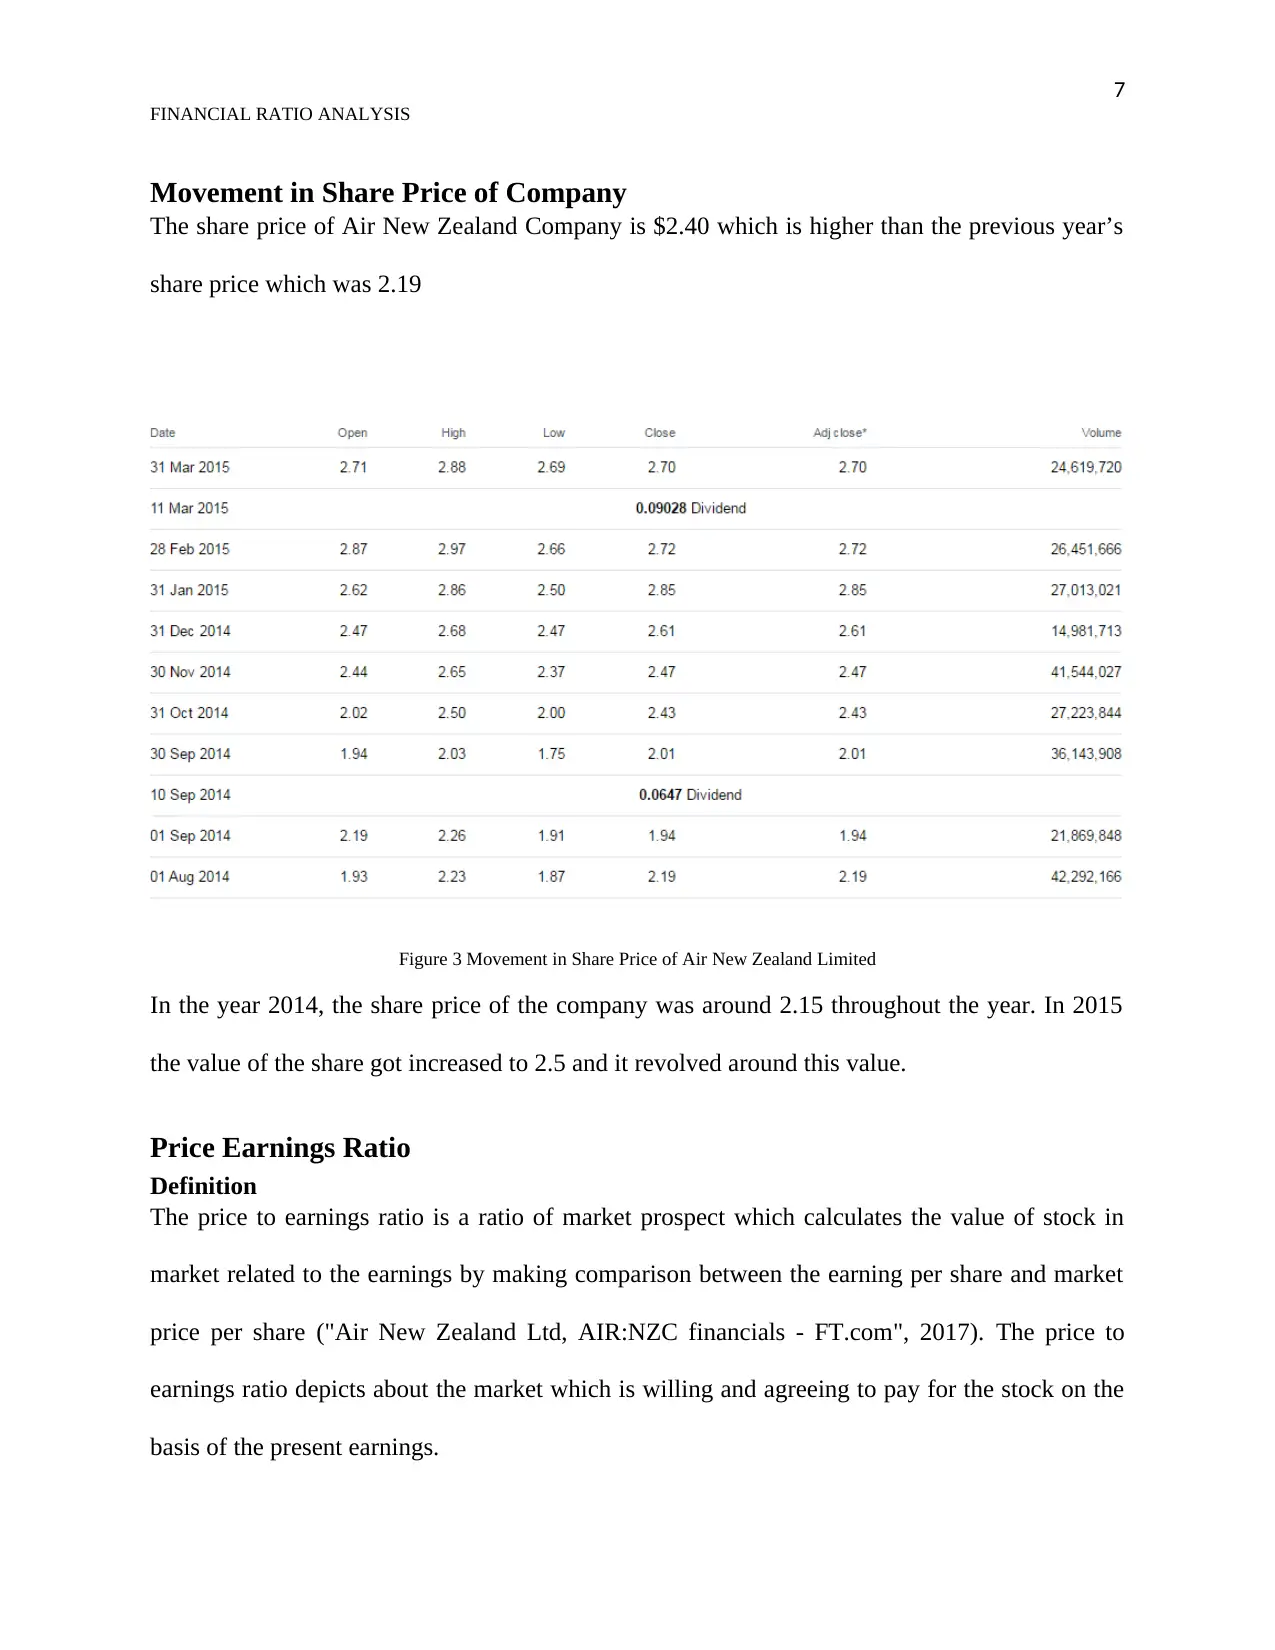
Movement in Share Price of Company
The share price of Air New Zealand Company is $2.40 which is higher than the previous year’s
share price which was 2.19
Figure 3 Movement in Share Price of Air New Zealand Limited
In the year 2014, the share price of the company was around 2.15 throughout the year. In 2015
the value of the share got increased to 2.5 and it revolved around this value.
Price Earnings Ratio
Definition
The price to earnings ratio is a ratio of market prospect which calculates the value of stock in
market related to the earnings by making comparison between the earning per share and market
price per share ("Air New Zealand Ltd, AIR:NZC financials - FT.com", 2017). The price to
earnings ratio depicts about the market which is willing and agreeing to pay for the stock on the
basis of the present earnings.
FINANCIAL RATIO ANALYSIS
Movement in Share Price of Company
The share price of Air New Zealand Company is $2.40 which is higher than the previous year’s
share price which was 2.19
Figure 3 Movement in Share Price of Air New Zealand Limited
In the year 2014, the share price of the company was around 2.15 throughout the year. In 2015
the value of the share got increased to 2.5 and it revolved around this value.
Price Earnings Ratio
Definition
The price to earnings ratio is a ratio of market prospect which calculates the value of stock in
market related to the earnings by making comparison between the earning per share and market
price per share ("Air New Zealand Ltd, AIR:NZC financials - FT.com", 2017). The price to
earnings ratio depicts about the market which is willing and agreeing to pay for the stock on the
basis of the present earnings.
8
FINANCIAL RATIO ANALYSIS
Factors which influence Price Earnings ratio
Earnings
The price earnings ratio is based on the 12 months earnings which is equal to the net
income less preferred dividends. The drivers which enable increased earnings involve
combination of high sales volume from cost controls, new geographic markets and new
products.
Growth
PE ratio depends on earnings in future as the stock market intend to look in future. Small
companies have high PE ratios instead of market or industry averages as they have
increased earnings and sales growth rates ("What Influences the Price-to-Earnings
Ratio?", 2017).
Economy
Conditions of economy influence the PE Ratio as they affect the financial markets and
earnings of corporates. A combination of low inflation and economic growth may
enhance the PE ratio because the flow of funds influence the anticipation of dividend
growth and strong earnings.
Considerations
Generally, the stocks are valued more than its worth if they are being traded above their
PE ratio in historic days or the market based PE ratio. The investors of Buy and Hold
nature buy the stocks which are undervalued and wait for price of market to conform to
the fundamentals, while the momentum investors buy the stocks with momentum of
strong price, which implies with high ratio of Price-Earnings. Price Earnings Ratio of Air
New Zealand Limited is 7.6 which is lower than the industry average that is 11.0
⊘ This is a preview!⊘
Do you want full access?
Subscribe today to unlock all pages.
Trusted by 1+ million students worldwide

9
FINANCIAL RATIO ANALYSIS
FINANCIAL RATIO ANALYSIS
Paraphrase This Document
Need a fresh take? Get an instant paraphrase of this document with our AI Paraphraser
10
FINANCIAL RATIO ANALYSIS
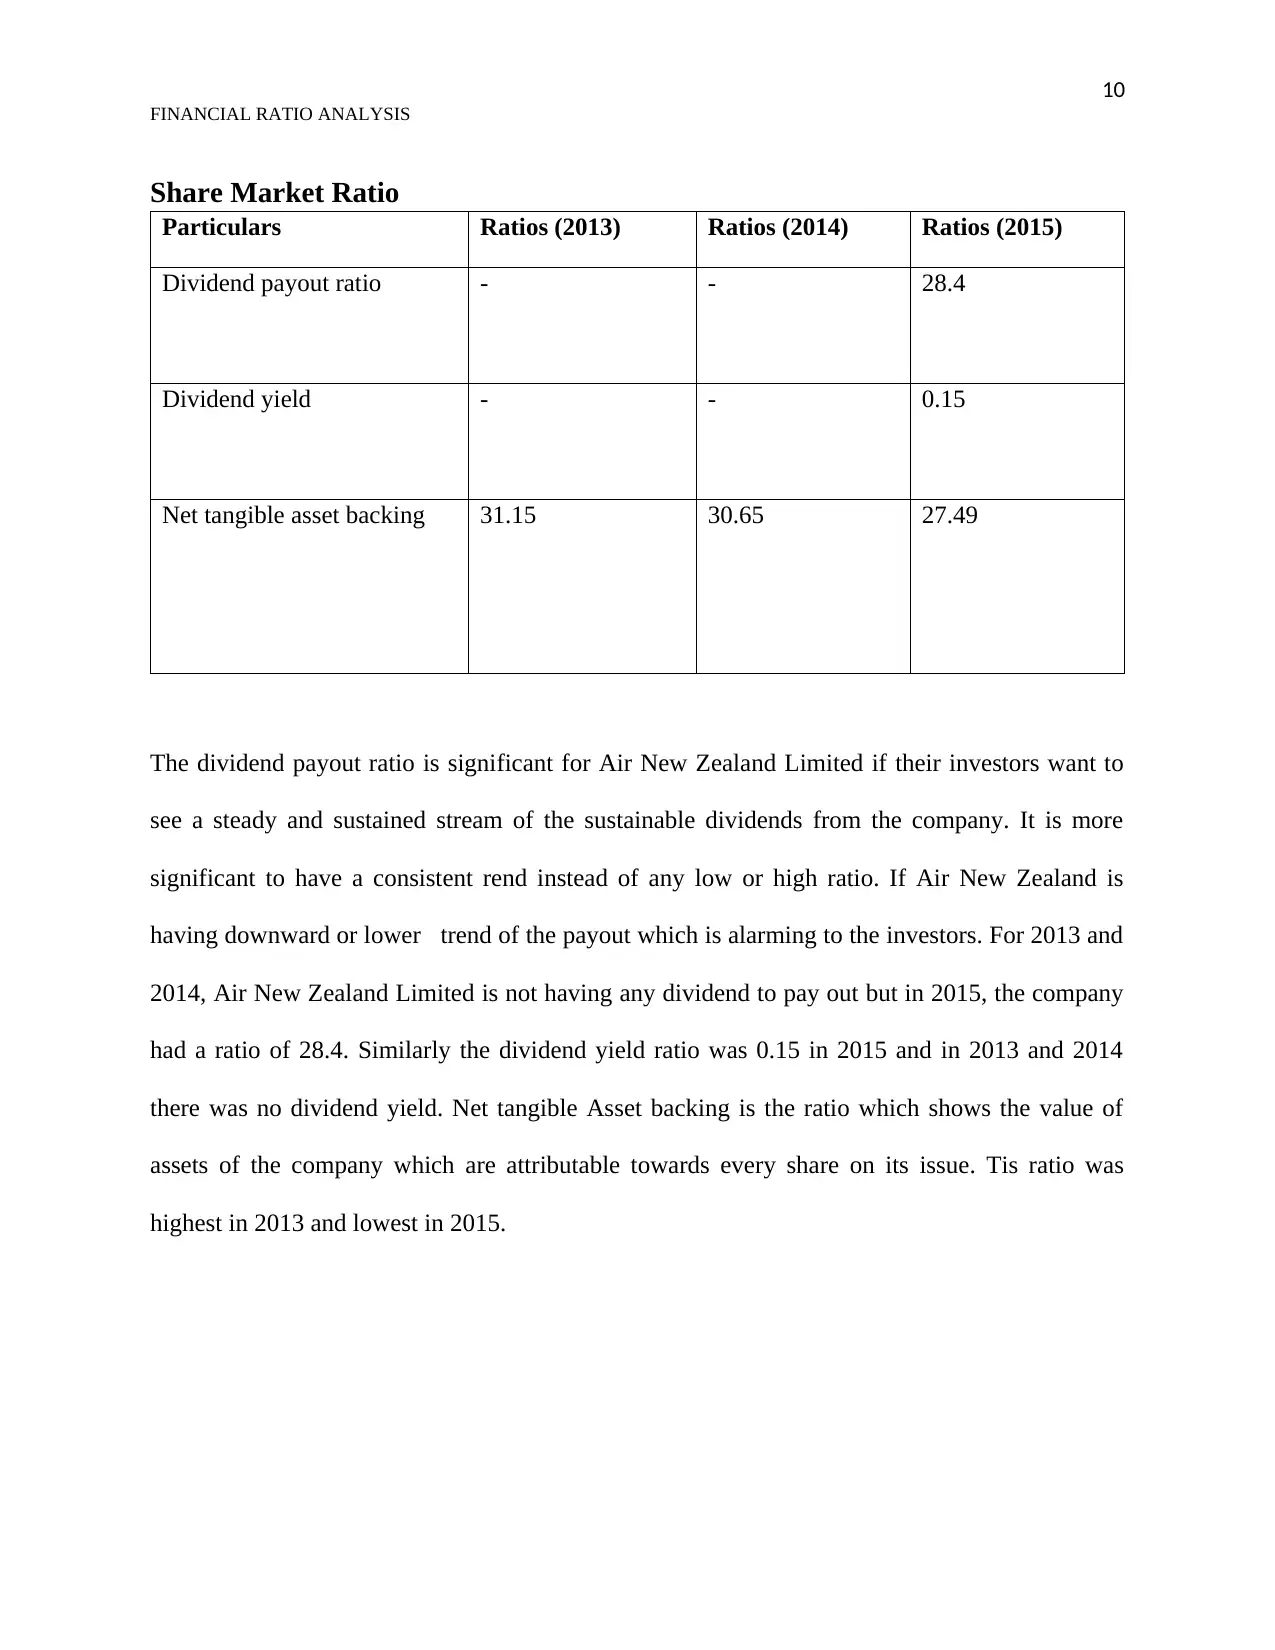
Share Market Ratio
Particulars Ratios (2013) Ratios (2014) Ratios (2015)
Dividend payout ratio - - 28.4
Dividend yield - - 0.15
Net tangible asset backing 31.15 30.65 27.49
The dividend payout ratio is significant for Air New Zealand Limited if their investors want to
see a steady and sustained stream of the sustainable dividends from the company. It is more
significant to have a consistent rend instead of any low or high ratio. If Air New Zealand is
having downward or lower trend of the payout which is alarming to the investors. For 2013 and
2014, Air New Zealand Limited is not having any dividend to pay out but in 2015, the company
had a ratio of 28.4. Similarly the dividend yield ratio was 0.15 in 2015 and in 2013 and 2014
there was no dividend yield. Net tangible Asset backing is the ratio which shows the value of
assets of the company which are attributable towards every share on its issue. Tis ratio was
highest in 2013 and lowest in 2015.
FINANCIAL RATIO ANALYSIS
Share Market Ratio
Particulars Ratios (2013) Ratios (2014) Ratios (2015)
Dividend payout ratio - - 28.4
Dividend yield - - 0.15
Net tangible asset backing 31.15 30.65 27.49
The dividend payout ratio is significant for Air New Zealand Limited if their investors want to
see a steady and sustained stream of the sustainable dividends from the company. It is more
significant to have a consistent rend instead of any low or high ratio. If Air New Zealand is
having downward or lower trend of the payout which is alarming to the investors. For 2013 and
2014, Air New Zealand Limited is not having any dividend to pay out but in 2015, the company
had a ratio of 28.4. Similarly the dividend yield ratio was 0.15 in 2015 and in 2013 and 2014
there was no dividend yield. Net tangible Asset backing is the ratio which shows the value of
assets of the company which are attributable towards every share on its issue. Tis ratio was
highest in 2013 and lowest in 2015.
11
FINANCIAL RATIO ANALYSIS
Statement of Accounting Policies
The accounting policies should be disclosed by the organization which is the reporting entity as
it is a requirement but the GAAP and must describe and identify the principles of accounting
which it is following, the ways in which these principles are applied, how these decisions may
affect the changes and determination of the position of finance and the appropriateness and
exactness of the principles of accounts while recognizing the revenue and allocating the cost.
Non-Financial Information
Environmental and Social Issues
Social Issues: As a part of strategic pursuance of the organizational goals, the company
has made different efforts to commit and conduct its services to preserve the environment
and CSR courses. This social responsibility of the corporate is shown to its goals which is
being the most environment friendly and sustainable airline in the world ("Income
Statement for Air New Zealand Ltd (ANZFF) from Morningstar.com", 2017). The airline
is looking for innovative methods to increase the friendliness of the environment in every
sector of the operations.
Environmental Issues: The airline was successful to show a major example in reducing
the emission of carbon in all the operations of flights by making sure that huge saving is
done on usage of fuels. The corporation has undertaken various engagement into the
various projects in which they desire to lower the emission of carbon by approximately
130000 tons every year.
⊘ This is a preview!⊘
Do you want full access?
Subscribe today to unlock all pages.
Trusted by 1+ million students worldwide
1 out of 20
Related Documents


Your All-in-One AI-Powered Toolkit for Academic Success.
+13062052269
info@desklib.com
Available 24*7 on WhatsApp / Email
![[object Object]](/_next/static/media/star-bottom.7253800d.svg)
Unlock your academic potential
Copyright © 2020–2026 A2Z Services. All Rights Reserved. Developed and managed by ZUCOL.