Comprehensive Financial Performance Evaluation: Air New Zealand
VerifiedAdded on 2023/06/13
|40
|7049
|282
Report
AI Summary
This report provides a comprehensive financial performance analysis of Air New Zealand Company, examining its current situation, strategic posture, internal environment, and key financial ratios from 2013 to 2017. It assesses liquidity, profitability, efficiency, and solvency using metrics like current ratio, quick ratio, net profit margin, return on equity, receivable turnover, creditor's turnover, asset turnover, debt to equity ratio, and gearing ratio. The analysis includes a SWOT analysis, IFAS and EFAS tables, and recommendations for strategic alternatives. The report concludes that Air New Zealand has generally improved its profitability and efficiency but needs to carefully manage its debt levels and receivable turnover to optimize financial performance. The document includes financial statements and ratio calculations to support its findings.
RUNNING HEAD: Financial Performance of Air New Zealand Company 1 | P a g e
Name of the student
Topic- Financial Performance of Air New Zealand Company
University Name-
Name of the student
Topic- Financial Performance of Air New Zealand Company
University Name-
Paraphrase This Document
Need a fresh take? Get an instant paraphrase of this document with our AI Paraphraser
Financial Performance of Air New Zealand Company 2 | P a g e
Table of Contents
Table of Contents........................................................................................................................................2
Introduction.................................................................................................................................................3
Description of the Company....................................................................................................................3
Current situation of the Air New Zealand Company...................................................................................3
Strategic posture of the Air New Zealand Company...............................................................................4
Internal environment: Strength and Weakness of Air New Zealand Company........................................5
Summary of Internal Factors.....................................................................................................................11
Top Management of the Air New Zealand Company................................................................................16
ANALYSIS OF STRATEGIC FACTORS (SWOT).................................................................................17
STRATEGIC ALTERNATIVES & RECOMMENDED STRATEGY.....................................................19
References.................................................................................................................................................20
Exhibit.......................................................................................................................................................23
EFAS Table for Air New Zealand Company 2017....................................................................................23
IFAS Table for (name of Corporation) 2016.....................................................................................24
TOWS Matrix....................................................................................................................................27
Financial Ratio Analysis for (name of Corporation) 2014, 2015, and 2016 Years.............................28
Board of Directors Table for (name of Corporation) 2017.................................................................30
Top Management Table for (Air New Zealand) 2017........................................................................31
Appendix-2................................................................................................................................................33
Income statement of Air New Zealand Company......................................................................................33
Financial Performance of Air New Zealand Company 3 | P a g e
Introduction
With the ramified economic changes and complex business structure of the organization,
each and every organization needs to take effective financial business decision making. There are
several financial tools which could be gauged by the business organizations to make effective
financial decisions with a view to increasing the overall return on capital employed. In this
report, the financial performance of the Air New Zealand Company has been taken into
consideration. This report reflects the key financial performance and effective business
functioning of Air New Zealand Company.
Description of the Company
Air New Zealand Limited is the flag carrier airline of New Zealand Company based in
Auckland, the airline operates scheduled passenger flights to more than 30 domestics and 31
international destinations in 19th countries around the Pacific Rim and the United Kingdom.
This company was incorporated under the corporation act of New Zealand.
Air New Zealand has been providing its air and cargo services in the Airline industry of
New Zealand and other countries as well (Air New Zealand, 2017).
This company was founded in 1940 and managed by New Zealand government agency to
start up new airline business
Current situation of the Air New Zealand Company
After analyzing the financial performance of Air New Zealand Company, it is observed that
management of the company is planning to expand its business by entering into strategic alliance
with other organization. It is the group of airlines that offer international and domestic
passengers and cargo transportation services. The company aims to become the number one
airline company by serving district airline services for the best support of the customers. The
existing value chain activities of the company are divided into two main parts such as inbound
activities and outbound activities (Yahoo Finance, 2017).
⊘ This is a preview!⊘
Do you want full access?
Subscribe today to unlock all pages.
Trusted by 1+ million students worldwide
Financial Performance of Air New Zealand Company 4 | P a g e
Current performance of Air New Zealand Company
The stock price of the company is NZ$ 3.38 -0.04 (-1.03%) which reflects that company
has reduced its market value by 1.03% since last one year. The key person of the company is
Christopher Luxon, CEO. The total revenue of the company is NZ$5,231 million (2016) which is
20% higher as compared to last five year annual data. In addition to this, the overall profit of the
company is NZ$463 million (2016 which shows that company has created strong value and
return on profit (Duchin and Sosyura, 2014).
Strategic posture of the Air New Zealand Company
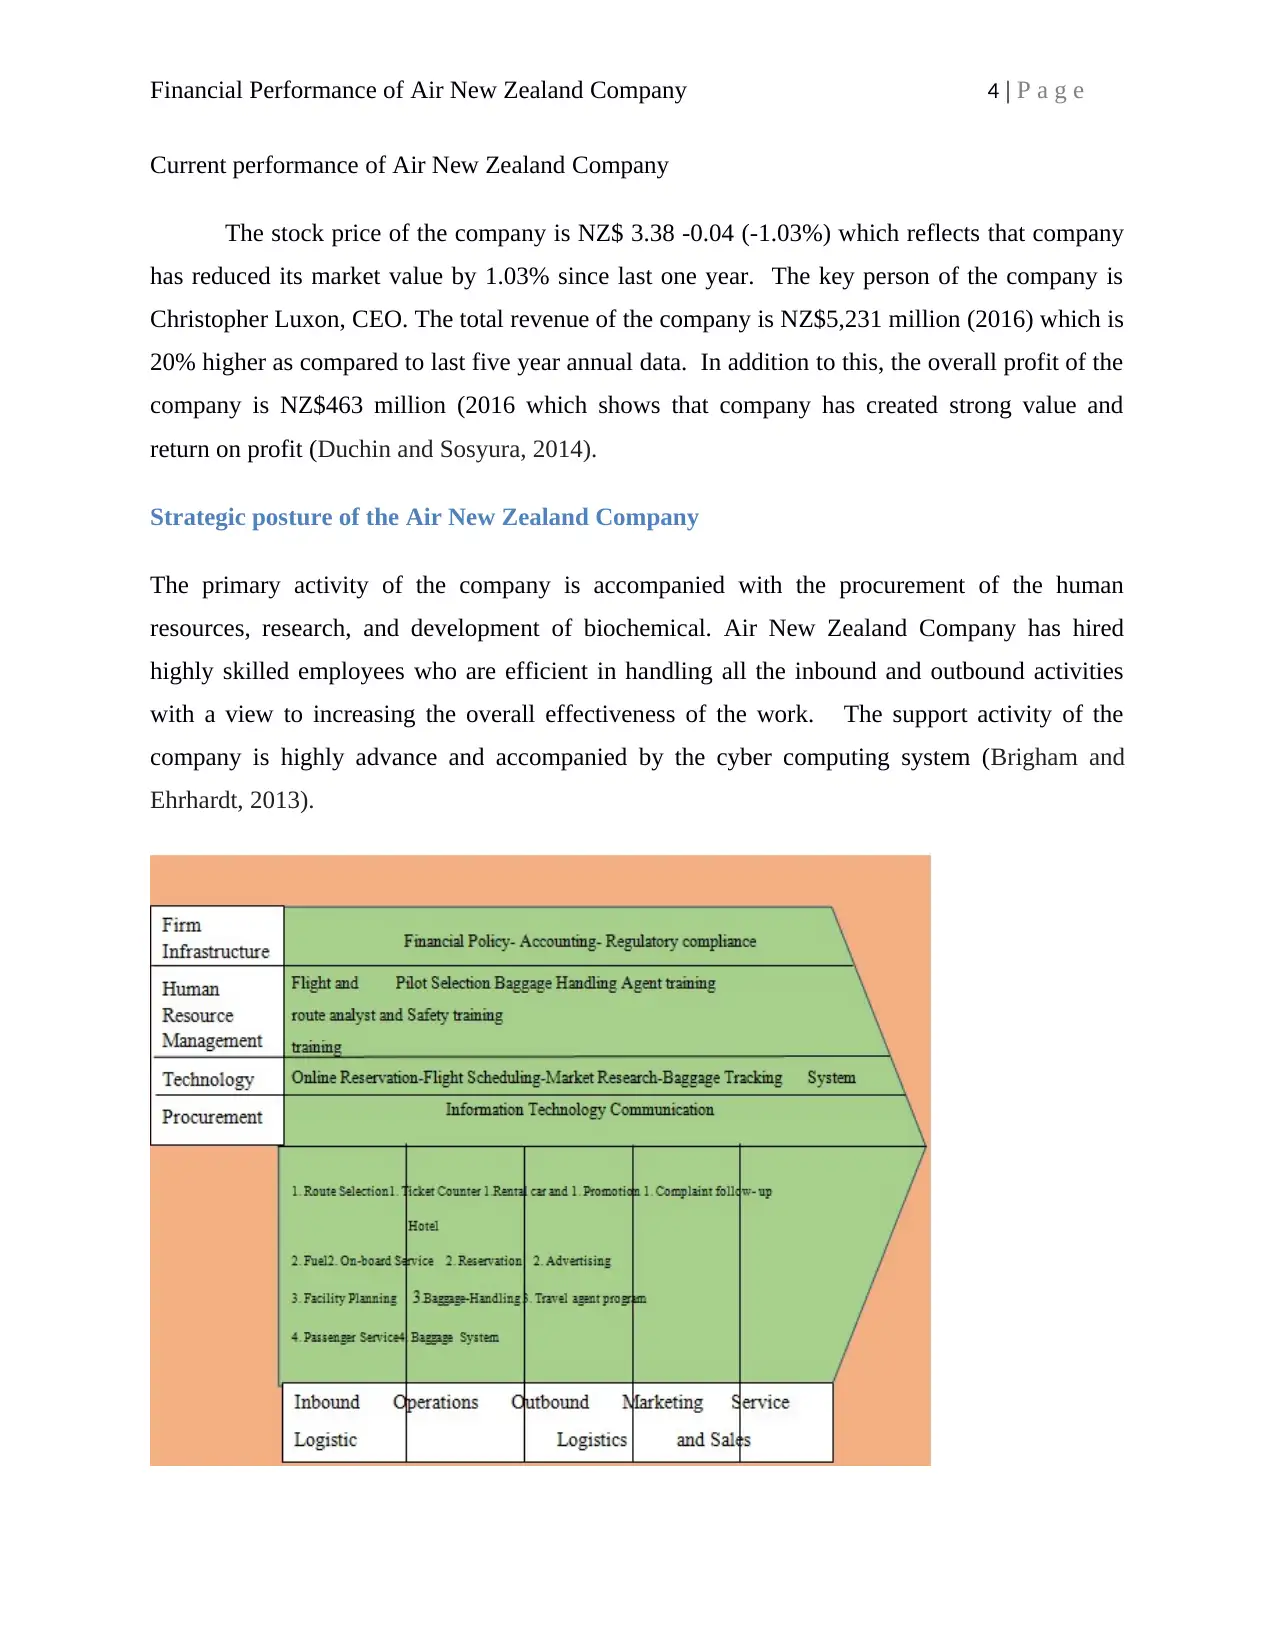
The primary activity of the company is accompanied with the procurement of the human
resources, research, and development of biochemical. Air New Zealand Company has hired
highly skilled employees who are efficient in handling all the inbound and outbound activities
with a view to increasing the overall effectiveness of the work. The support activity of the
company is highly advance and accompanied by the cyber computing system (Brigham and
Ehrhardt, 2013).
Current performance of Air New Zealand Company
The stock price of the company is NZ$ 3.38 -0.04 (-1.03%) which reflects that company
has reduced its market value by 1.03% since last one year. The key person of the company is
Christopher Luxon, CEO. The total revenue of the company is NZ$5,231 million (2016) which is
20% higher as compared to last five year annual data. In addition to this, the overall profit of the
company is NZ$463 million (2016 which shows that company has created strong value and
return on profit (Duchin and Sosyura, 2014).
Strategic posture of the Air New Zealand Company
The primary activity of the company is accompanied with the procurement of the human
resources, research, and development of biochemical. Air New Zealand Company has hired
highly skilled employees who are efficient in handling all the inbound and outbound activities
with a view to increasing the overall effectiveness of the work. The support activity of the
company is highly advance and accompanied by the cyber computing system (Brigham and
Ehrhardt, 2013).
Paraphrase This Document
Need a fresh take? Get an instant paraphrase of this document with our AI Paraphraser
Financial Performance of Air New Zealand Company 5 | P a g e
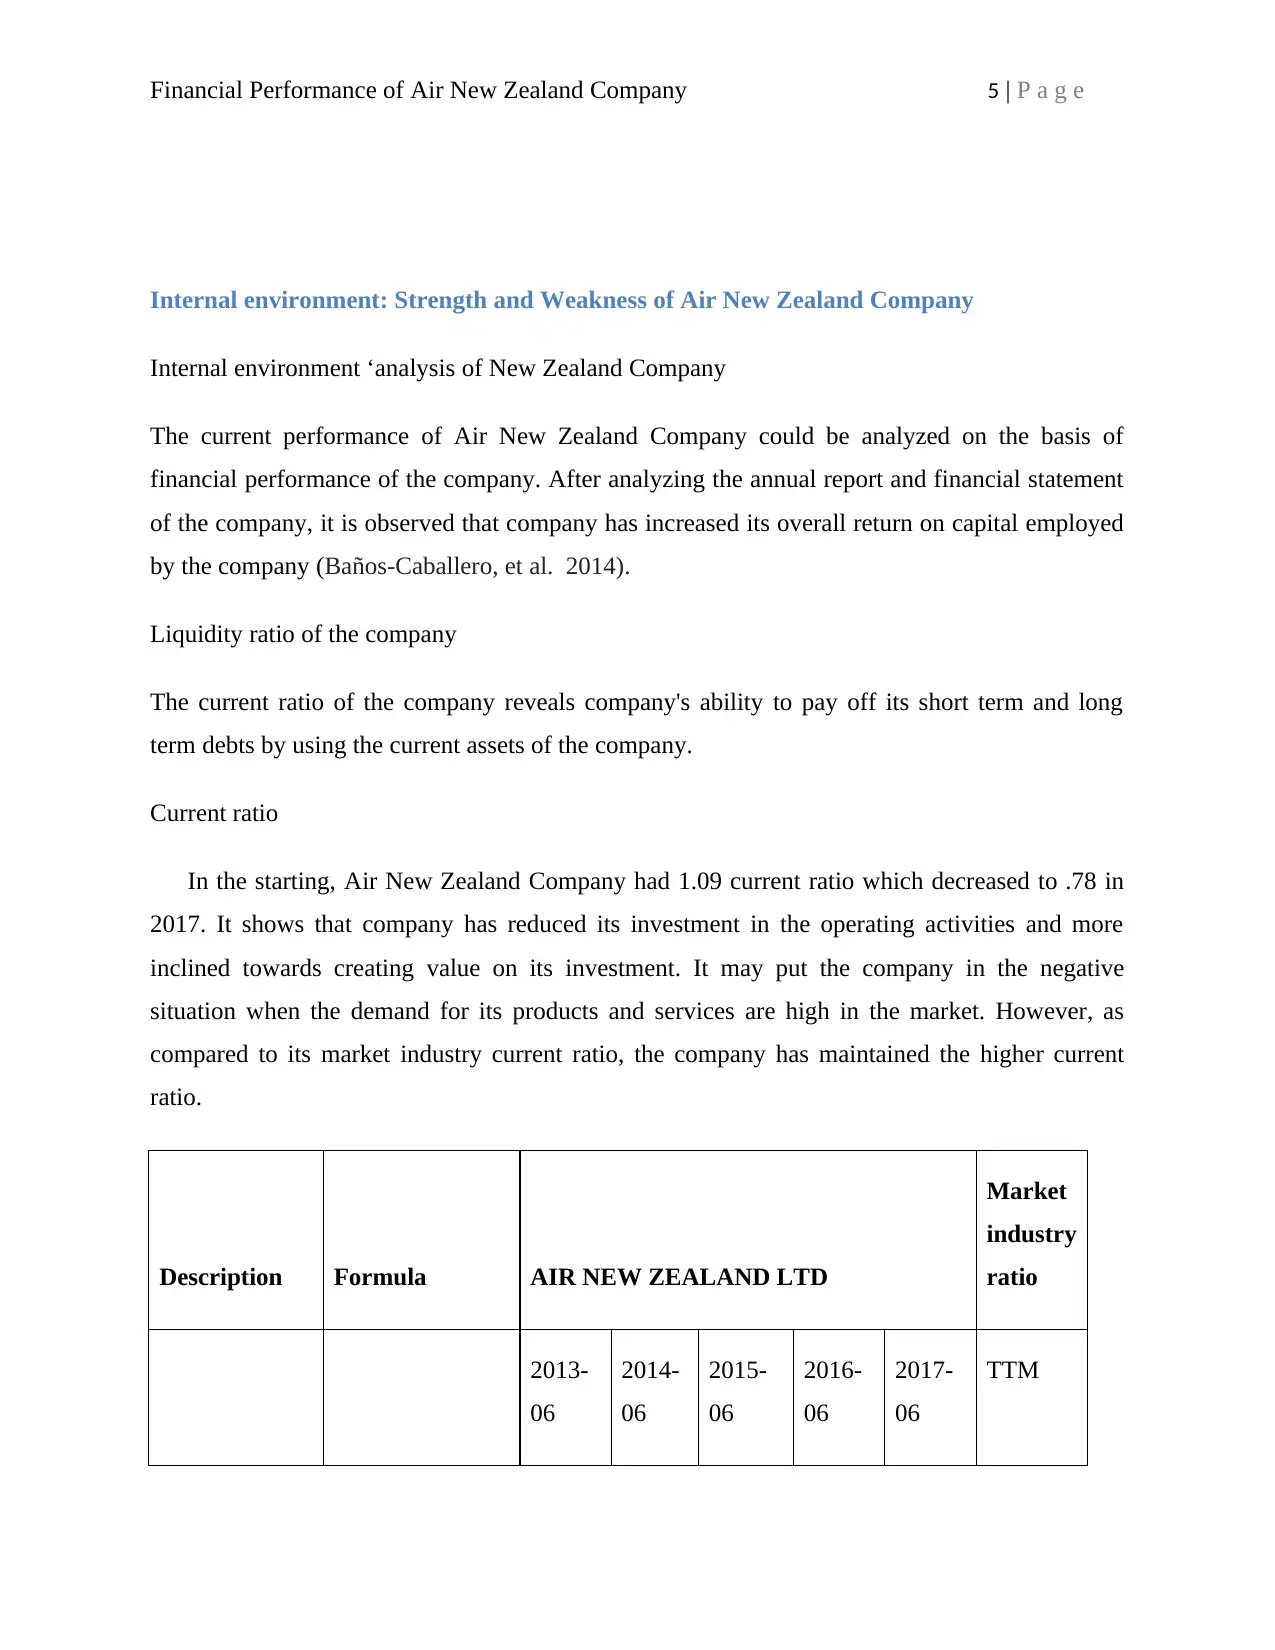
Internal environment: Strength and Weakness of Air New Zealand Company
Internal environment ‘analysis of New Zealand Company
The current performance of Air New Zealand Company could be analyzed on the basis of
financial performance of the company. After analyzing the annual report and financial statement
of the company, it is observed that company has increased its overall return on capital employed
by the company (Baños-Caballero, et al. 2014).
Liquidity ratio of the company
The current ratio of the company reveals company's ability to pay off its short term and long
term debts by using the current assets of the company.
Current ratio
In the starting, Air New Zealand Company had 1.09 current ratio which decreased to .78 in
2017. It shows that company has reduced its investment in the operating activities and more
inclined towards creating value on its investment. It may put the company in the negative
situation when the demand for its products and services are high in the market. However, as
compared to its market industry current ratio, the company has maintained the higher current
ratio.
Description Formula AIR NEW ZEALAND LTD
Market
industry
ratio
2013-
06
2014-
06
2015-
06
2016-
06
2017-
06
TTM
Financial Performance of Air New Zealand Company 6 | P a g e
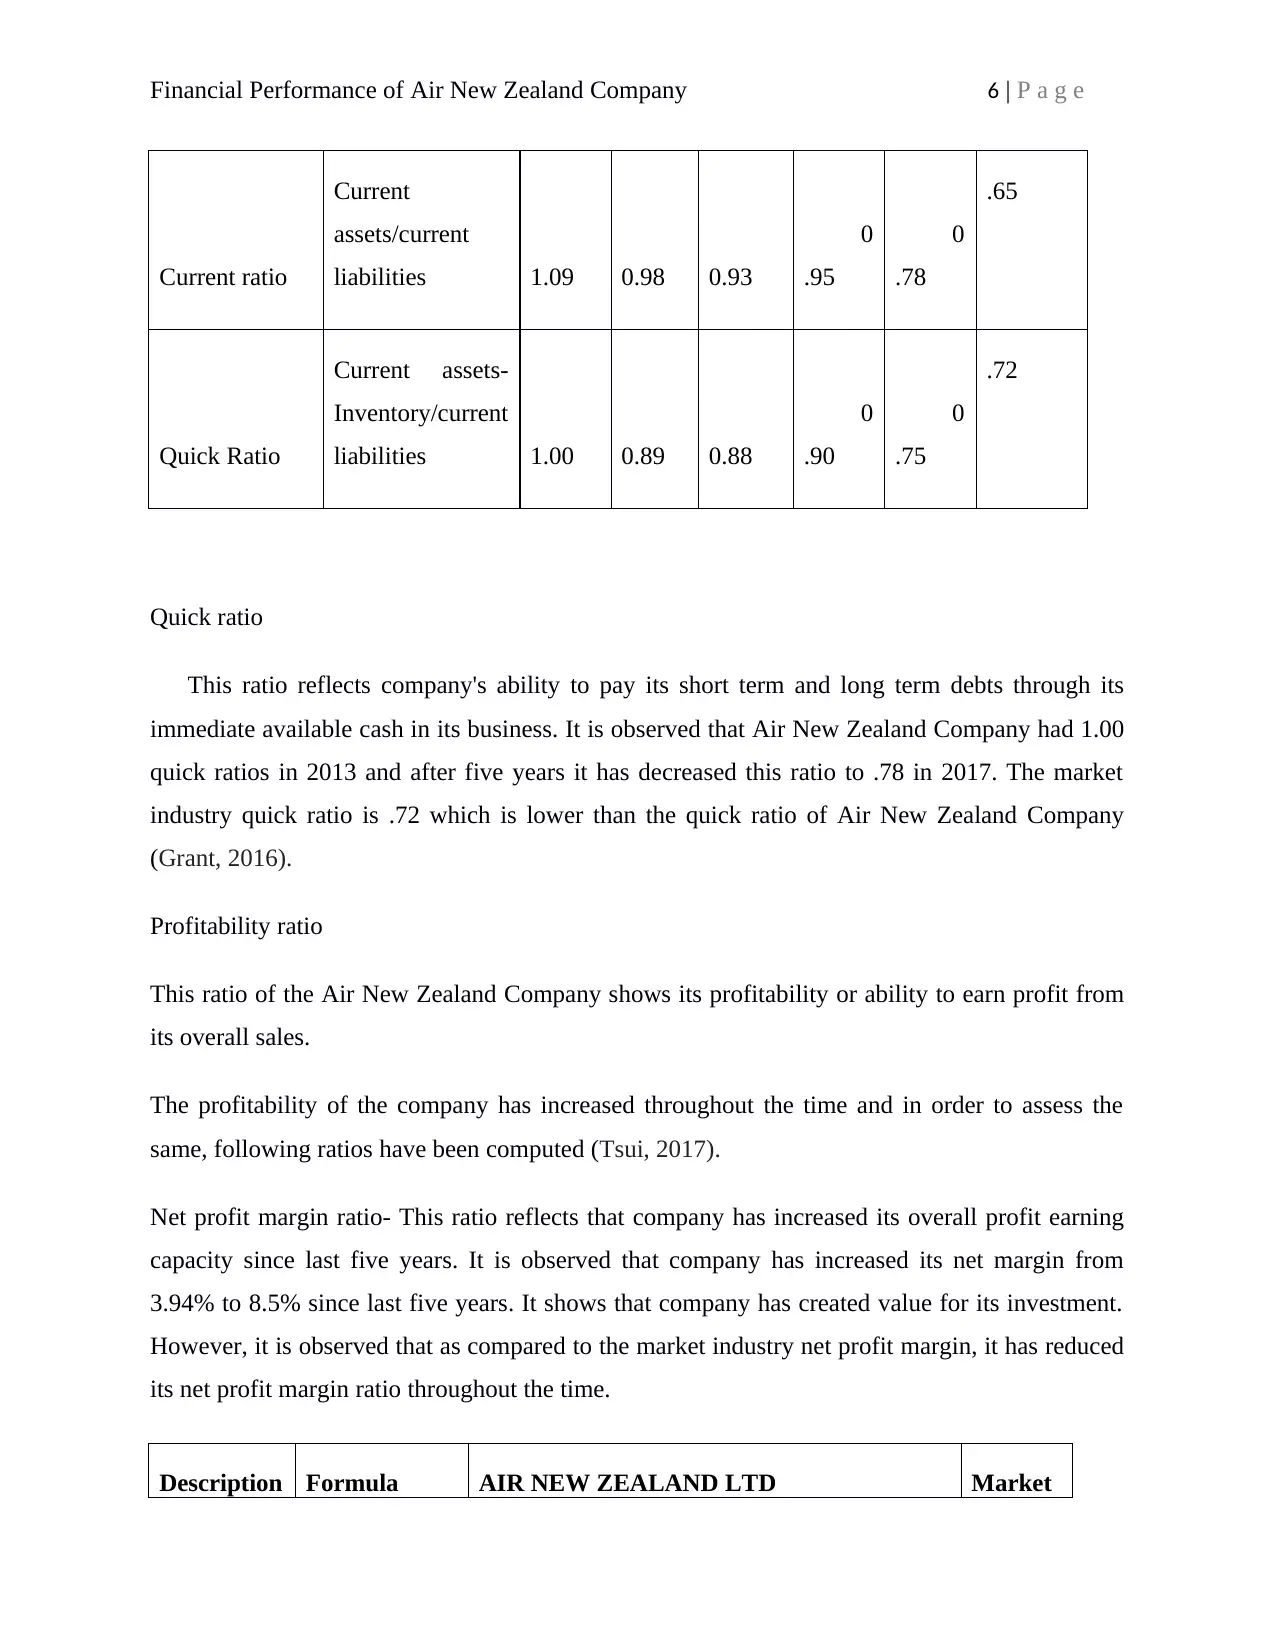
Current ratio
Current
assets/current
liabilities 1.09 0.98 0.93
0
.95
0
.78
.65
Quick Ratio
Current assets-
Inventory/current
liabilities 1.00 0.89 0.88
0
.90
0
.75
.72
Quick ratio
This ratio reflects company's ability to pay its short term and long term debts through its
immediate available cash in its business. It is observed that Air New Zealand Company had 1.00
quick ratios in 2013 and after five years it has decreased this ratio to .78 in 2017. The market
industry quick ratio is .72 which is lower than the quick ratio of Air New Zealand Company
(Grant, 2016).
Profitability ratio
This ratio of the Air New Zealand Company shows its profitability or ability to earn profit from
its overall sales.
The profitability of the company has increased throughout the time and in order to assess the
same, following ratios have been computed (Tsui, 2017).
Net profit margin ratio- This ratio reflects that company has increased its overall profit earning
capacity since last five years. It is observed that company has increased its net margin from
3.94% to 8.5% since last five years. It shows that company has created value for its investment.
However, it is observed that as compared to the market industry net profit margin, it has reduced
its net profit margin ratio throughout the time.
Description Formula AIR NEW ZEALAND LTD Market
⊘ This is a preview!⊘
Do you want full access?
Subscribe today to unlock all pages.
Trusted by 1+ million students worldwide
Financial Performance of Air New Zealand Company 7 | P a g e
industry
ratio
2013-
06
2014-
06
2015-
06
2016-
06 2017-06
TTM
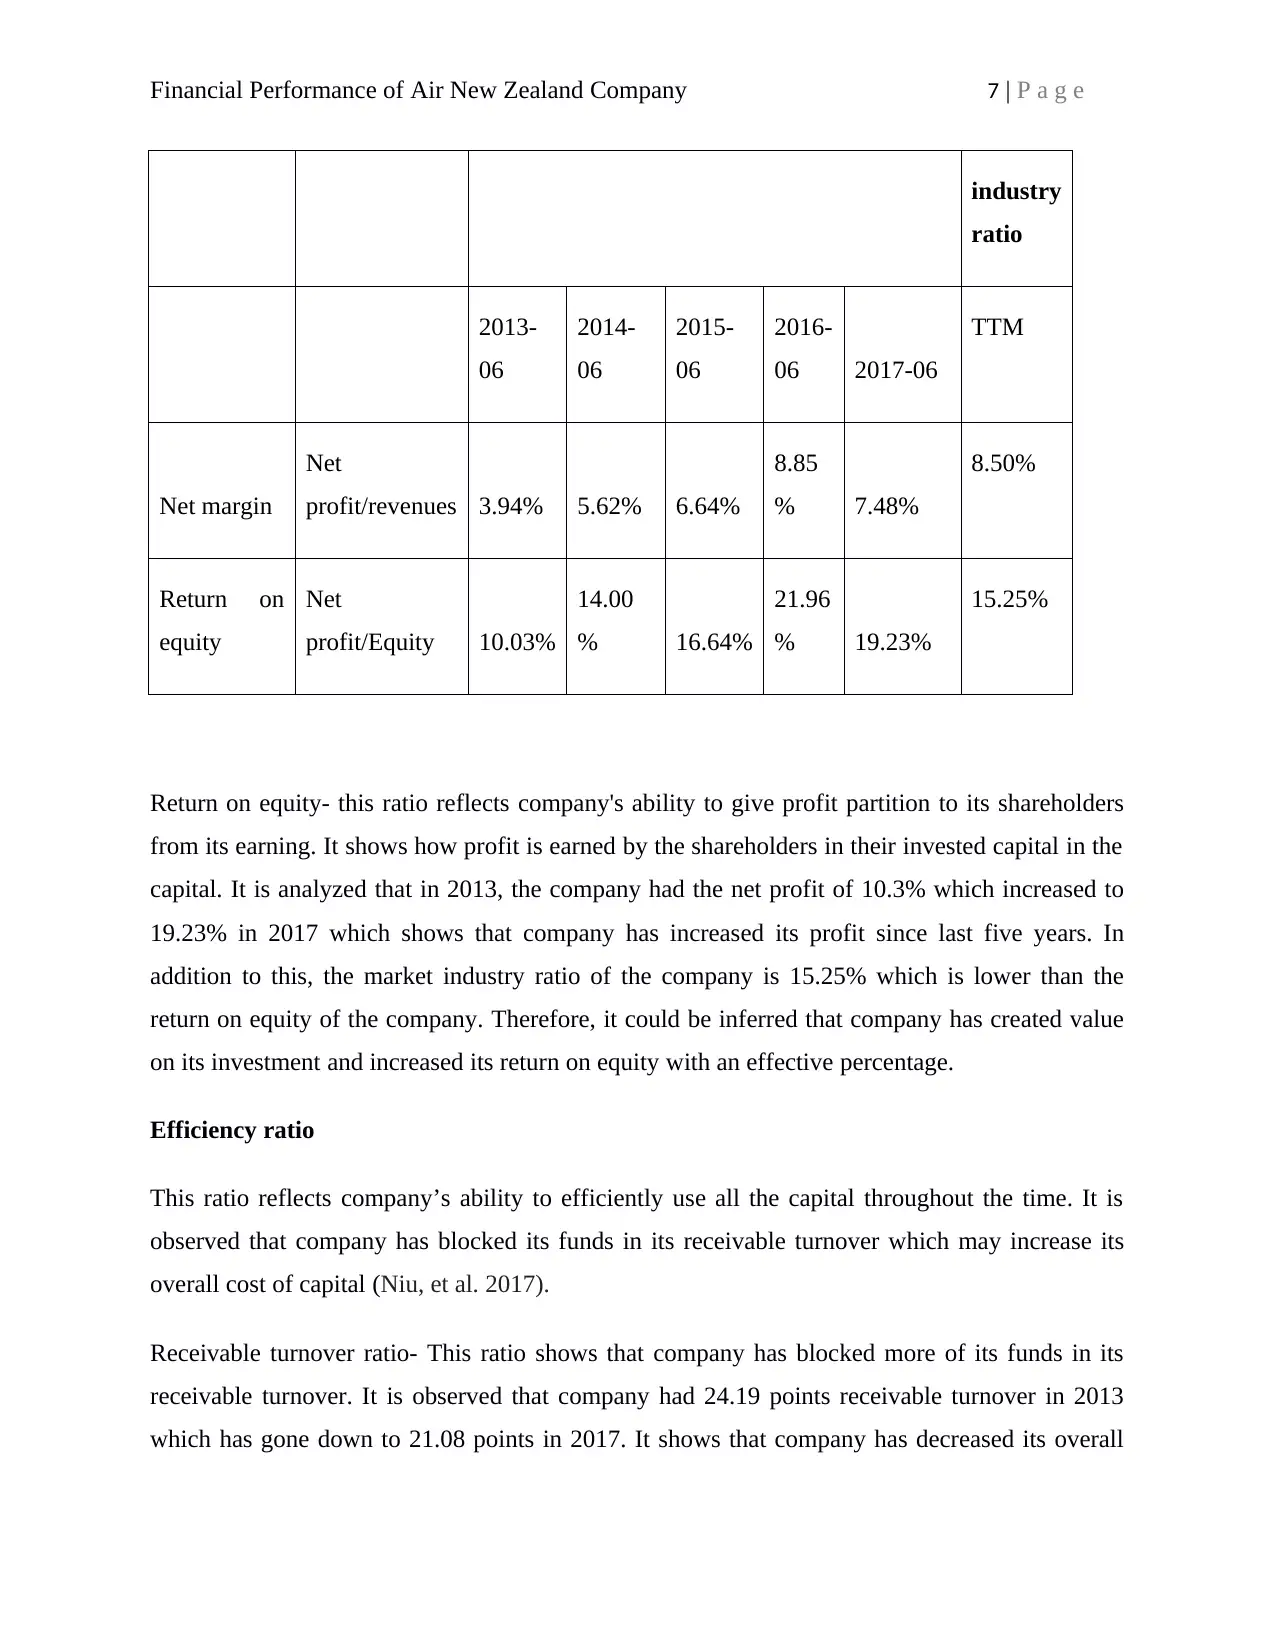
Net margin
Net
profit/revenues 3.94% 5.62% 6.64%
8.85
% 7.48%
8.50%
Return on
equity
Net
profit/Equity 10.03%
14.00
% 16.64%
21.96
% 19.23%
15.25%
Return on equity- this ratio reflects company's ability to give profit partition to its shareholders
from its earning. It shows how profit is earned by the shareholders in their invested capital in the
capital. It is analyzed that in 2013, the company had the net profit of 10.3% which increased to
19.23% in 2017 which shows that company has increased its profit since last five years. In
addition to this, the market industry ratio of the company is 15.25% which is lower than the
return on equity of the company. Therefore, it could be inferred that company has created value
on its investment and increased its return on equity with an effective percentage.
Efficiency ratio
This ratio reflects company’s ability to efficiently use all the capital throughout the time. It is
observed that company has blocked its funds in its receivable turnover which may increase its
overall cost of capital (Niu, et al. 2017).
Receivable turnover ratio- This ratio shows that company has blocked more of its funds in its
receivable turnover. It is observed that company had 24.19 points receivable turnover in 2013
which has gone down to 21.08 points in 2017. It shows that company has decreased its overall
industry
ratio
2013-
06
2014-
06
2015-
06
2016-
06 2017-06
TTM
Net margin
Net
profit/revenues 3.94% 5.62% 6.64%
8.85
% 7.48%
8.50%
Return on
equity
Net
profit/Equity 10.03%
14.00
% 16.64%
21.96
% 19.23%
15.25%
Return on equity- this ratio reflects company's ability to give profit partition to its shareholders
from its earning. It shows how profit is earned by the shareholders in their invested capital in the
capital. It is analyzed that in 2013, the company had the net profit of 10.3% which increased to
19.23% in 2017 which shows that company has increased its profit since last five years. In
addition to this, the market industry ratio of the company is 15.25% which is lower than the
return on equity of the company. Therefore, it could be inferred that company has created value
on its investment and increased its return on equity with an effective percentage.
Efficiency ratio
This ratio reflects company’s ability to efficiently use all the capital throughout the time. It is
observed that company has blocked its funds in its receivable turnover which may increase its
overall cost of capital (Niu, et al. 2017).
Receivable turnover ratio- This ratio shows that company has blocked more of its funds in its
receivable turnover. It is observed that company had 24.19 points receivable turnover in 2013
which has gone down to 21.08 points in 2017. It shows that company has decreased its overall
Paraphrase This Document
Need a fresh take? Get an instant paraphrase of this document with our AI Paraphraser
Financial Performance of Air New Zealand Company 8 | P a g e
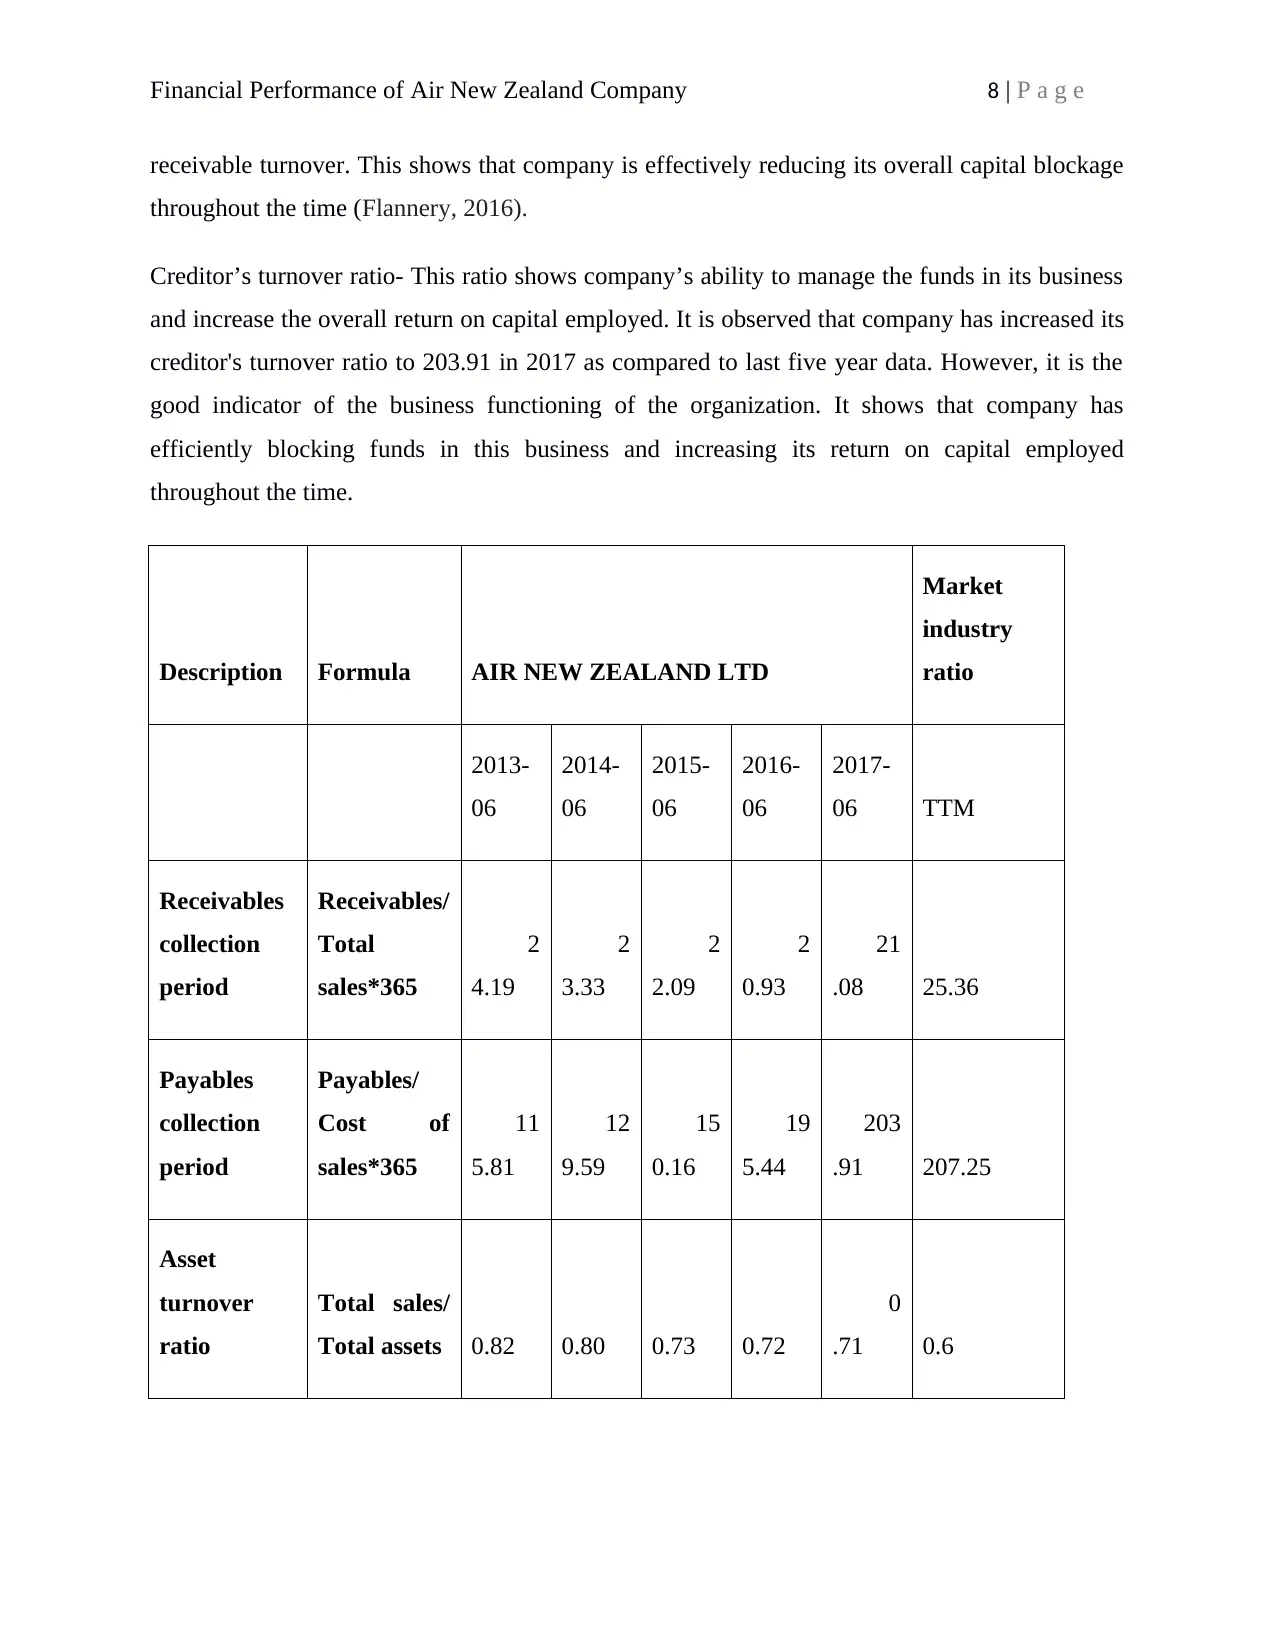
receivable turnover. This shows that company is effectively reducing its overall capital blockage
throughout the time (Flannery, 2016).
Creditor’s turnover ratio- This ratio shows company’s ability to manage the funds in its business
and increase the overall return on capital employed. It is observed that company has increased its
creditor's turnover ratio to 203.91 in 2017 as compared to last five year data. However, it is the
good indicator of the business functioning of the organization. It shows that company has
efficiently blocking funds in this business and increasing its return on capital employed
throughout the time.
Description Formula AIR NEW ZEALAND LTD
Market
industry
ratio
2013-
06
2014-
06
2015-
06
2016-
06
2017-
06 TTM
Receivables
collection
period
Receivables/
Total
sales*365
2
4.19
2
3.33
2
2.09
2
0.93
21
.08 25.36
Payables
collection
period
Payables/
Cost of
sales*365
11
5.81
12
9.59
15
0.16
19
5.44
203
.91 207.25
Asset
turnover
ratio
Total sales/
Total assets 0.82 0.80 0.73 0.72
0
.71 0.6
Financial Performance of Air New Zealand Company 9 | P a g e
Assets turnover ratio- This ratio shows company’s ability to deploy its overall sales to create
value. It is observed that company has increased its assets turnover ratio by increasing its overall
creditors throughout the time. The assets turnover of the market industry is .6 which is lower
than the data shown by the Air New Zealand Company. Therefore, it is inferred that company
has maintained an effective assets turnover ratio.
Solvency ratio
This ratio helps in assessment of the financial risk and capital structure of the organization. It is
observed that solvency ratio of the company has been dividing into following two parts (Ehiedu,
2014).
Debt to equity ratio- This ratio shows that company has increased its debt portion since last five
years. In 2017, Air New Zealand Company has 2.61 debts to equity ratio. However, keeping debt
to equity ratio may result in decreased financial leverage but at the same time, it will increase the
overall cost of capital of the organization. It is assessed that company needs to establish the
proper equilibrium in its debt to equity. The debt to equity ratio of the market industry is 3.61
which show that company could increase the overall efficiency by increasing its debt portion
(Douglas, & Tan, 2017).
Descriptio
n Formula AIR NEW ZEALAND LTD
Market
industr
y ratio
2013-06 2014-06 2015-06
2016
-06 2017-06 TTM
⊘ This is a preview!⊘
Do you want full access?
Subscribe today to unlock all pages.
Trusted by 1+ million students worldwide
Financial Performance of Air New Zealand Company 10 | P a g e
Debt to
Equity
Ratio
Debt/
Equity
2.
09
2.
13
2.
45 2.44
2.
61 3.61
Debt to
assets
Debt/ Total
assets
0.
68
0.
68
0.
71 0.71
0.
72 0.93
Gearing
ratio
EBIT/
interest
3.406593
4
4.477777
8
4.870370
4 7.1
6.56321
8 7.2
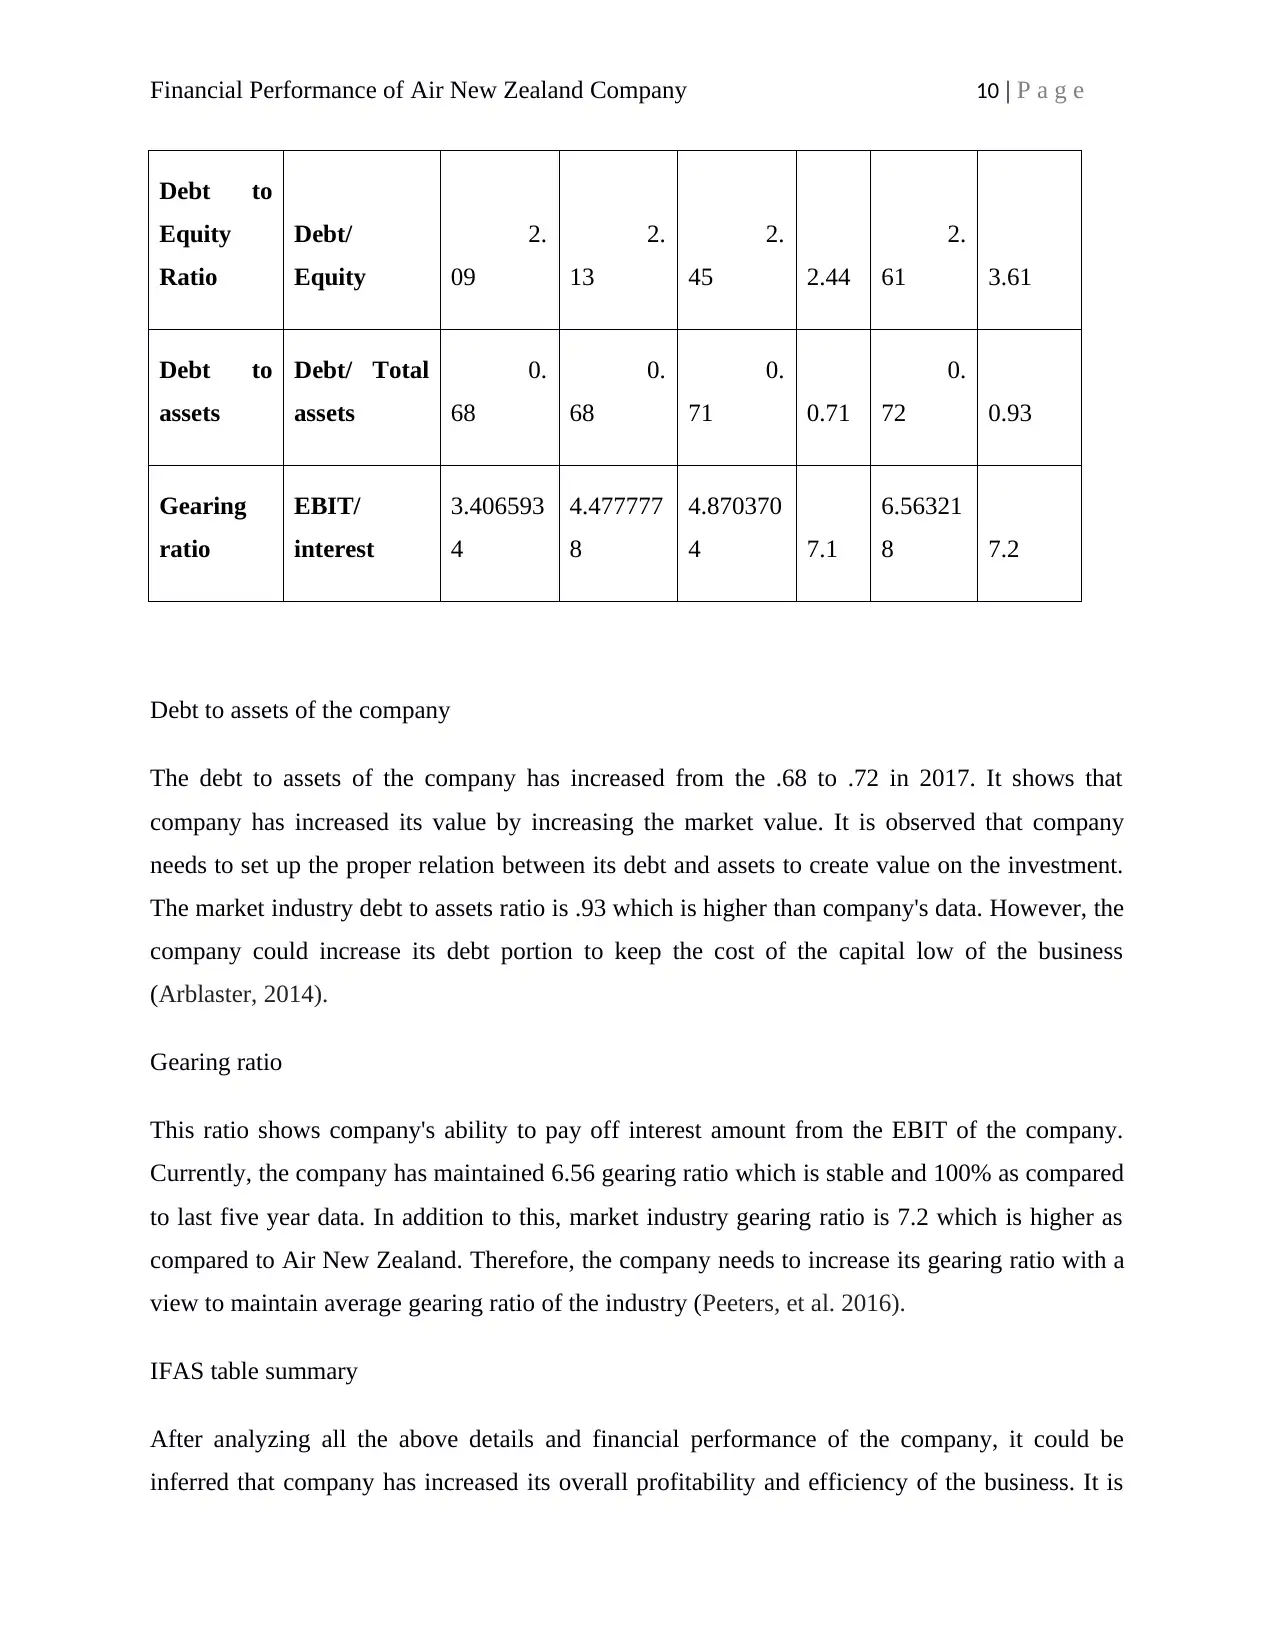
Debt to assets of the company
The debt to assets of the company has increased from the .68 to .72 in 2017. It shows that
company has increased its value by increasing the market value. It is observed that company
needs to set up the proper relation between its debt and assets to create value on the investment.
The market industry debt to assets ratio is .93 which is higher than company's data. However, the
company could increase its debt portion to keep the cost of the capital low of the business
(Arblaster, 2014).
Gearing ratio
This ratio shows company's ability to pay off interest amount from the EBIT of the company.
Currently, the company has maintained 6.56 gearing ratio which is stable and 100% as compared
to last five year data. In addition to this, market industry gearing ratio is 7.2 which is higher as
compared to Air New Zealand. Therefore, the company needs to increase its gearing ratio with a
view to maintain average gearing ratio of the industry (Peeters, et al. 2016).
IFAS table summary
After analyzing all the above details and financial performance of the company, it could be
inferred that company has increased its overall profitability and efficiency of the business. It is
Debt to
Equity
Ratio
Debt/
Equity
2.
09
2.
13
2.
45 2.44
2.
61 3.61
Debt to
assets
Debt/ Total
assets
0.
68
0.
68
0.
71 0.71
0.
72 0.93
Gearing
ratio
EBIT/
interest
3.406593
4
4.477777
8
4.870370
4 7.1
6.56321
8 7.2
Debt to assets of the company
The debt to assets of the company has increased from the .68 to .72 in 2017. It shows that
company has increased its value by increasing the market value. It is observed that company
needs to set up the proper relation between its debt and assets to create value on the investment.
The market industry debt to assets ratio is .93 which is higher than company's data. However, the
company could increase its debt portion to keep the cost of the capital low of the business
(Arblaster, 2014).
Gearing ratio
This ratio shows company's ability to pay off interest amount from the EBIT of the company.
Currently, the company has maintained 6.56 gearing ratio which is stable and 100% as compared
to last five year data. In addition to this, market industry gearing ratio is 7.2 which is higher as
compared to Air New Zealand. Therefore, the company needs to increase its gearing ratio with a
view to maintain average gearing ratio of the industry (Peeters, et al. 2016).
IFAS table summary
After analyzing all the above details and financial performance of the company, it could be
inferred that company has increased its overall profitability and efficiency of the business. It is
Paraphrase This Document
Need a fresh take? Get an instant paraphrase of this document with our AI Paraphraser
Financial Performance of Air New Zealand Company 11 | P a g e
assessed that company has efficiently used its capital and blocked less amount of funds in its
business. It is revealed that company has a low financial risk in its business. If it wants to lower
down its cost of capital of the business then the same could be easily done by the management of
the company by increasing the debt portion (White, Sondh, and Fried, 2015).
Corporate culture
The corporate culture of the Air New Zealand Company is highly advance and all the employees
of the company need to follow standards work policies and rules. It is observed that company has
installed advanced system and technologies in its business with a view to set up new automation
in the work system of the organization. The corporate culture of the company is highly open and
employees oriented which is designed with a view to promote the employees and set up nexus
between employee’s growth and organization development (Brown, 2016).
Corporate resources
This ratio analysis helps in assessment of the financial performance of the company by
establishing the relation between the two factors. It is observed that company has increased its
profitability and overall turnover since last five year which is the positive indicator of the
effective business functioning of the organization. However, with the changes in time, the
company has increased its debt portion with a view to reducing the cost of capital of the business
and ultimately it has resulted to increase in the financial risk of the organization. The total
resources of the company are NZ $ 7,251.00 million which shows that company has a strong
financial position (Vibart, et al. 2015).
Summary of Internal Factors
This internal factor analysis summary assists in evaluating the strength, weakness,
opportunity, and threats of the organization. It is observed that company has strong research and
development department which is indulged in identifying the proper development of the
business. The strong management team of the Air New Zealand accompanied or accustomed to
act as per the directions and instruction of the Christopher Luxon, CEO is also making efforts to
Financial Performance of Air New Zealand Company 12 | P a g e
implement the strategic plan. The team of Air New Zealand has consistently increased its overall
turnover by attracting more clients through its high discounts and offers. The total revenue of the
company is NZ$5,231 million (2016) which is 20% higher as compared to last five year annual
data. In New Zealand, Air New Zealand has set up its business on an international level by
customizing its air services to local and international clients (Weygandt, Kimmel, and Kieso,
2015).
⊘ This is a preview!⊘
Do you want full access?
Subscribe today to unlock all pages.
Trusted by 1+ million students worldwide
1 out of 40
Related Documents


Your All-in-One AI-Powered Toolkit for Academic Success.
+13062052269
info@desklib.com
Available 24*7 on WhatsApp / Email
![[object Object]](/_next/static/media/star-bottom.7253800d.svg)
Unlock your academic potential
Copyright © 2020–2026 A2Z Services. All Rights Reserved. Developed and managed by ZUCOL.