Analysis of Revenue Sources, Cost Structures of Air New Zealand
VerifiedAdded on 2023/06/08
|8
|1987
|70
Report
AI Summary
This report provides an analysis of Air New Zealand's revenue sources and cost structures, covering the period from 2012 to 2017. The analysis includes a review of the airline's operational revenues, net assets, working capital, earnings per share, and total comprehensive income. The report identifies key revenue streams such as passenger revenues, cargo revenues, and contract services, while also examining significant cost drivers like fuel, labor, and aircraft operations. The report concludes that Air New Zealand has demonstrated exceptional growth and profitability in the airline industry. This document is available on Desklib, a platform offering a range of study tools and resources for students.
Contents
1
2 Introduction
The airline industry is fragmented withseveral regional carriers such as Air2there, Air Chathans;
international carriers such as Qantas. (Everipedia International, 2018)The New Zealand Airline
Industry is a worth over $10 billions and sizeabele chunk of this indusry has been captured by Air
New Zealand, the state owned Full services Carrier Network. Air Zealand does not just provide civil
avaiation services to passengers but also provides a variety of other ancilliary services such as
Aircraft Leasing, Financing and Insurance. The airline alone has a fleet of 105 aircraft and 27 on
order. (Air New Zealand 2017)
The Air New Zealand Group consists of several subsidiaries such as (Air New Zealand 2018) and
joint ventures that do not just hep provide aircraft services but also data analytics, insurance and
more.
3 Revenues and Profitability
The Air New Zealand group total Operational revenues have grown consistently over the period of
last six years and showed a dip only in the year 2017. These revenues do not just include revenues
from passenger operations but also revenues from leasing and financing of air craft, lease of
poreperty and equipment and also, payment earned from interest received as well as foreign
exchnage. However, the year after that i.e in the year 2017, the revnues dipped sharply to 4376
million New Zealand Dollars. (Air New Zealand, 2018)
However, accounting for revenues alone, would be a folly and provide an incomplete picture. In
order to understand the financial position of the aircraft carrier better, some profitability and
solvency measures must be looked at:
Net Assets
Net Assets describe the position of the assets at the end of the year. (CPA Australia, 2017) They
provide a significant amount of insight into the holdings that the airline currently holds.
Paraphrase This Document
Need a fresh take? Get an instant paraphrase of this document with our AI Paraphraser
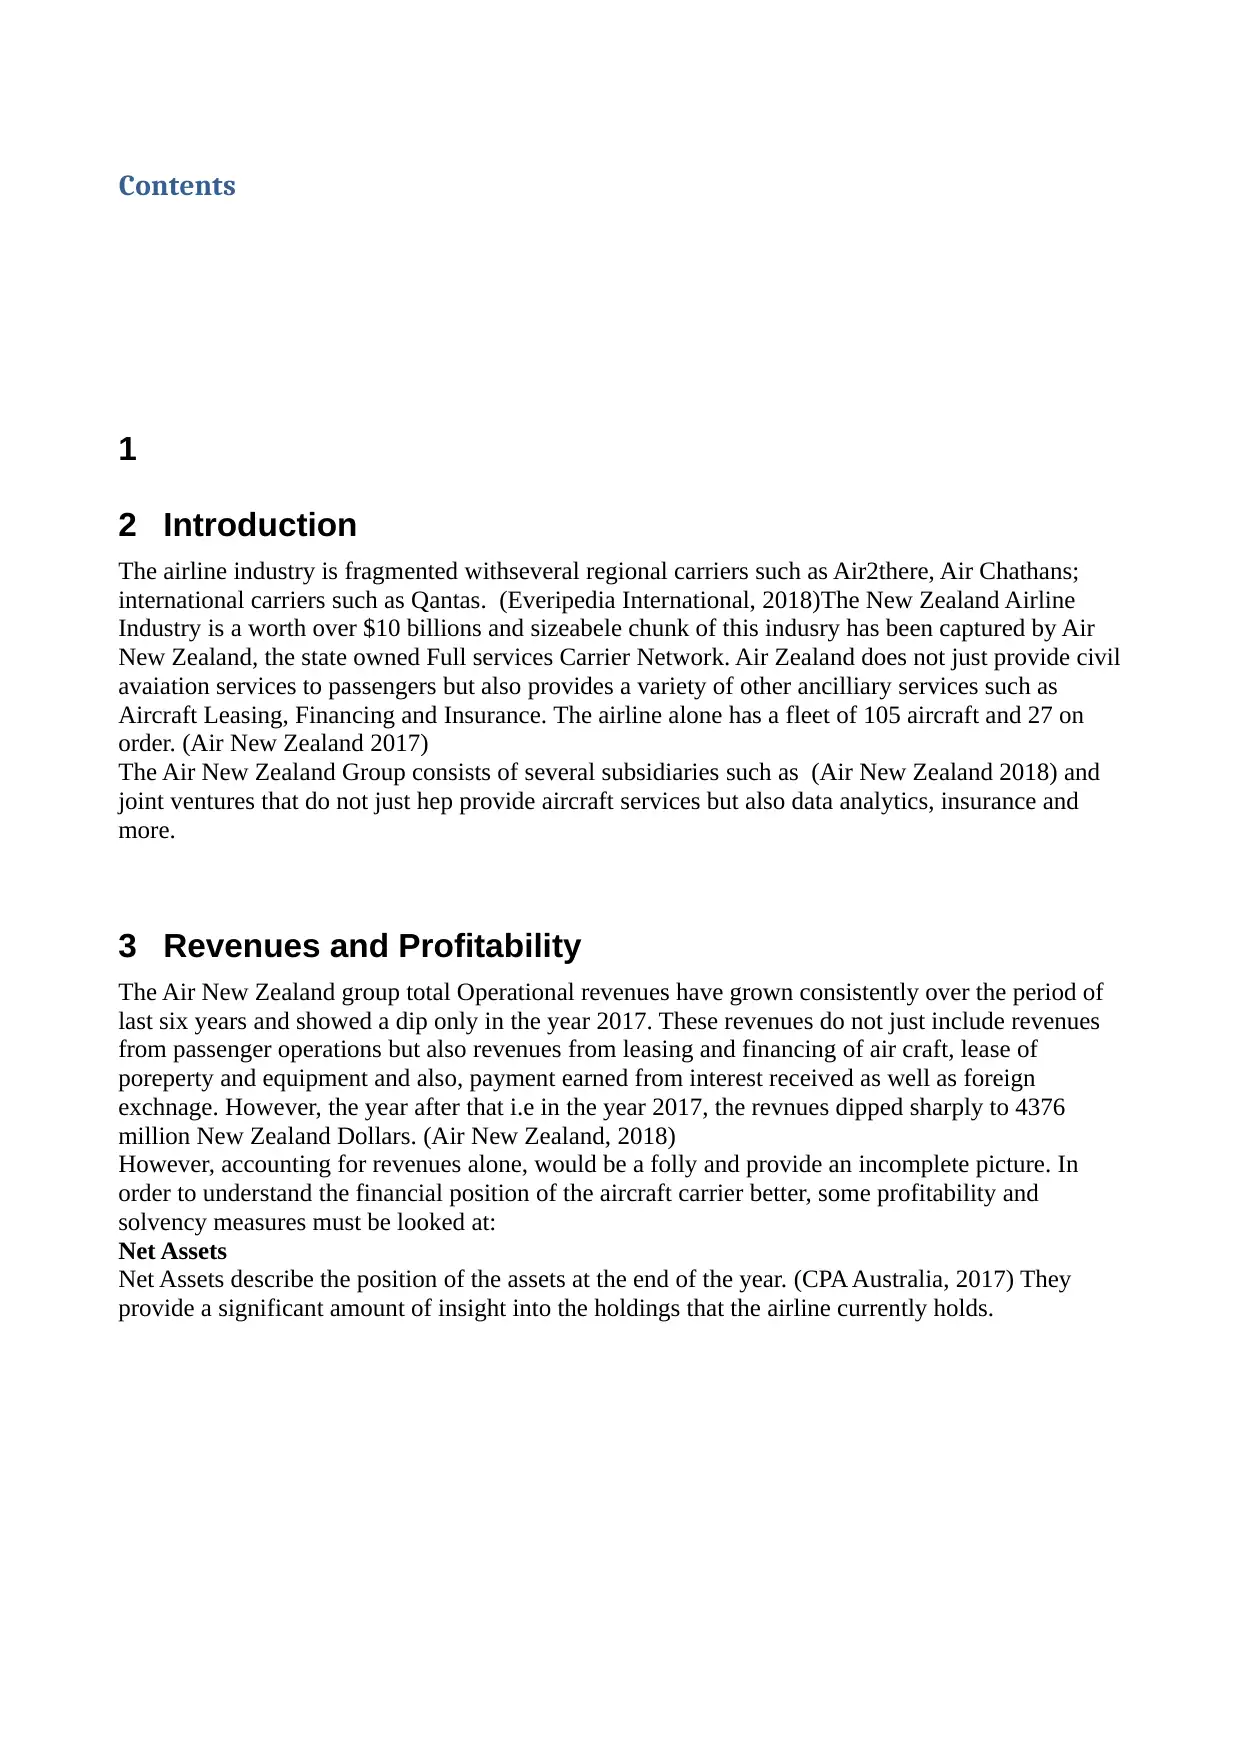
Net Assets have shown stable growth , implying that the Group has been converting significant
amounts of cash into holding such as pplant , equipment and other sources of revenues such as
financial investment.
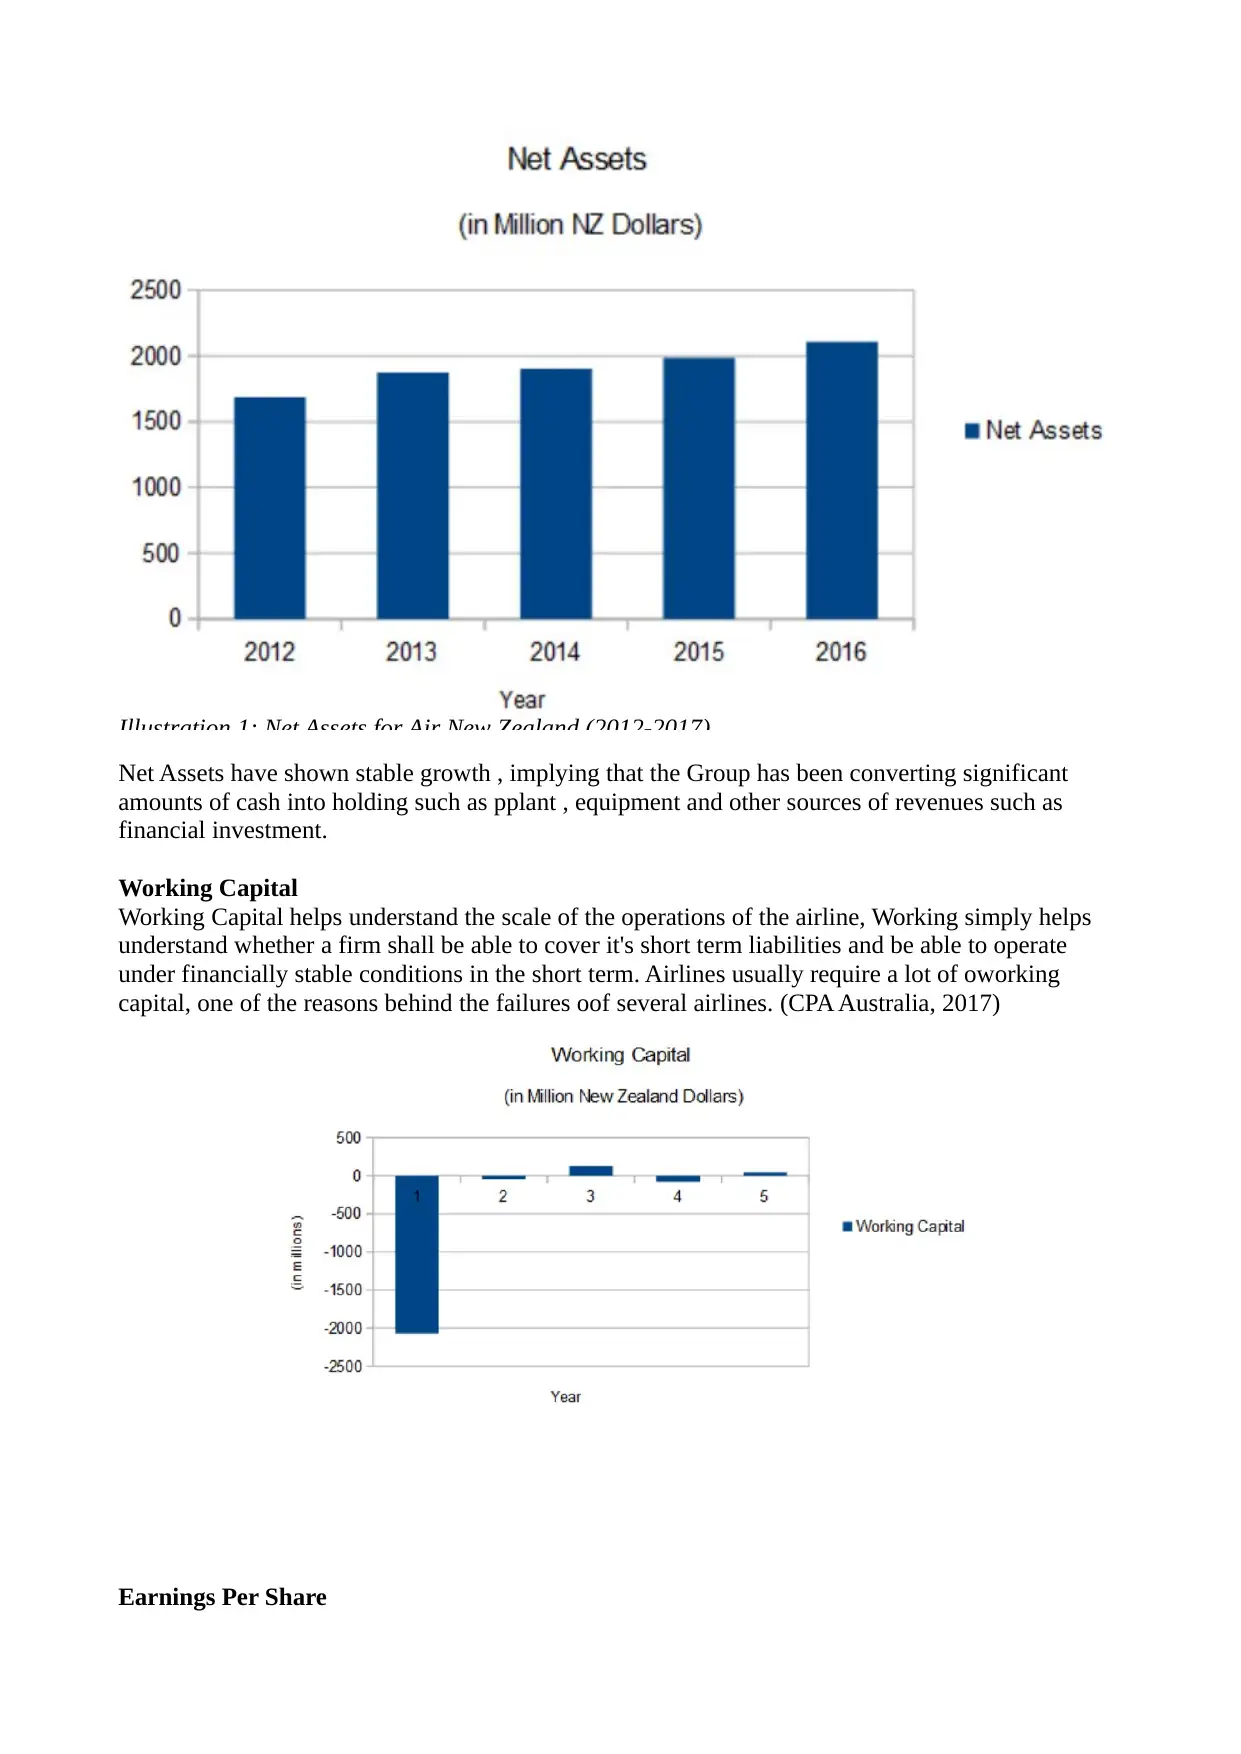
Working Capital
Working Capital helps understand the scale of the operations of the airline, Working simply helps
understand whether a firm shall be able to cover it's short term liabilities and be able to operate
under financially stable conditions in the short term. Airlines usually require a lot of oworking
capital, one of the reasons behind the failures oof several airlines. (CPA Australia, 2017)
Earnings Per Share
Illustration 1: Net Assets for Air New Zealand (2012-2017)
amounts of cash into holding such as pplant , equipment and other sources of revenues such as
financial investment.
Working Capital
Working Capital helps understand the scale of the operations of the airline, Working simply helps
understand whether a firm shall be able to cover it's short term liabilities and be able to operate
under financially stable conditions in the short term. Airlines usually require a lot of oworking
capital, one of the reasons behind the failures oof several airlines. (CPA Australia, 2017)
Earnings Per Share
Illustration 1: Net Assets for Air New Zealand (2012-2017)
Earning Per Share is simply the amount of profit available per share. Earning per share may be used
to understand the profitability of an airline in the simplest way as well as provide an indicator of the
efficiecy at which it is managed. (CPA Australia, 2017)
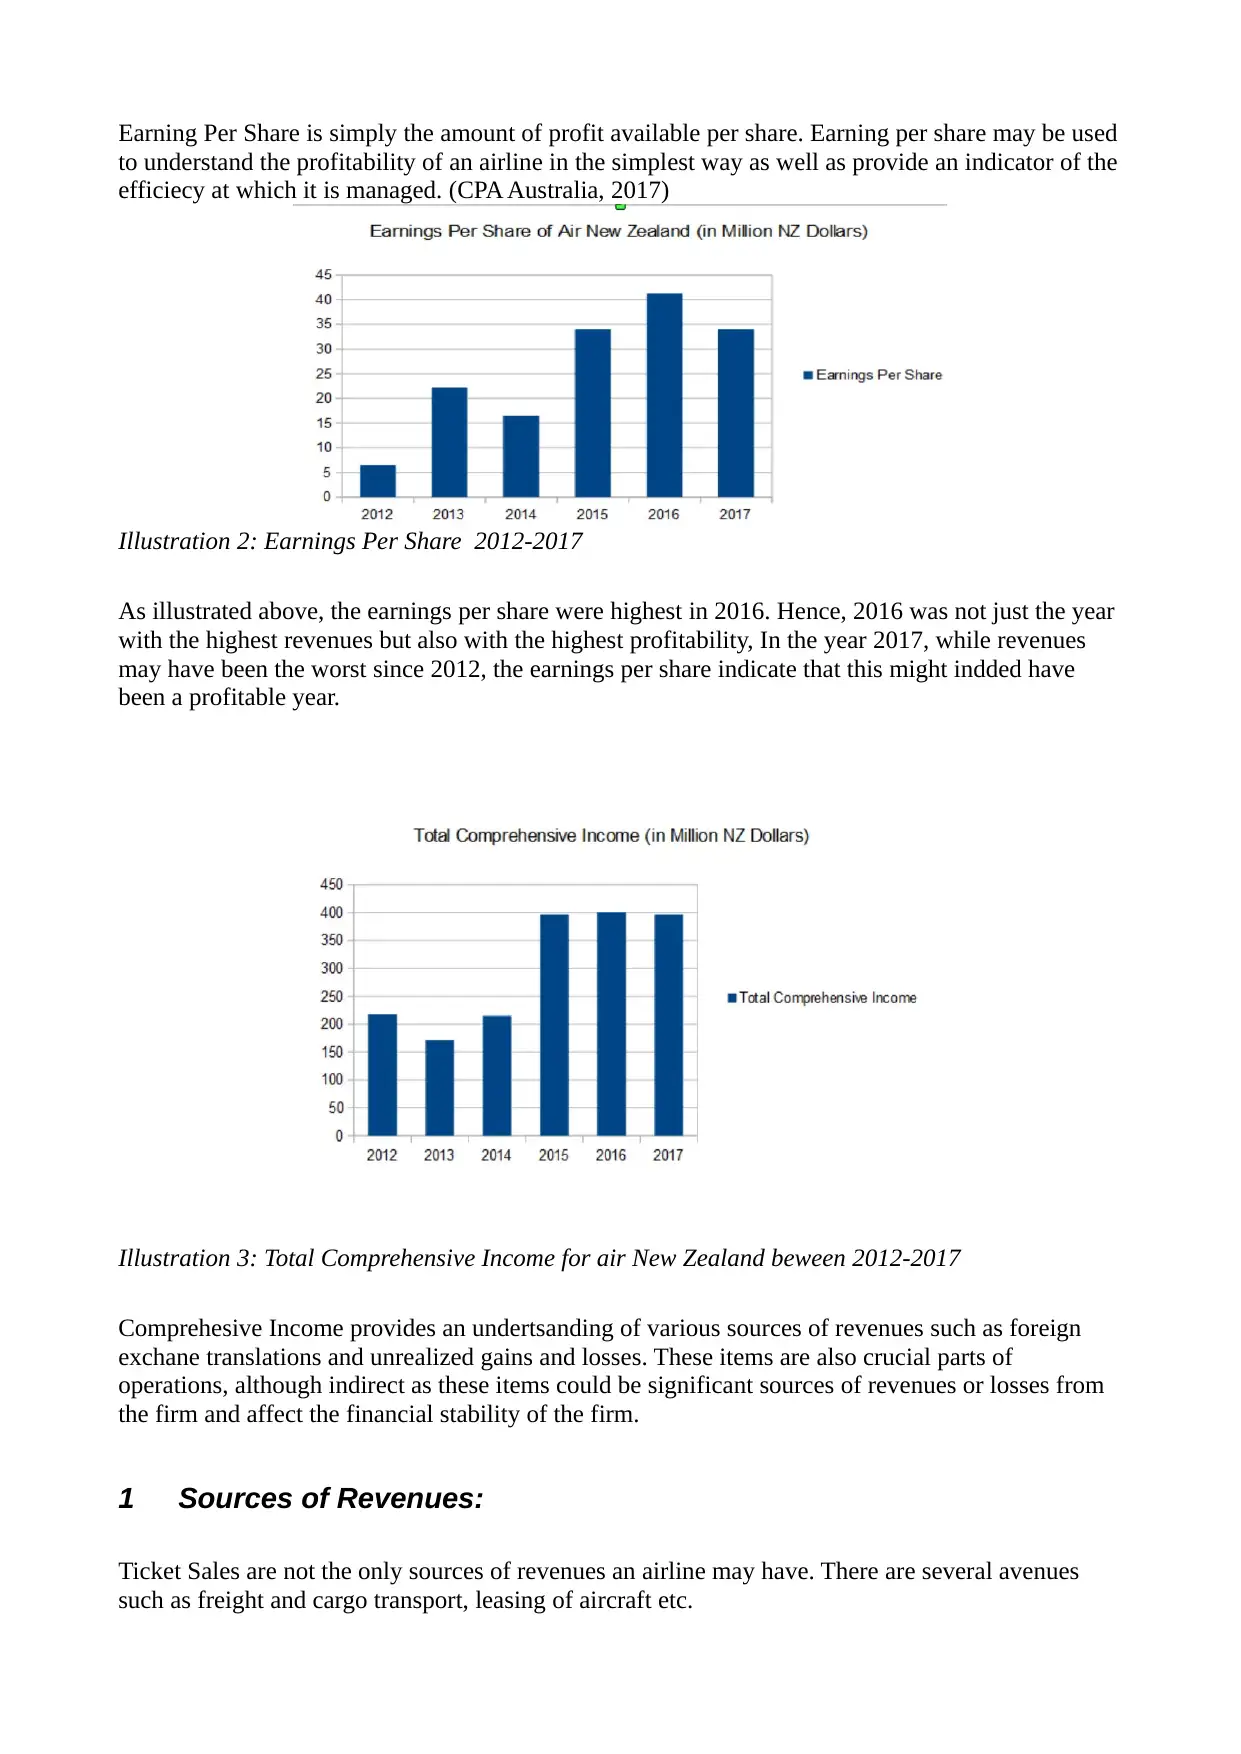
Illustration 2: Earnings Per Share 2012-2017
As illustrated above, the earnings per share were highest in 2016. Hence, 2016 was not just the year
with the highest revenues but also with the highest profitability, In the year 2017, while revenues
may have been the worst since 2012, the earnings per share indicate that this might indded have
been a profitable year.
Illustration 3: Total Comprehensive Income for air New Zealand beween 2012-2017
Comprehesive Income provides an undertsanding of various sources of revenues such as foreign
exchane translations and unrealized gains and losses. These items are also crucial parts of
operations, although indirect as these items could be significant sources of revenues or losses from
the firm and affect the financial stability of the firm.
1 Sources of Revenues:
Ticket Sales are not the only sources of revenues an airline may have. There are several avenues
such as freight and cargo transport, leasing of aircraft etc.
to understand the profitability of an airline in the simplest way as well as provide an indicator of the
efficiecy at which it is managed. (CPA Australia, 2017)
Illustration 2: Earnings Per Share 2012-2017
As illustrated above, the earnings per share were highest in 2016. Hence, 2016 was not just the year
with the highest revenues but also with the highest profitability, In the year 2017, while revenues
may have been the worst since 2012, the earnings per share indicate that this might indded have
been a profitable year.
Illustration 3: Total Comprehensive Income for air New Zealand beween 2012-2017
Comprehesive Income provides an undertsanding of various sources of revenues such as foreign
exchane translations and unrealized gains and losses. These items are also crucial parts of
operations, although indirect as these items could be significant sources of revenues or losses from
the firm and affect the financial stability of the firm.
1 Sources of Revenues:
Ticket Sales are not the only sources of revenues an airline may have. There are several avenues
such as freight and cargo transport, leasing of aircraft etc.
⊘ This is a preview!⊘
Do you want full access?
Subscribe today to unlock all pages.
Trusted by 1+ million students worldwide
Given below are some of the reported sources:
Passenger Revenues
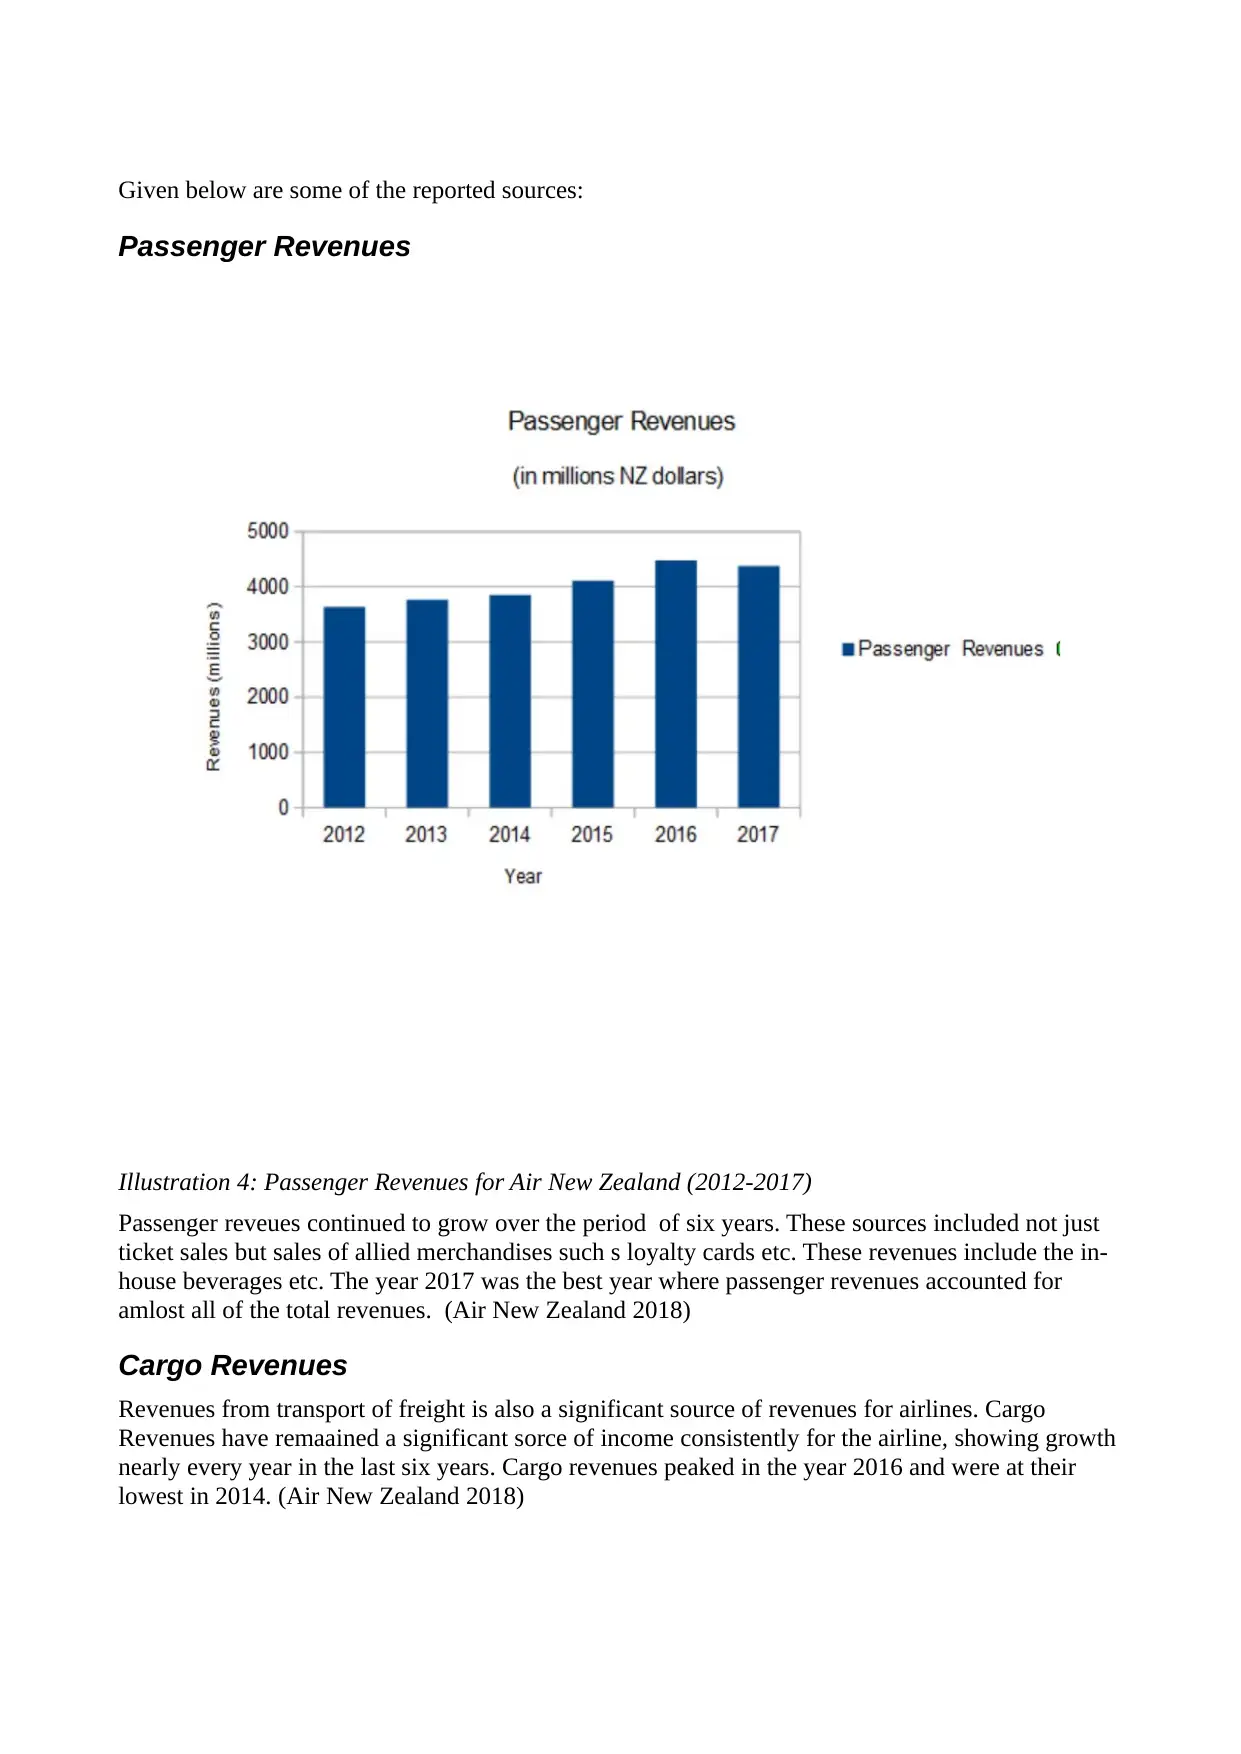
Illustration 4: Passenger Revenues for Air New Zealand (2012-2017)
Passenger reveues continued to grow over the period of six years. These sources included not just
ticket sales but sales of allied merchandises such s loyalty cards etc. These revenues include the in-
house beverages etc. The year 2017 was the best year where passenger revenues accounted for
amlost all of the total revenues. (Air New Zealand 2018)
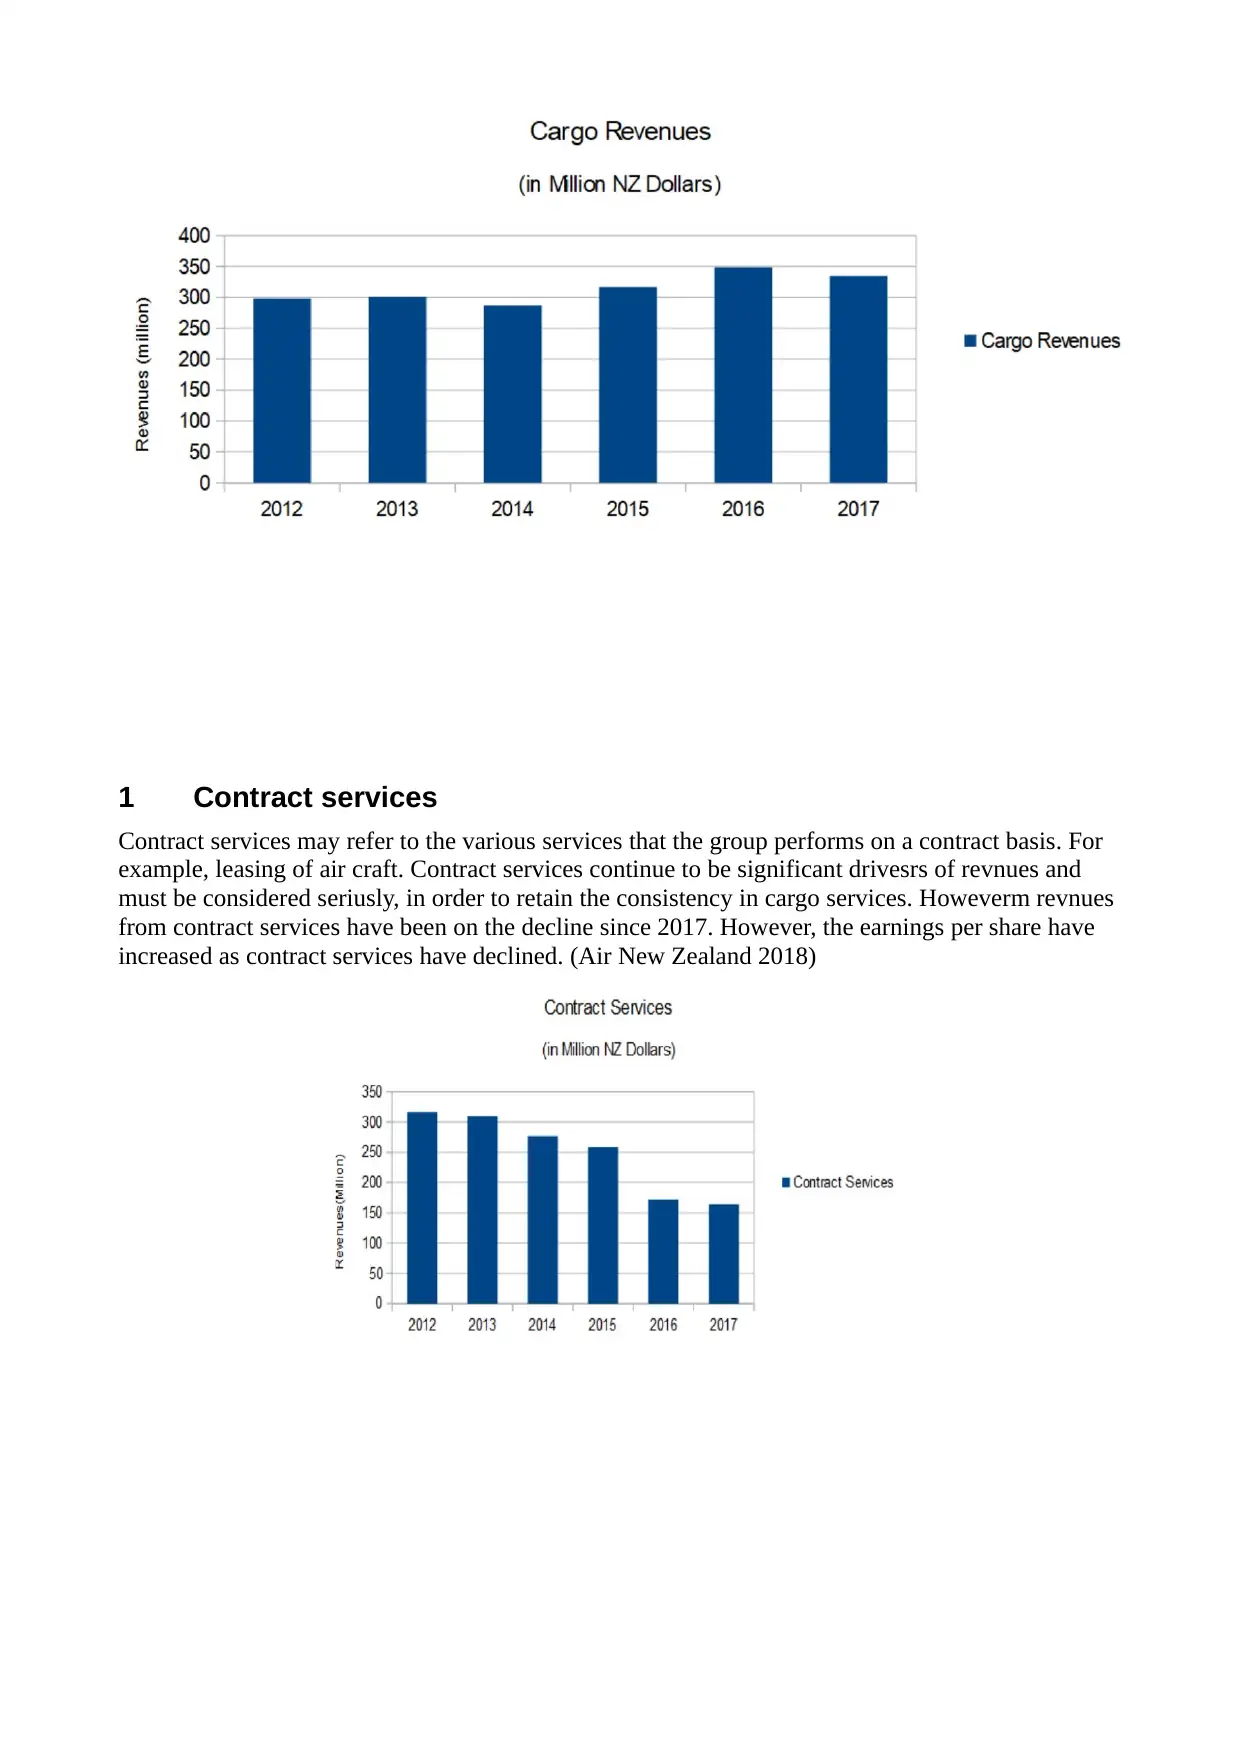
Cargo Revenues
Revenues from transport of freight is also a significant source of revenues for airlines. Cargo
Revenues have remaained a significant sorce of income consistently for the airline, showing growth
nearly every year in the last six years. Cargo revenues peaked in the year 2016 and were at their
lowest in 2014. (Air New Zealand 2018)
Passenger Revenues
Illustration 4: Passenger Revenues for Air New Zealand (2012-2017)
Passenger reveues continued to grow over the period of six years. These sources included not just
ticket sales but sales of allied merchandises such s loyalty cards etc. These revenues include the in-
house beverages etc. The year 2017 was the best year where passenger revenues accounted for
amlost all of the total revenues. (Air New Zealand 2018)
Cargo Revenues
Revenues from transport of freight is also a significant source of revenues for airlines. Cargo
Revenues have remaained a significant sorce of income consistently for the airline, showing growth
nearly every year in the last six years. Cargo revenues peaked in the year 2016 and were at their
lowest in 2014. (Air New Zealand 2018)
Paraphrase This Document
Need a fresh take? Get an instant paraphrase of this document with our AI Paraphraser
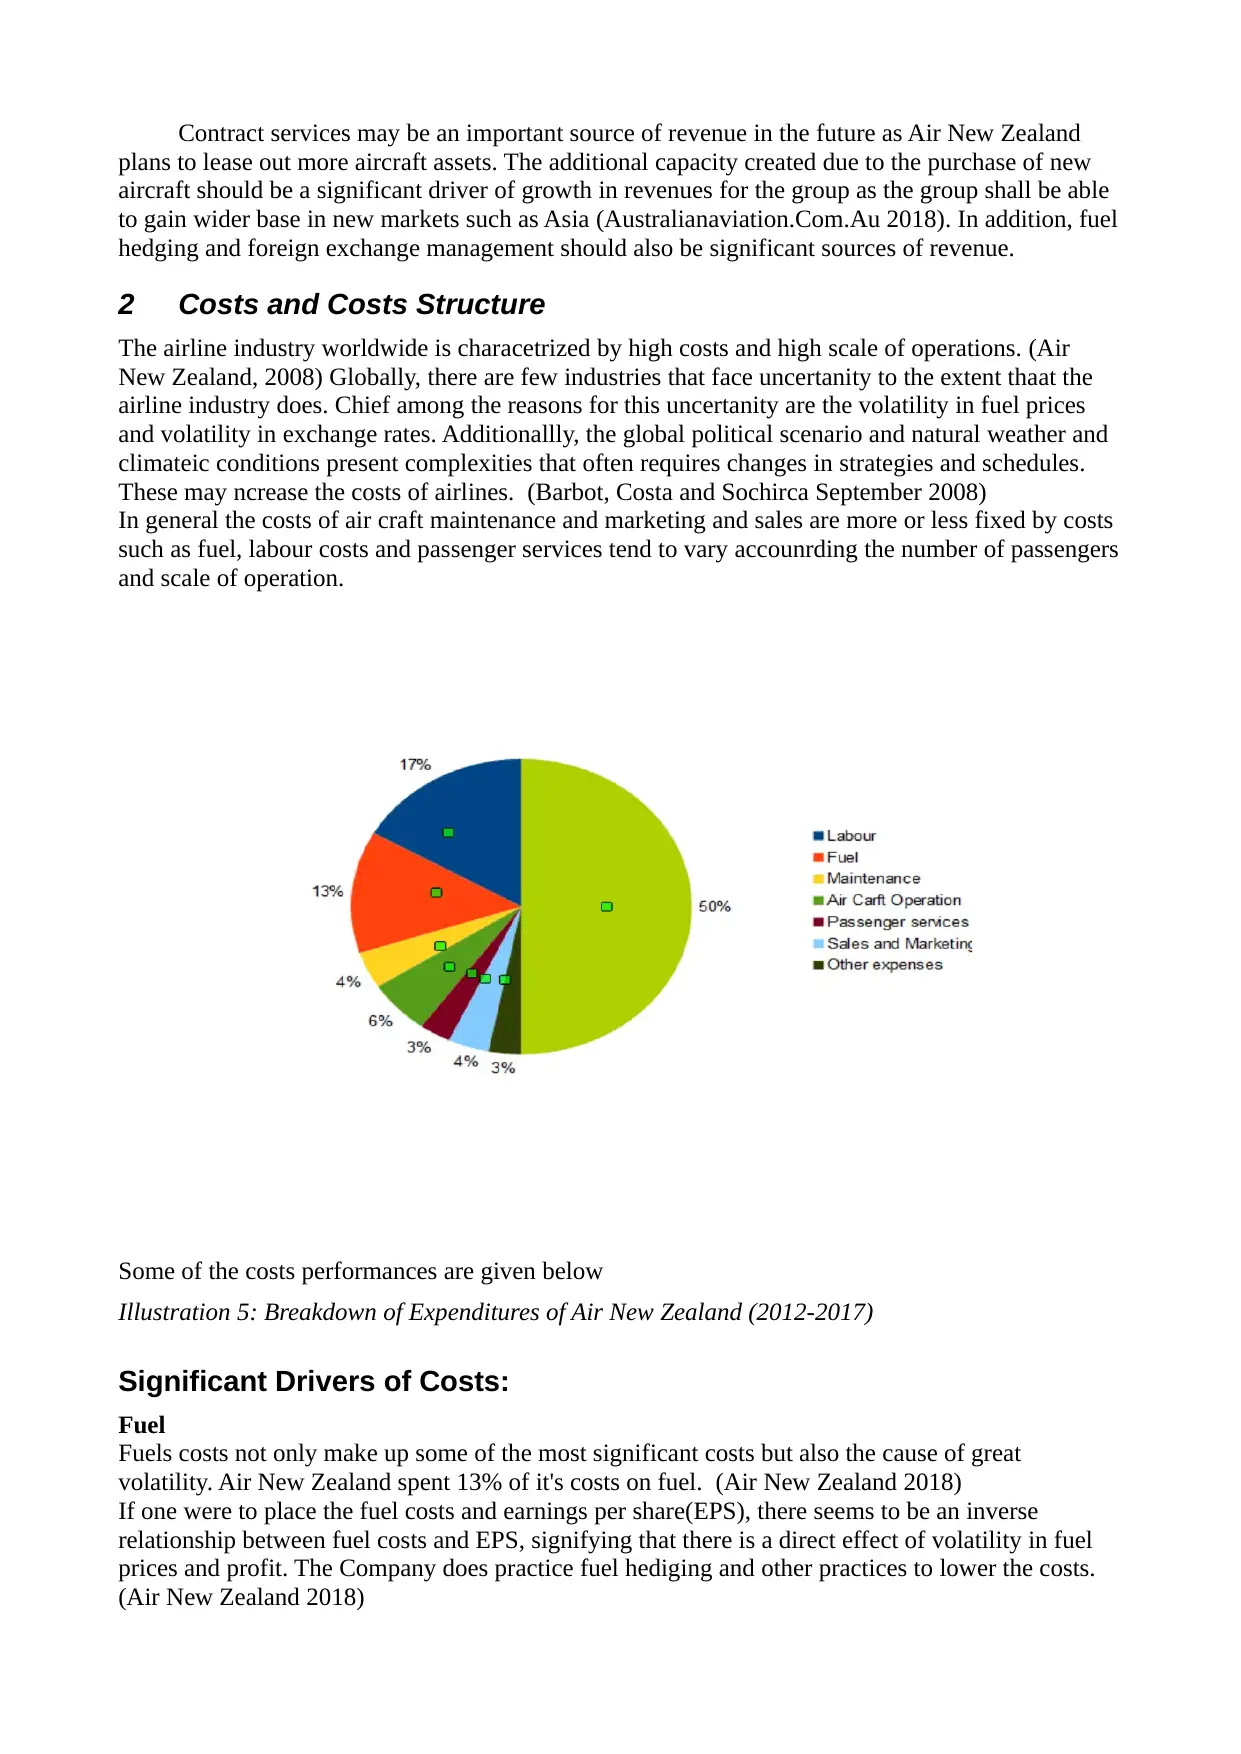
1 Contract services
Contract services may refer to the various services that the group performs on a contract basis. For
example, leasing of air craft. Contract services continue to be significant drivesrs of revnues and
must be considered seriusly, in order to retain the consistency in cargo services. Howeverm revnues
from contract services have been on the decline since 2017. However, the earnings per share have
increased as contract services have declined. (Air New Zealand 2018)
Contract services may be an important source of revenue in the future as Air New Zealand
plans to lease out more aircraft assets. The additional capacity created due to the purchase of new
aircraft should be a significant driver of growth in revenues for the group as the group shall be able
to gain wider base in new markets such as Asia (Australianaviation.Com.Au 2018). In addition, fuel
hedging and foreign exchange management should also be significant sources of revenue.
2 Costs and Costs Structure
The airline industry worldwide is characetrized by high costs and high scale of operations. (Air
New Zealand, 2008) Globally, there are few industries that face uncertanity to the extent thaat the
airline industry does. Chief among the reasons for this uncertanity are the volatility in fuel prices
and volatility in exchange rates. Additionallly, the global political scenario and natural weather and
climateic conditions present complexities that often requires changes in strategies and schedules.
These may ncrease the costs of airlines. (Barbot, Costa and Sochirca September 2008)
In general the costs of air craft maintenance and marketing and sales are more or less fixed by costs
such as fuel, labour costs and passenger services tend to vary accounrding the number of passengers
and scale of operation.
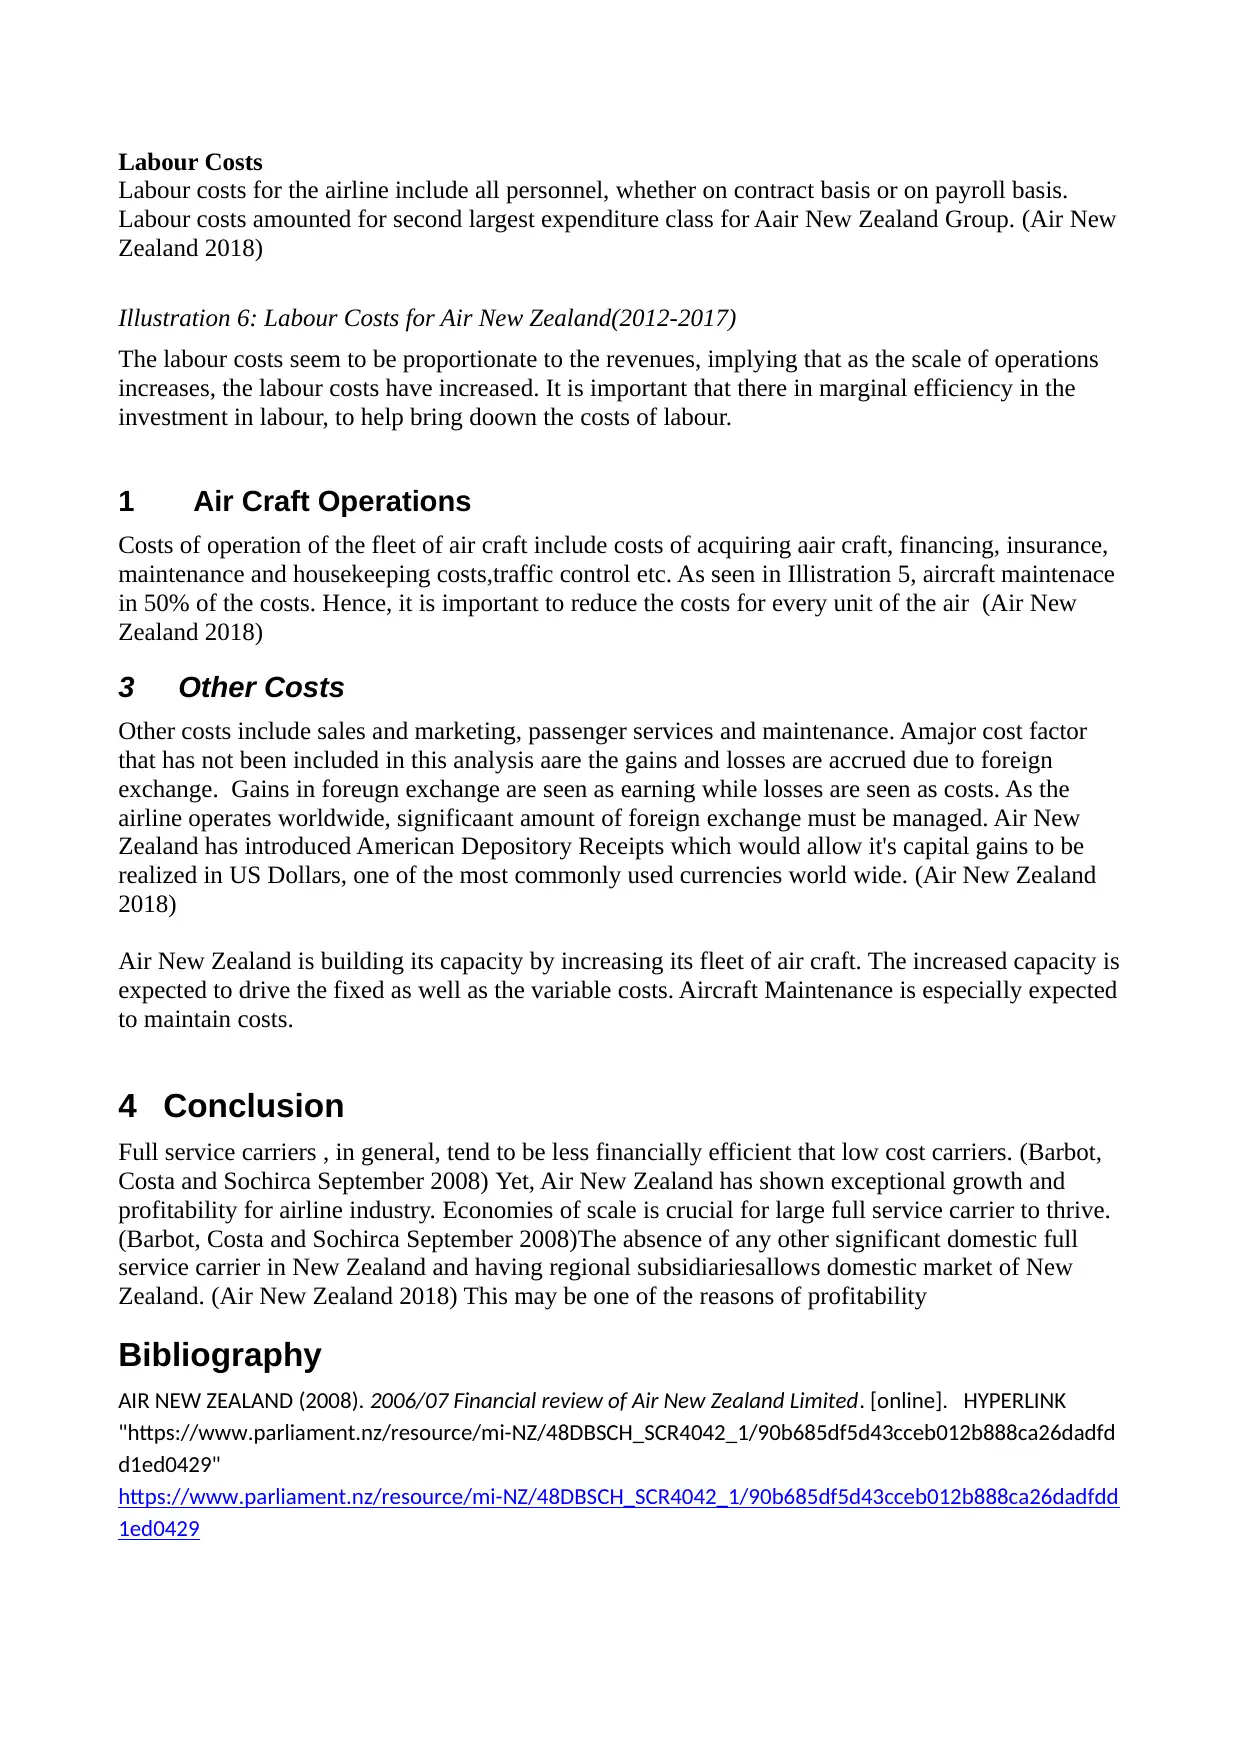
Some of the costs performances are given below
Illustration 5: Breakdown of Expenditures of Air New Zealand (2012-2017)
Significant Drivers of Costs:
Fuel
Fuels costs not only make up some of the most significant costs but also the cause of great
volatility. Air New Zealand spent 13% of it's costs on fuel. (Air New Zealand 2018)
If one were to place the fuel costs and earnings per share(EPS), there seems to be an inverse
relationship between fuel costs and EPS, signifying that there is a direct effect of volatility in fuel
prices and profit. The Company does practice fuel hediging and other practices to lower the costs.
(Air New Zealand 2018)
plans to lease out more aircraft assets. The additional capacity created due to the purchase of new
aircraft should be a significant driver of growth in revenues for the group as the group shall be able
to gain wider base in new markets such as Asia (Australianaviation.Com.Au 2018). In addition, fuel
hedging and foreign exchange management should also be significant sources of revenue.
2 Costs and Costs Structure
The airline industry worldwide is characetrized by high costs and high scale of operations. (Air
New Zealand, 2008) Globally, there are few industries that face uncertanity to the extent thaat the
airline industry does. Chief among the reasons for this uncertanity are the volatility in fuel prices
and volatility in exchange rates. Additionallly, the global political scenario and natural weather and
climateic conditions present complexities that often requires changes in strategies and schedules.
These may ncrease the costs of airlines. (Barbot, Costa and Sochirca September 2008)
In general the costs of air craft maintenance and marketing and sales are more or less fixed by costs
such as fuel, labour costs and passenger services tend to vary accounrding the number of passengers
and scale of operation.
Some of the costs performances are given below
Illustration 5: Breakdown of Expenditures of Air New Zealand (2012-2017)
Significant Drivers of Costs:
Fuel
Fuels costs not only make up some of the most significant costs but also the cause of great
volatility. Air New Zealand spent 13% of it's costs on fuel. (Air New Zealand 2018)
If one were to place the fuel costs and earnings per share(EPS), there seems to be an inverse
relationship between fuel costs and EPS, signifying that there is a direct effect of volatility in fuel
prices and profit. The Company does practice fuel hediging and other practices to lower the costs.
(Air New Zealand 2018)
⊘ This is a preview!⊘
Do you want full access?
Subscribe today to unlock all pages.
Trusted by 1+ million students worldwide
Labour Costs
Labour costs for the airline include all personnel, whether on contract basis or on payroll basis.
Labour costs amounted for second largest expenditure class for Aair New Zealand Group. (Air New
Zealand 2018)
Illustration 6: Labour Costs for Air New Zealand(2012-2017)
The labour costs seem to be proportionate to the revenues, implying that as the scale of operations
increases, the labour costs have increased. It is important that there in marginal efficiency in the
investment in labour, to help bring doown the costs of labour.
1 Air Craft Operations
Costs of operation of the fleet of air craft include costs of acquiring aair craft, financing, insurance,
maintenance and housekeeping costs,traffic control etc. As seen in Illistration 5, aircraft maintenace
in 50% of the costs. Hence, it is important to reduce the costs for every unit of the air (Air New
Zealand 2018)
3 Other Costs
Other costs include sales and marketing, passenger services and maintenance. Amajor cost factor
that has not been included in this analysis aare the gains and losses are accrued due to foreign
exchange. Gains in foreugn exchange are seen as earning while losses are seen as costs. As the
airline operates worldwide, significaant amount of foreign exchange must be managed. Air New
Zealand has introduced American Depository Receipts which would allow it's capital gains to be
realized in US Dollars, one of the most commonly used currencies world wide. (Air New Zealand
2018)
Air New Zealand is building its capacity by increasing its fleet of air craft. The increased capacity is
expected to drive the fixed as well as the variable costs. Aircraft Maintenance is especially expected
to maintain costs.
4 Conclusion
Full service carriers , in general, tend to be less financially efficient that low cost carriers. (Barbot,
Costa and Sochirca September 2008) Yet, Air New Zealand has shown exceptional growth and
profitability for airline industry. Economies of scale is crucial for large full service carrier to thrive.
(Barbot, Costa and Sochirca September 2008)The absence of any other significant domestic full
service carrier in New Zealand and having regional subsidiariesallows domestic market of New
Zealand. (Air New Zealand 2018) This may be one of the reasons of profitability
Bibliography
AIR NEW ZEALAND (2008). 2006/07 Financial review of Air New Zealand Limited. [online]. HYPERLINK
"https://www.parliament.nz/resource/mi-NZ/48DBSCH_SCR4042_1/90b685df5d43cceb012b888ca26dadfd
d1ed0429"
https://www.parliament.nz/resource/mi-NZ/48DBSCH_SCR4042_1/90b685df5d43cceb012b888ca26dadfdd
1ed0429
Paraphrase This Document
Need a fresh take? Get an instant paraphrase of this document with our AI Paraphraser
AIR NEW ZEALAND (2018). About Air New Zealand. [online]. HYPERLINK
"https://www.airnewzealand.co.nz/about-air-new-zealand" https://www.airnewzealand.co.nz/about-air-
new-zealand
AIR NEW ZEALAND (2018). American Depositary Receipt (ADR) information. [online]. HYPERLINK
"https://www.airnewzealand.com/adr-information" https://www.airnewzealand.com/adr-information
AIR NEW ZEALAND (2018). Fuel Hedging. [online]. HYPERLINK "https://www.airnewzealand.com/fuel-
hedging-announcements" https://www.airnewzealand.com/fuel-hedging-announcements
AIR NEW ZEALAND (2018). Investor Centre. [online]. HYPERLINK
"https://www.airnewzealand.com/investor-centre" https://www.airnewzealand.com/investor-centre
AIR NEW ZEALAND (2017). Operating fleet. [online]. Last updated 31 December. HYPERLINK
"https://www.airnewzealand.co.nz/fleet" https://www.airnewzealand.co.nz/fleet
AUSTRALIANAVIATION.COM.AU (2018). AIR NEW ZEALAND FLAGS NEW WIDEBODY ORDER IN 2019.
[online]. Last updated 14 June. HYPERLINK "http://australianaviation.com.au/2018/06/air-new-zealand-
flags-new-widebody-order-in-2019/" http://australianaviation.com.au/2018/06/air-new-zealand-flags-
new-widebody-order-in-2019/
BARBOT, Cristina, COSTA, Alvaro and SOCHIRCA, Elena (September 2008). Airlines performance in the new
market context: A comparative productivity and efficiency analysis. Journal of Air Transport Management,
14 (5), 270-274.
CPA AUSTRALIA (2017). Financial Accounting and Reporting Study Guide (Seventh Edition). [online].
HYPERLINK "https://www.cpaaustralia.com.au/~/media/corporate/allfiles/document/cpaprogram/
foundation-exams/farr-study-guide-seventh-edition.pdf?la=en"
https://www.cpaaustralia.com.au/~/media/corporate/allfiles/document/cpaprogram/foundation-exams/
farr-study-guide-seventh-edition.pdf?la=en
EVERIPEDIA INTERNATIONAL (2018). List of airlines in New Zealand. [online]. HYPERLINK "veripedia
International" veripedia International
1 out of 8
Related Documents


Your All-in-One AI-Powered Toolkit for Academic Success.
+13062052269
info@desklib.com
Available 24*7 on WhatsApp / Email
![[object Object]](/_next/static/media/star-bottom.7253800d.svg)
Unlock your academic potential
Copyright © 2020–2026 A2Z Services. All Rights Reserved. Developed and managed by ZUCOL.