Data Analysis Report: Air Quality and Sustainable Development - LB5235
VerifiedAdded on 2022/08/20
|9
|1984
|14
Report
AI Summary
This data analysis report examines air quality using a dataset from the UCI Machine Learning Repository, focusing on hourly gas concentrations, temperature, and humidity in an Italian city. The study employs statistical methods, including descriptive statistics and multivariate linear regression, to identify factors influencing air temperature. The analysis reveals significant relationships between temperature and concentrations of gases like carbon monoxide, hydrocarbons (benzene), and other pollutants. The regression model indicates that CO and hydrocarbon gases contribute significantly to temperature variations. The report concludes by emphasizing the importance of minimizing emissions for sustainable development and suggests further research into other environmental attributes like water and soil. The limitations include the small sample size and missing data, which may not fully represent overall air quality, but it provides insights into the environmental and economic implications of air quality in a specific urban setting.
Running head: DATA ANALYSIS REPORT
DATA ANALYSIS REPORT
Name of the Student
Name of the University
Author Note
DATA ANALYSIS REPORT
Name of the Student
Name of the University
Author Note
Paraphrase This Document
Need a fresh take? Get an instant paraphrase of this document with our AI Paraphraser
1DATA ANALYSIS REPORT
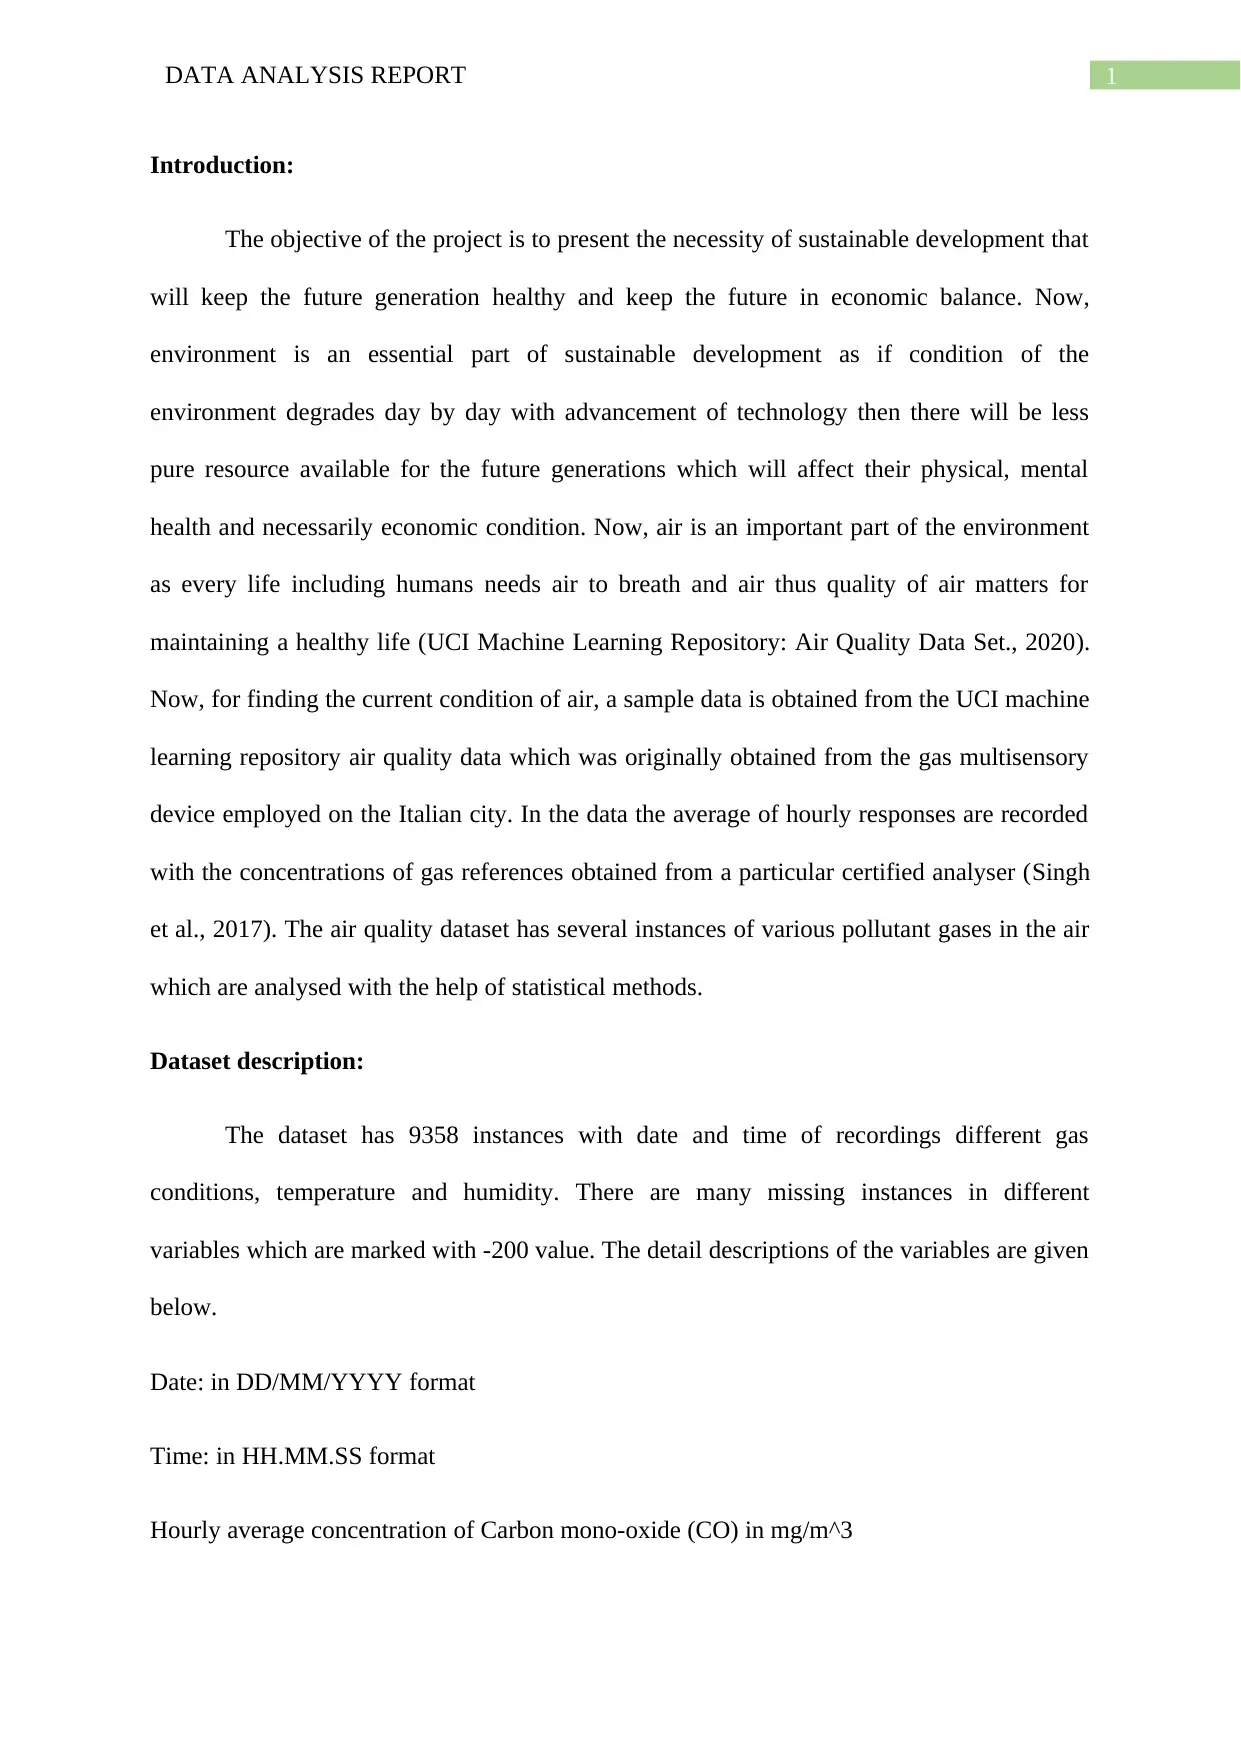
Introduction:
The objective of the project is to present the necessity of sustainable development that
will keep the future generation healthy and keep the future in economic balance. Now,
environment is an essential part of sustainable development as if condition of the
environment degrades day by day with advancement of technology then there will be less
pure resource available for the future generations which will affect their physical, mental
health and necessarily economic condition. Now, air is an important part of the environment
as every life including humans needs air to breath and air thus quality of air matters for
maintaining a healthy life (UCI Machine Learning Repository: Air Quality Data Set., 2020).
Now, for finding the current condition of air, a sample data is obtained from the UCI machine
learning repository air quality data which was originally obtained from the gas multisensory
device employed on the Italian city. In the data the average of hourly responses are recorded
with the concentrations of gas references obtained from a particular certified analyser (Singh
et al., 2017). The air quality dataset has several instances of various pollutant gases in the air
which are analysed with the help of statistical methods.
Dataset description:
The dataset has 9358 instances with date and time of recordings different gas
conditions, temperature and humidity. There are many missing instances in different
variables which are marked with -200 value. The detail descriptions of the variables are given
below.
Date: in DD/MM/YYYY format
Time: in HH.MM.SS format
Hourly average concentration of Carbon mono-oxide (CO) in mg/m^3
2DATA ANALYSIS REPORT
PT08.S1: tin oxide concentration with nominally targeted CO
NMHC(GT): Non Metanic HydroCarbons concentration in μg/m^3 by the reference analyser
C6H6(GT): Average Benzene concentration in microg/m^3 by the reference analyser
PT08.S2(NMHC): Titania average concentration with nominally targeted NMHC.
NOx(GT): NOx concentration in ppb with reference analyser
PT08.S3(NOx): Tungsten oxide average sensor response nominally NOx targeted
NO2(GT): averaged N O2 concentration in microg/m^3 as measured by reference analyser
PT08.S4(NO2): Tungsten oxide average sensor response nominally N O2 targeted
PT08.S5(O3): Indium oxide hourly averaged sensor response nominally targeted by O3
T: Temperature in degree C
RH: percentage relative humidity
AH: Absolute humidity (no unit)
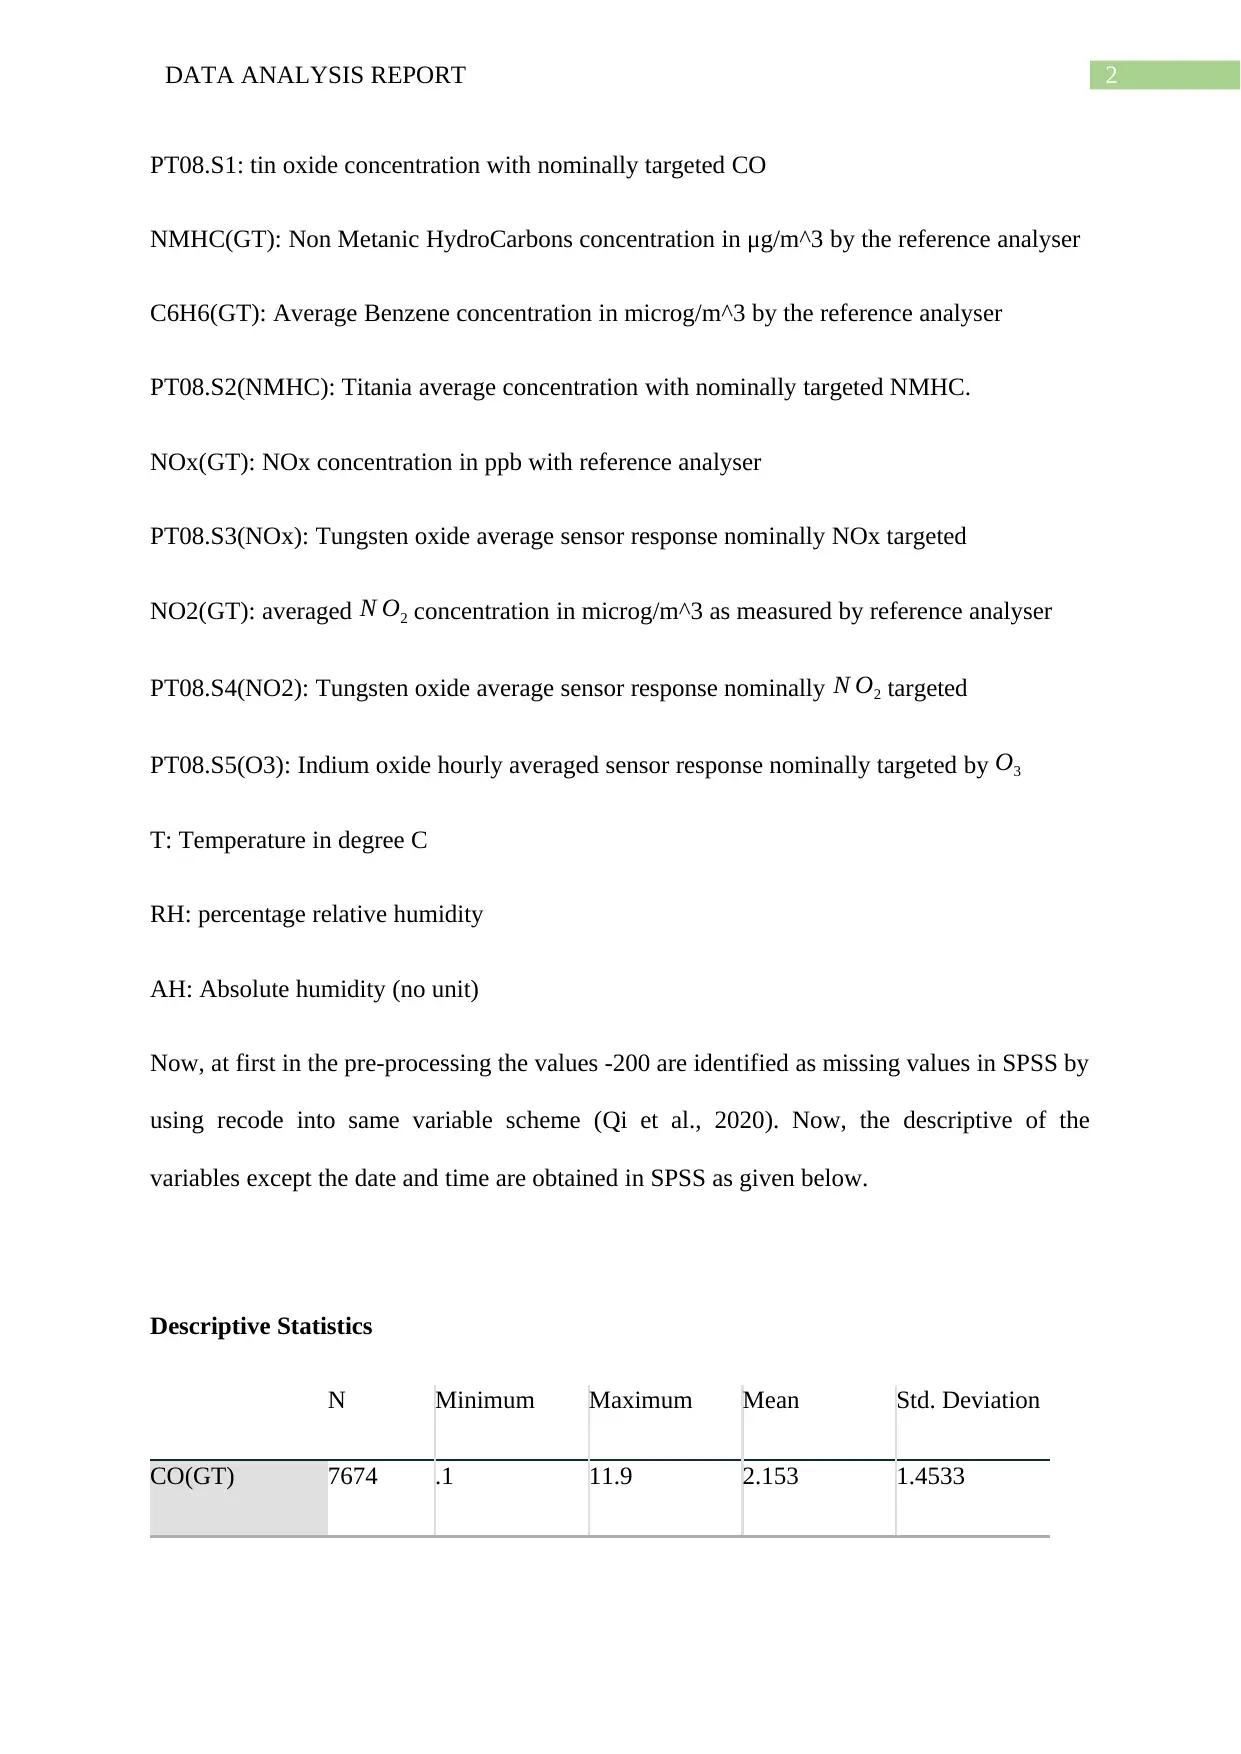
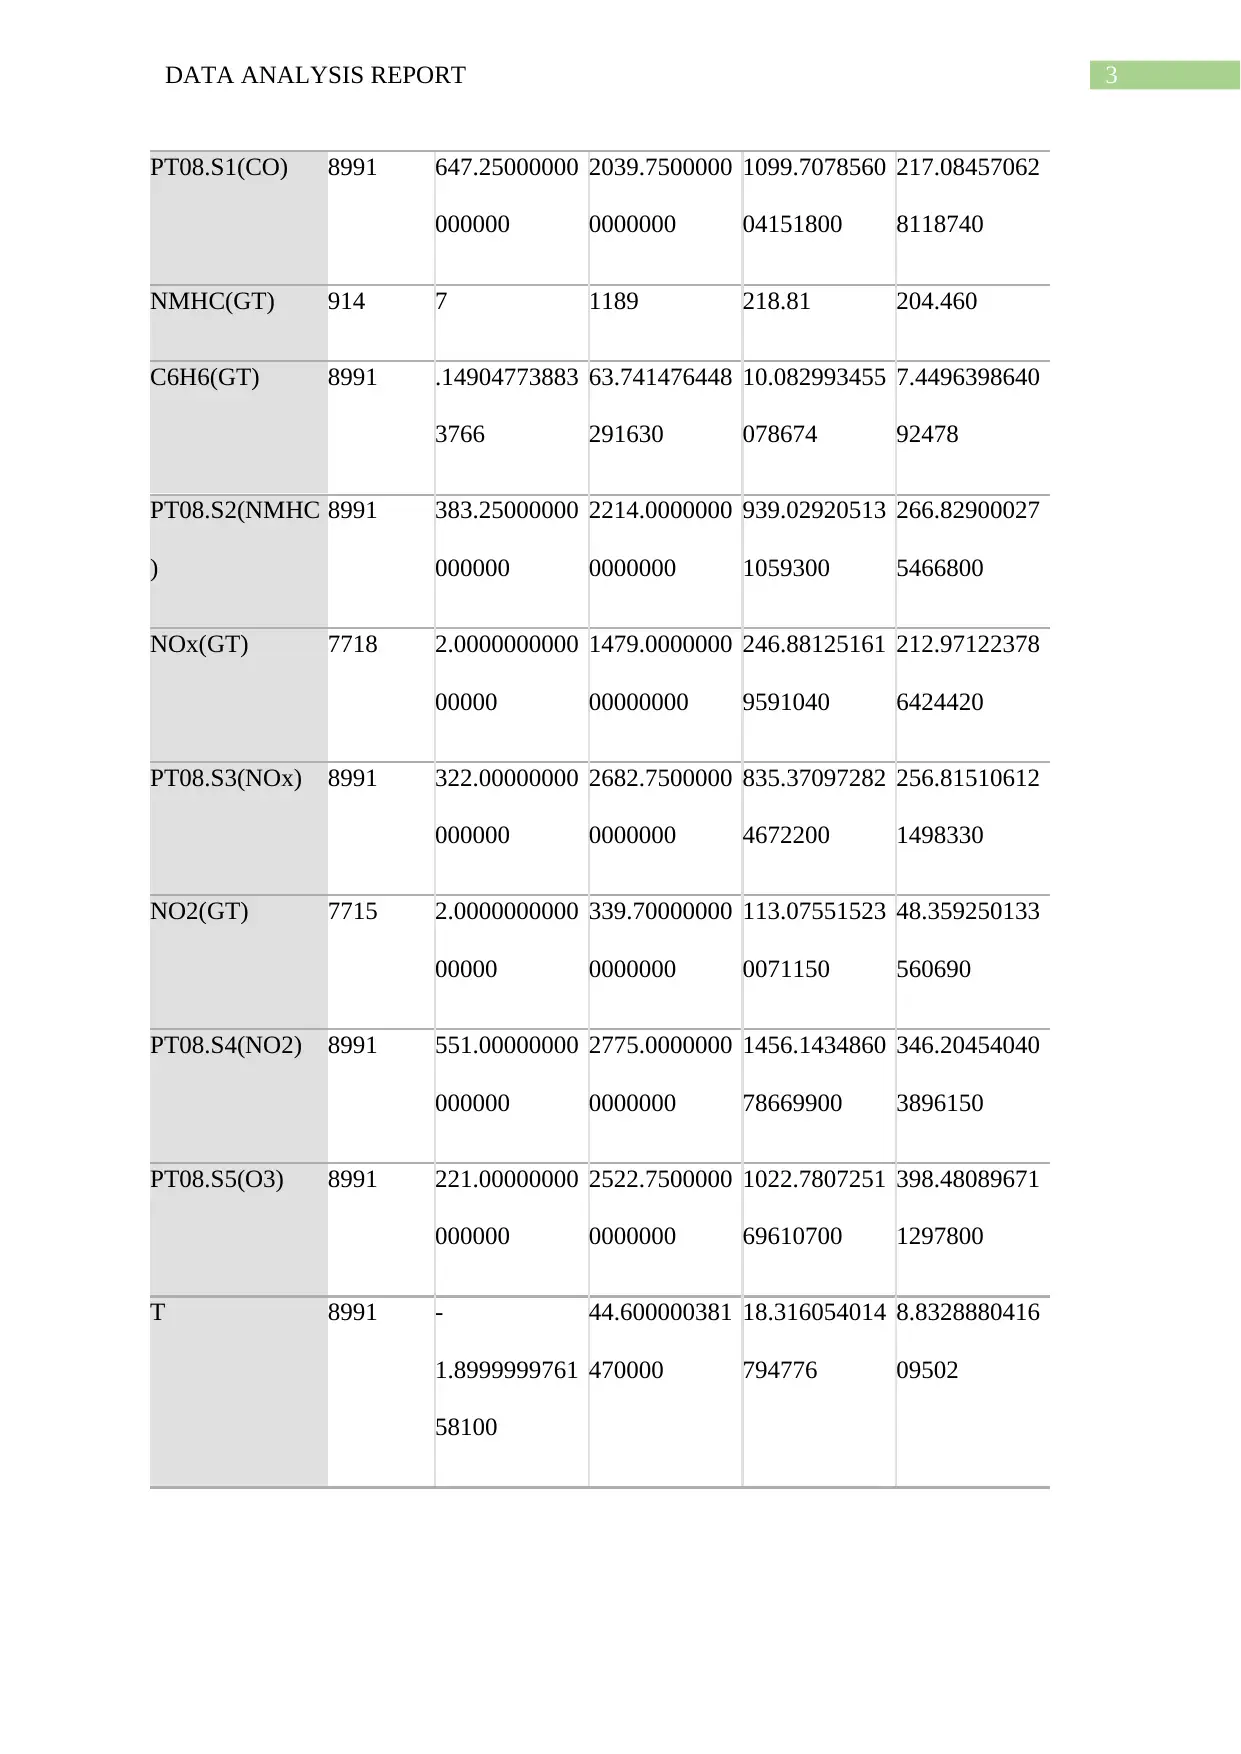
Now, at first in the pre-processing the values -200 are identified as missing values in SPSS by
using recode into same variable scheme (Qi et al., 2020). Now, the descriptive of the
variables except the date and time are obtained in SPSS as given below.
Descriptive Statistics
N Minimum Maximum Mean Std. Deviation
CO(GT) 7674 .1 11.9 2.153 1.4533
PT08.S1: tin oxide concentration with nominally targeted CO
NMHC(GT): Non Metanic HydroCarbons concentration in μg/m^3 by the reference analyser
C6H6(GT): Average Benzene concentration in microg/m^3 by the reference analyser
PT08.S2(NMHC): Titania average concentration with nominally targeted NMHC.
NOx(GT): NOx concentration in ppb with reference analyser
PT08.S3(NOx): Tungsten oxide average sensor response nominally NOx targeted
NO2(GT): averaged N O2 concentration in microg/m^3 as measured by reference analyser
PT08.S4(NO2): Tungsten oxide average sensor response nominally N O2 targeted
PT08.S5(O3): Indium oxide hourly averaged sensor response nominally targeted by O3
T: Temperature in degree C
RH: percentage relative humidity
AH: Absolute humidity (no unit)
Now, at first in the pre-processing the values -200 are identified as missing values in SPSS by
using recode into same variable scheme (Qi et al., 2020). Now, the descriptive of the
variables except the date and time are obtained in SPSS as given below.
Descriptive Statistics
N Minimum Maximum Mean Std. Deviation
CO(GT) 7674 .1 11.9 2.153 1.4533
⊘ This is a preview!⊘
Do you want full access?
Subscribe today to unlock all pages.
Trusted by 1+ million students worldwide
3DATA ANALYSIS REPORT
PT08.S1(CO) 8991 647.25000000
000000
2039.7500000
0000000
1099.7078560
04151800
217.08457062
8118740
NMHC(GT) 914 7 1189 218.81 204.460
C6H6(GT) 8991 .14904773883
3766
63.741476448
291630
10.082993455
078674
7.4496398640
92478
PT08.S2(NMHC
)
8991 383.25000000
000000
2214.0000000
0000000
939.02920513
1059300
266.82900027
5466800
NOx(GT) 7718 2.0000000000
00000
1479.0000000
00000000
246.88125161
9591040
212.97122378
6424420
PT08.S3(NOx) 8991 322.00000000
000000
2682.7500000
0000000
835.37097282
4672200
256.81510612
1498330
NO2(GT) 7715 2.0000000000
00000
339.70000000
0000000
113.07551523
0071150
48.359250133
560690
PT08.S4(NO2) 8991 551.00000000
000000
2775.0000000
0000000
1456.1434860
78669900
346.20454040
3896150
PT08.S5(O3) 8991 221.00000000
000000
2522.7500000
0000000
1022.7807251
69610700
398.48089671
1297800
T 8991 -
1.8999999761
58100
44.600000381
470000
18.316054014
794776
8.8328880416
09502
Paraphrase This Document
Need a fresh take? Get an instant paraphrase of this document with our AI Paraphraser
4DATA ANALYSIS REPORT
RH 8991 9.1750001907
349
88.725000381
4700
49.232360145
050585
17.316389329
042956
AH 8991 .18467902099
9170
2.2310357155
83186
1.0255302148
06683
.40381294342
8098
Valid N
(listwise)
827
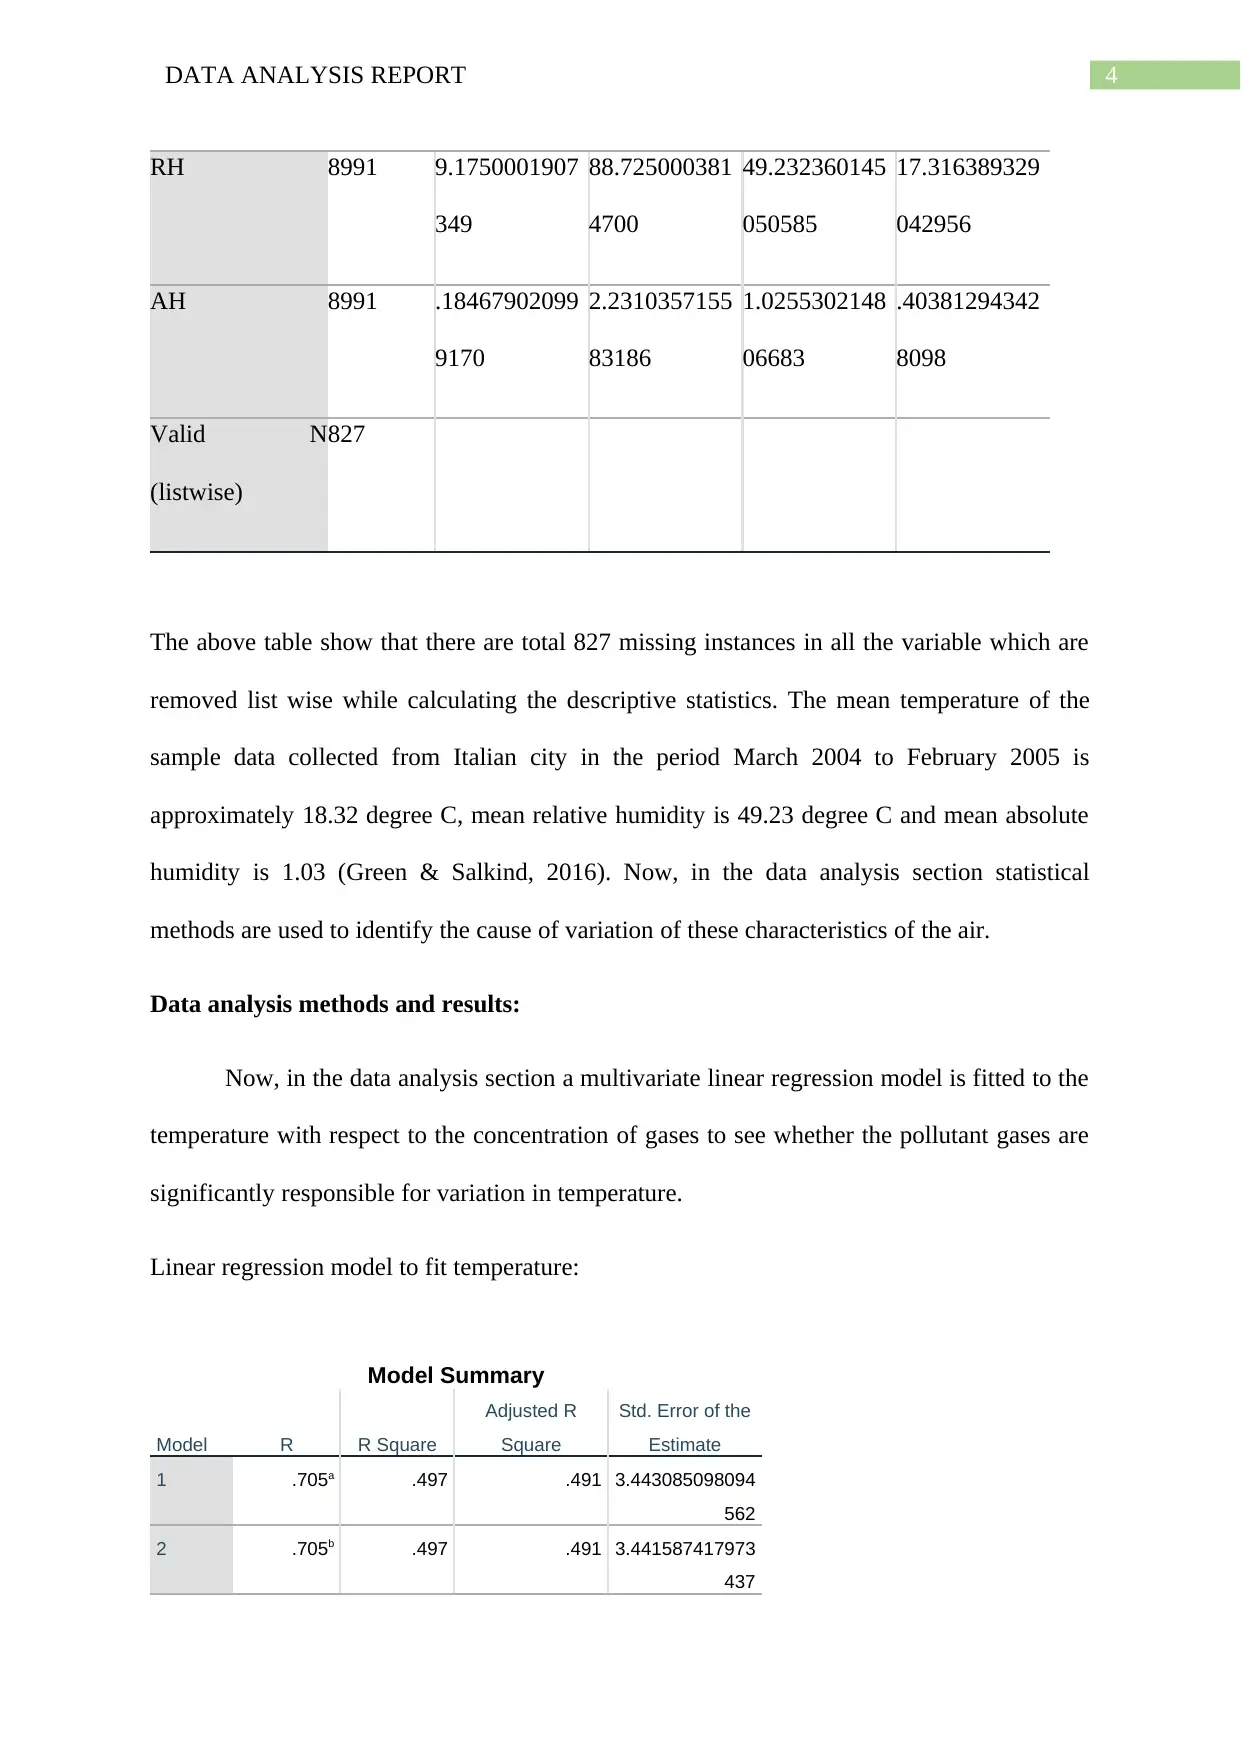
The above table show that there are total 827 missing instances in all the variable which are
removed list wise while calculating the descriptive statistics. The mean temperature of the
sample data collected from Italian city in the period March 2004 to February 2005 is
approximately 18.32 degree C, mean relative humidity is 49.23 degree C and mean absolute
humidity is 1.03 (Green & Salkind, 2016). Now, in the data analysis section statistical
methods are used to identify the cause of variation of these characteristics of the air.
Data analysis methods and results:
Now, in the data analysis section a multivariate linear regression model is fitted to the
temperature with respect to the concentration of gases to see whether the pollutant gases are
significantly responsible for variation in temperature.
Linear regression model to fit temperature:
Model Summary
Model R R Square
Adjusted R
Square
Std. Error of the
Estimate
1 .705a .497 .491 3.443085098094
562
2 .705b .497 .491 3.441587417973
437
RH 8991 9.1750001907
349
88.725000381
4700
49.232360145
050585
17.316389329
042956
AH 8991 .18467902099
9170
2.2310357155
83186
1.0255302148
06683
.40381294342
8098
Valid N
(listwise)
827
The above table show that there are total 827 missing instances in all the variable which are
removed list wise while calculating the descriptive statistics. The mean temperature of the
sample data collected from Italian city in the period March 2004 to February 2005 is
approximately 18.32 degree C, mean relative humidity is 49.23 degree C and mean absolute
humidity is 1.03 (Green & Salkind, 2016). Now, in the data analysis section statistical
methods are used to identify the cause of variation of these characteristics of the air.
Data analysis methods and results:
Now, in the data analysis section a multivariate linear regression model is fitted to the
temperature with respect to the concentration of gases to see whether the pollutant gases are
significantly responsible for variation in temperature.
Linear regression model to fit temperature:
Model Summary
Model R R Square
Adjusted R
Square
Std. Error of the
Estimate
1 .705a .497 .491 3.443085098094
562
2 .705b .497 .491 3.441587417973
437
5DATA ANALYSIS REPORT
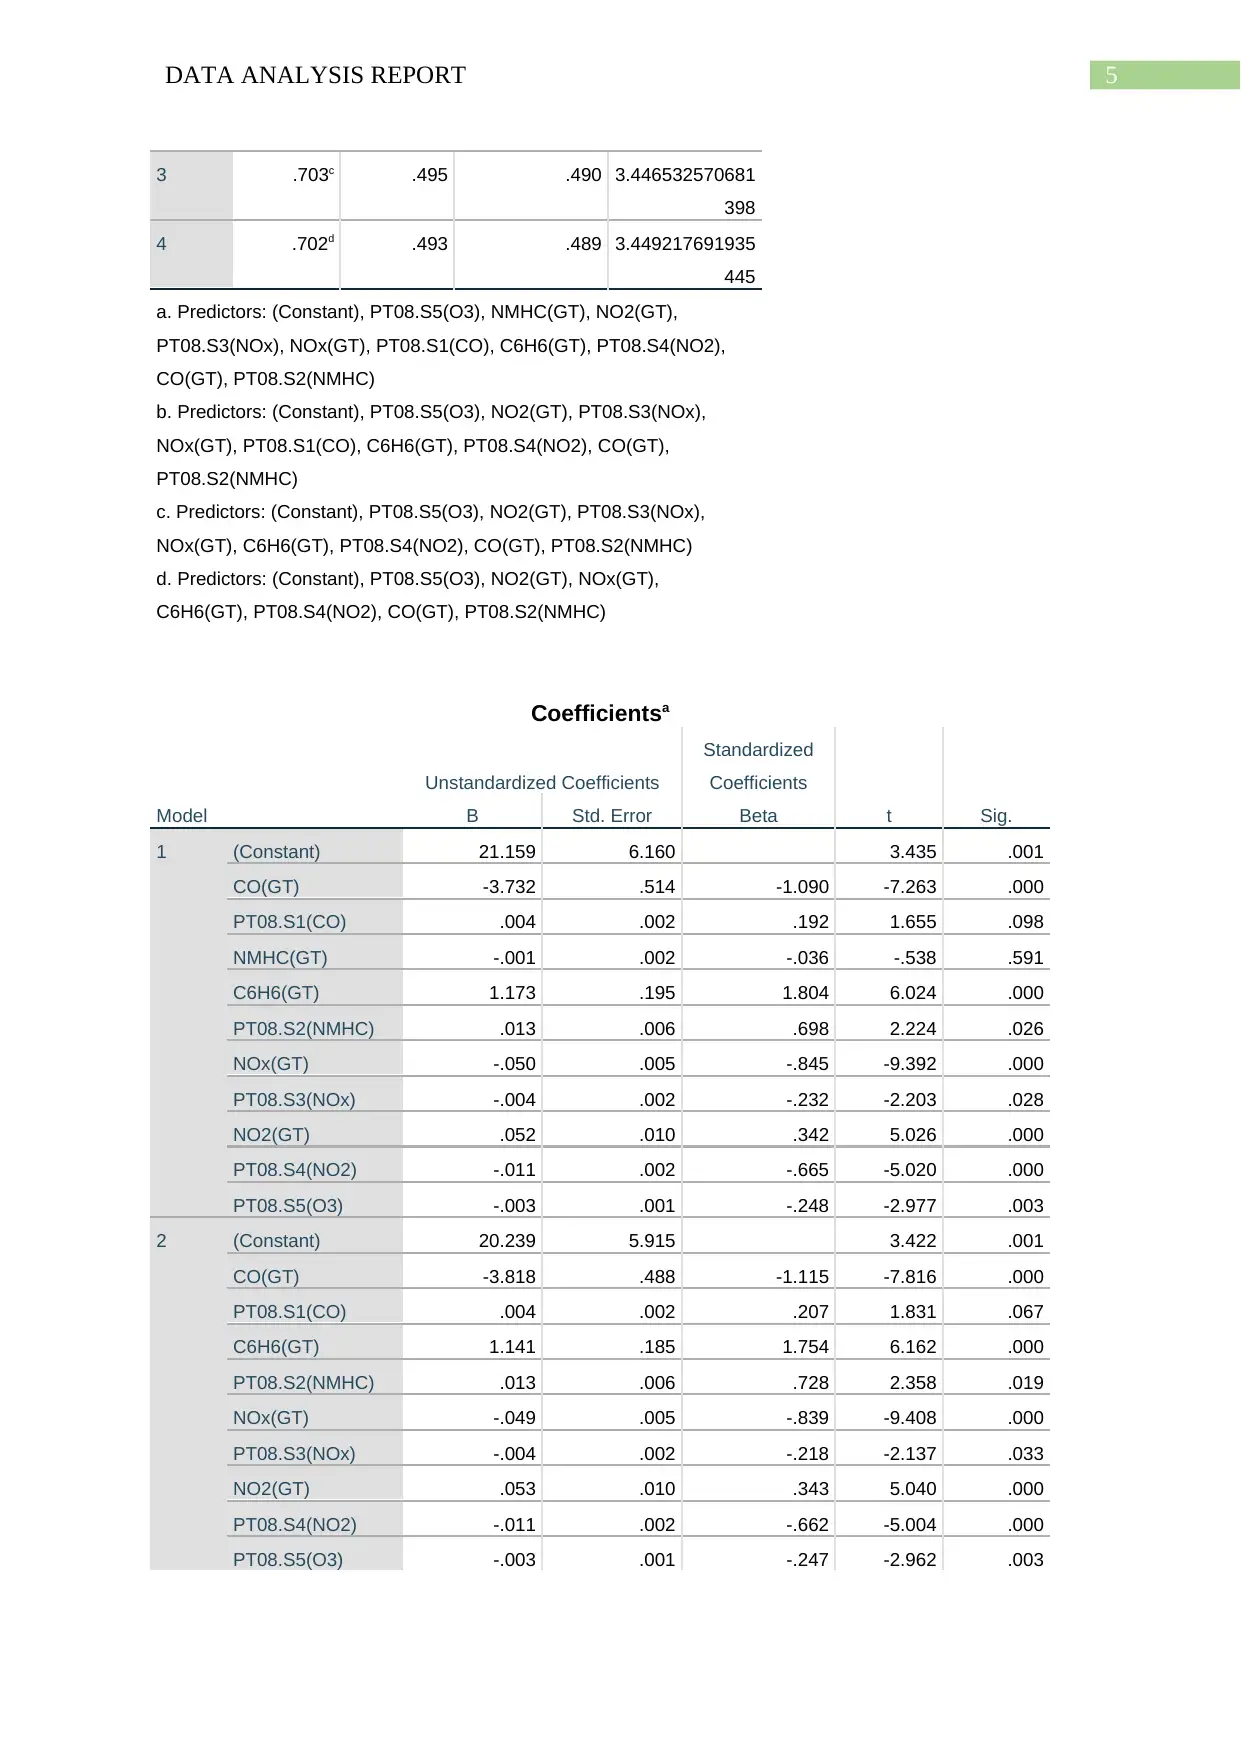
3 .703c .495 .490 3.446532570681
398
4 .702d .493 .489 3.449217691935
445
a. Predictors: (Constant), PT08.S5(O3), NMHC(GT), NO2(GT),
PT08.S3(NOx), NOx(GT), PT08.S1(CO), C6H6(GT), PT08.S4(NO2),
CO(GT), PT08.S2(NMHC)
b. Predictors: (Constant), PT08.S5(O3), NO2(GT), PT08.S3(NOx),
NOx(GT), PT08.S1(CO), C6H6(GT), PT08.S4(NO2), CO(GT),
PT08.S2(NMHC)
c. Predictors: (Constant), PT08.S5(O3), NO2(GT), PT08.S3(NOx),
NOx(GT), C6H6(GT), PT08.S4(NO2), CO(GT), PT08.S2(NMHC)
d. Predictors: (Constant), PT08.S5(O3), NO2(GT), NOx(GT),
C6H6(GT), PT08.S4(NO2), CO(GT), PT08.S2(NMHC)
Coefficientsa
Model
Unstandardized Coefficients
Standardized
Coefficients
t Sig.B Std. Error Beta
1 (Constant) 21.159 6.160 3.435 .001
CO(GT) -3.732 .514 -1.090 -7.263 .000
PT08.S1(CO) .004 .002 .192 1.655 .098
NMHC(GT) -.001 .002 -.036 -.538 .591
C6H6(GT) 1.173 .195 1.804 6.024 .000
PT08.S2(NMHC) .013 .006 .698 2.224 .026
NOx(GT) -.050 .005 -.845 -9.392 .000
PT08.S3(NOx) -.004 .002 -.232 -2.203 .028
NO2(GT) .052 .010 .342 5.026 .000
PT08.S4(NO2) -.011 .002 -.665 -5.020 .000
PT08.S5(O3) -.003 .001 -.248 -2.977 .003
2 (Constant) 20.239 5.915 3.422 .001
CO(GT) -3.818 .488 -1.115 -7.816 .000
PT08.S1(CO) .004 .002 .207 1.831 .067
C6H6(GT) 1.141 .185 1.754 6.162 .000
PT08.S2(NMHC) .013 .006 .728 2.358 .019
NOx(GT) -.049 .005 -.839 -9.408 .000
PT08.S3(NOx) -.004 .002 -.218 -2.137 .033
NO2(GT) .053 .010 .343 5.040 .000
PT08.S4(NO2) -.011 .002 -.662 -5.004 .000
PT08.S5(O3) -.003 .001 -.247 -2.962 .003
⊘ This is a preview!⊘
Do you want full access?
Subscribe today to unlock all pages.
Trusted by 1+ million students worldwide
6DATA ANALYSIS REPORT
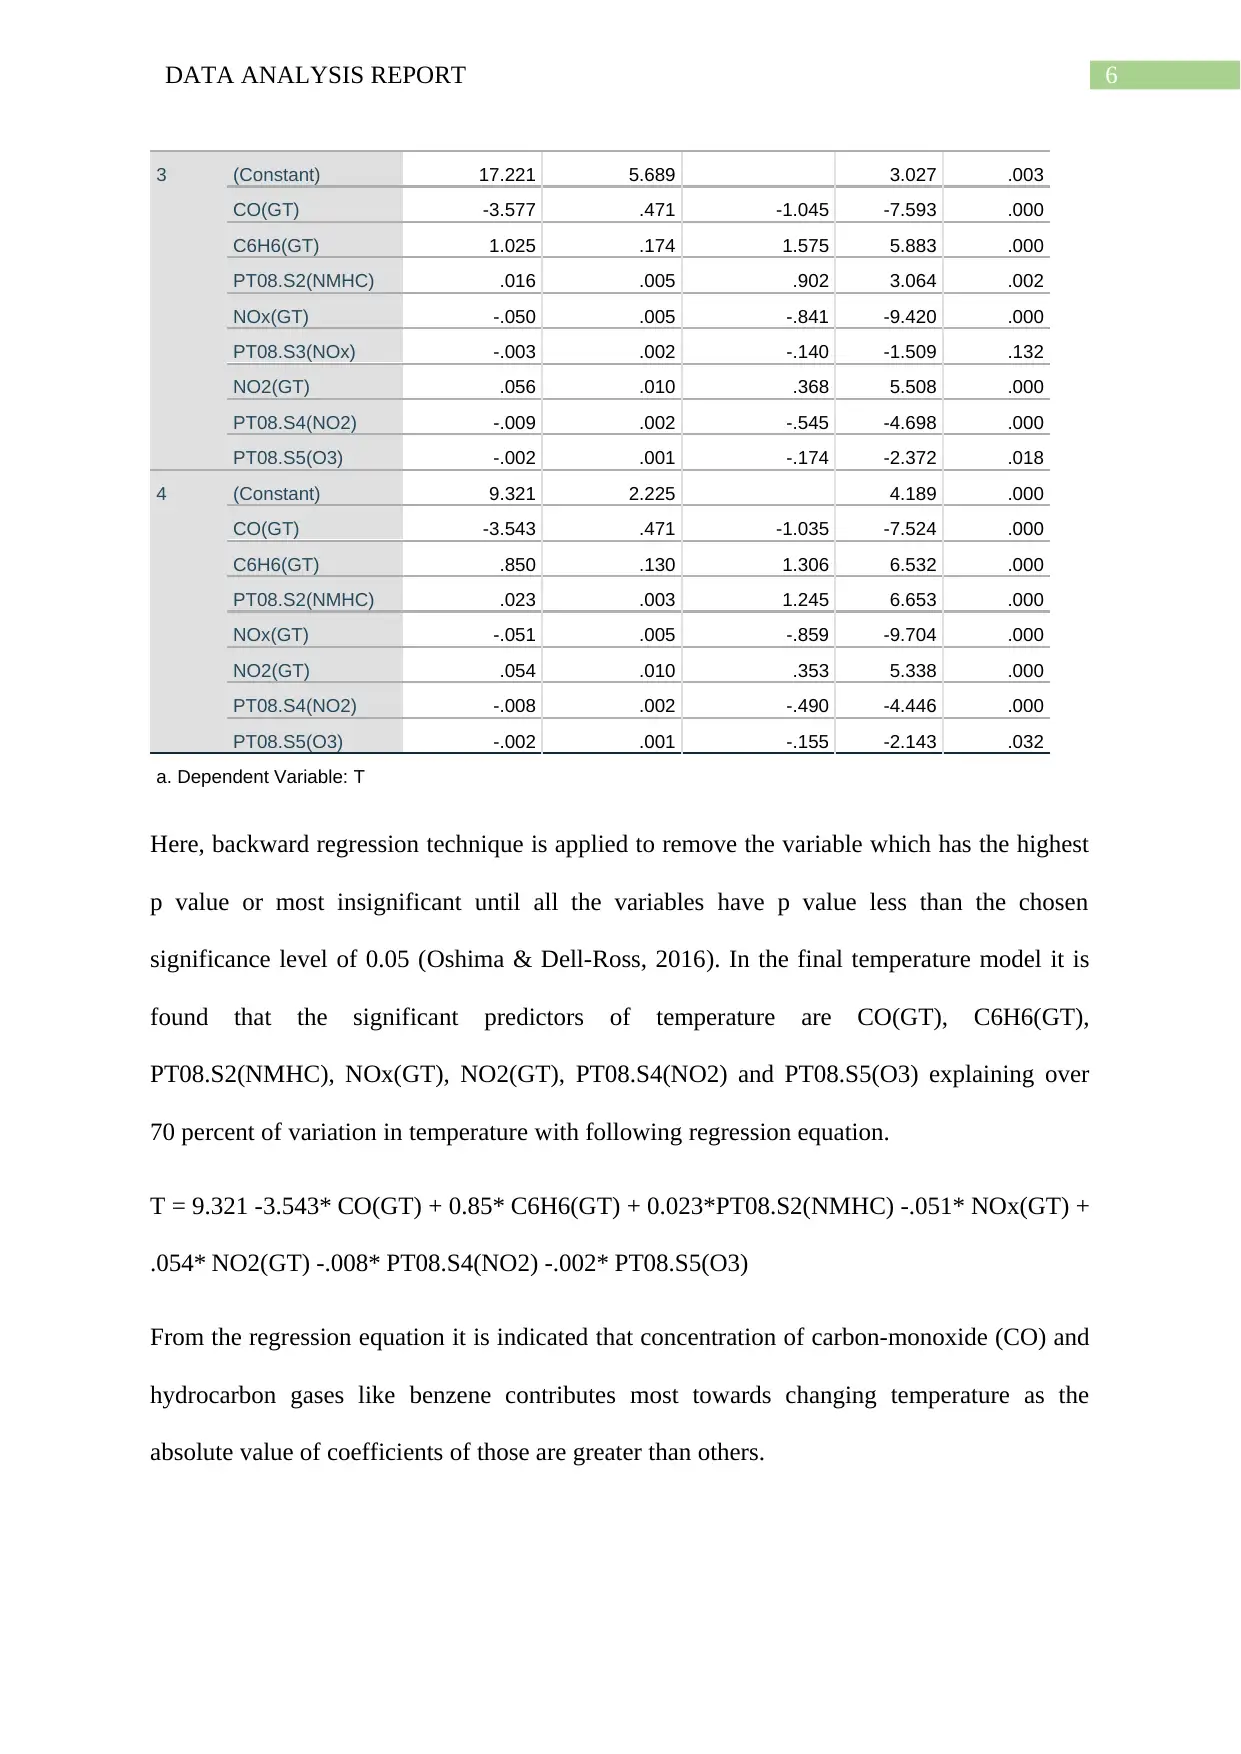
3 (Constant) 17.221 5.689 3.027 .003
CO(GT) -3.577 .471 -1.045 -7.593 .000
C6H6(GT) 1.025 .174 1.575 5.883 .000
PT08.S2(NMHC) .016 .005 .902 3.064 .002
NOx(GT) -.050 .005 -.841 -9.420 .000
PT08.S3(NOx) -.003 .002 -.140 -1.509 .132
NO2(GT) .056 .010 .368 5.508 .000
PT08.S4(NO2) -.009 .002 -.545 -4.698 .000
PT08.S5(O3) -.002 .001 -.174 -2.372 .018
4 (Constant) 9.321 2.225 4.189 .000
CO(GT) -3.543 .471 -1.035 -7.524 .000
C6H6(GT) .850 .130 1.306 6.532 .000
PT08.S2(NMHC) .023 .003 1.245 6.653 .000
NOx(GT) -.051 .005 -.859 -9.704 .000
NO2(GT) .054 .010 .353 5.338 .000
PT08.S4(NO2) -.008 .002 -.490 -4.446 .000
PT08.S5(O3) -.002 .001 -.155 -2.143 .032
a. Dependent Variable: T
Here, backward regression technique is applied to remove the variable which has the highest
p value or most insignificant until all the variables have p value less than the chosen
significance level of 0.05 (Oshima & Dell-Ross, 2016). In the final temperature model it is
found that the significant predictors of temperature are CO(GT), C6H6(GT),
PT08.S2(NMHC), NOx(GT), NO2(GT), PT08.S4(NO2) and PT08.S5(O3) explaining over
70 percent of variation in temperature with following regression equation.
T = 9.321 -3.543* CO(GT) + 0.85* C6H6(GT) + 0.023*PT08.S2(NMHC) -.051* NOx(GT) +
.054* NO2(GT) -.008* PT08.S4(NO2) -.002* PT08.S5(O3)
From the regression equation it is indicated that concentration of carbon-monoxide (CO) and
hydrocarbon gases like benzene contributes most towards changing temperature as the
absolute value of coefficients of those are greater than others.
Paraphrase This Document
Need a fresh take? Get an instant paraphrase of this document with our AI Paraphraser
7DATA ANALYSIS REPORT
Conclusion:
In conclusion it can be stated that through data analysis an overview of the current
environmental condition (specifically the quality of air) has been obtained by using a
comparative small concentrated sample of air in Italian city. Furthermore through statistical
methods it is found that gases like CO, hydrocarbons and other significant gases as specified
in the model contributes towards change of air temperature in a greater way. Thus for
sustainable development it is recommended to use technology which emits these gases in the
atmosphere at minimal amount to keep the air clean for the future generations. Now, there are
other attributes of the environment like water, relative humidity, soil which are left to
research as a future scope of the study. This should also kept in mind that the sample may not
be a good representation of the overall air quality of earth as the sample size is comparatively
small with a significant percentage of missing instances and concentrated in a city of Italy.
However, the research gives a hint of current environmental condition which is responsible
for economic condition as well of a randomly chosen city and gives an estimate of the factors
which are responsible for change in environmental condition especially the air.
8DATA ANALYSIS REPORT
References:
Green, S. B., & Salkind, N. J. (2016). Using SPSS for Windows and Macintosh, books a la
carte. Pearson.
Oshima, T. C., & Dell-Ross, T. (2016). All possible regressions using IBM SPSS: A
practitioner’s guide to automatic linear modeling.
Qi, P., Yan, C., Zang, C., Xu, J., Huang, X., Dai, X., ... & Zhao, T. (2020, January). Analysis
of Factors Influencing the Resistance of a Type of Air Filter Paper Based on SPSS. In IOP
Conference Series: Materials Science and Engineering (Vol. 711, No. 1, p. 012060). IOP
Publishing.
Singh, S., Jaishi, H. P., Tiwari, R. P., & Tiwari, R. C. (2017). Time series analysis of soil
radon data using multiple linear regression and artificial neural network in seismic precursory
studies. Pure and Applied Geophysics, 174(7), 2793-2802.
UCI Machine Learning Repository: Air Quality Data Set. (2020). Retrieved 28 January 2020,
from https://archive.ics.uci.edu/ml/datasets/Air+Quality#
⊘ This is a preview!⊘
Do you want full access?
Subscribe today to unlock all pages.
Trusted by 1+ million students worldwide
1 out of 9

Your All-in-One AI-Powered Toolkit for Academic Success.
+13062052269
info@desklib.com
Available 24*7 on WhatsApp / Email
![[object Object]](/_next/static/media/star-bottom.7253800d.svg)
Unlock your academic potential
Copyright © 2020–2026 A2Z Services. All Rights Reserved. Developed and managed by ZUCOL.