Analysis of Air Traffic, Passenger Movement Data Trends
VerifiedAdded on 2023/06/07
|47
|8690
|94
Report
AI Summary
This report provides a detailed analysis of air traffic and passenger movement data in Australia, spanning from 1985 to 2017, with a focus on identifying patterns, trends, and forecasting future developments. The study examines various data sources, including airport passenger and aircraft movement statistics, to provide a comprehensive overview of the Australian air transport industry. The analysis includes an examination of average annual growth in passenger movement, aircraft movement, and total passenger movement based on airport type. The report also delves into the performance of top Australian airports, such as Sydney, Melbourne, Brisbane, Perth, and others. International airline revenue passenger movements are also analyzed. A literature review provides context for the analysis, and the methodology outlines the data sources and techniques used. The report concludes with forecasting, limitations, and recommendations for stakeholders in the aviation industry. The project aims to aid stakeholders in making better informed decisions by assessing the current state and future trajectory of the air transport sector in both the short and long term.
ANALYSIS OF AIR TRAFFIC, PASSENGER MOVEMENT DATA TO DISCOVER TRENDS 1
ANALYSIS OF AIR TRAFFIC, PASSENGER MOVEMENT DATA TO DISCOVER
PATTERNS, TRENDS AND FORECASTING
Name of Student
Institution
ANALYSIS OF AIR TRAFFIC, PASSENGER MOVEMENT DATA TO DISCOVER
PATTERNS, TRENDS AND FORECASTING
Name of Student
Institution
Paraphrase This Document
Need a fresh take? Get an instant paraphrase of this document with our AI Paraphraser
ANALYSIS OF AIR TRAFFIC, PASSENGER MOVEMENT DATA TO DISCOVER TRENDS 2
TABLE OF ABBREVIATIONS
EEMD: Ensemble Empirical Mode Decomposition
EMD: Empirical Mode Decomposition
IMF: Intrinsic Mode Functions
SVM: Support Vector Machines
RPT: Revenue Passenger Movement.
TABLE OF ABBREVIATIONS
EEMD: Ensemble Empirical Mode Decomposition
EMD: Empirical Mode Decomposition
IMF: Intrinsic Mode Functions
SVM: Support Vector Machines
RPT: Revenue Passenger Movement.
ANALYSIS OF AIR TRAFFIC, PASSENGER MOVEMENT DATA TO DISCOVER TRENDS 3
Content
TABLE OF ABBREVIATIONS...............................................................................................................2
INTRODUCTION.....................................................................................................................................5
Problem Statement....................................................................................................................................6
Project Objectives......................................................................................................................................6
LITERATURE REVIEW.........................................................................................................................8
FRAMEWORKS...........................................................................................................................................12
METHODOLOGY..................................................................................................................................14
Data Sources........................................................................................................................................14
Gantt chart...........................................................................................................................................15
DISCUSSION OF ARTERFACT...........................................................................................................17
1985-2017 PASSENGER MOVEMENT............................................................................................17
Average Annual Growth of Passenger Movement............................................................................18
1985-2017 AIRCRAFT MOVEMENT...............................................................................................19
1985-2017 TOTAL AUSTRALIAN PASSENGER MOVEMENT BASED ON AIRPORT TYPE
...............................................................................................................................................................20
1985-2017 TOP TEN AIRPORTS IN AUSTRALIA.........................................................................20
SYDNEY..........................................................................................................................................20
MELBOURNE.................................................................................................................................21
BRISBANE.......................................................................................................................................22
PERTH.............................................................................................................................................23
ADELAIDE......................................................................................................................................24
GOLD COAST.................................................................................................................................25
CAIRNS............................................................................................................................................26
CANBERRA....................................................................................................................................27
DARWIN..........................................................................................................................................28
HOBART..........................................................................................................................................29
OTHERS..........................................................................................................................................30
INTERNATIONAL AIRLINE RPT REVENUE PASSENGER MOVEMENTS..........................31
1985-2012 PASSENGER MOVEMENT........................................................................................32
1985-2012 AIRCRAFT MOVEMENT...........................................................................................33
⊘ This is a preview!⊘
Do you want full access?
Subscribe today to unlock all pages.
Trusted by 1+ million students worldwide
ANALYSIS OF AIR TRAFFIC, PASSENGER MOVEMENT DATA TO DISCOVER TRENDS 4
1985-2012 TOTAL AUSTRALIAN PASSENGER MOVEMENT BASED ON AIRPORT TYPE
...............................................................................................................................................................35
1985-2012 TOP TEN AIRPORTS IN AUSTRALIA.........................................................................36
Summary of Cities...............................................................................................................................36
FORECASTING..................................................................................................................................40
CONCLUSION, LIMITATIONS AND RECOMMENDATIONS......................................................41
Conclusion............................................................................................................................................41
Limitations...........................................................................................................................................41
Recommendations................................................................................................................................41
REFERENCES........................................................................................................................................42
Paraphrase This Document
Need a fresh take? Get an instant paraphrase of this document with our AI Paraphraser
ANALYSIS OF AIR TRAFFIC, PASSENGER MOVEMENT DATA TO DISCOVER TRENDS 5
INTRODUCTION
Air transport makes a significant contribution to the economy of Australia since it’s a major
employment provider and provides market to local suppliers, besides the sector helps in the
transportation of both local and foreign passengers within and outside the country (Holland &
Cooksley, 2008).
Foreign tourists arriving by air in Australia spend their money in the country thus improving the
local economy, this in turn supports local jobs (Adler, Fu, Oum & Yu, 2014). In 2014 the air
transport supported $34.2 billion gross value added contribution to Australian GDP (Cheng,
2009).
There are various types of transport in Australia which are highly used and dependable and one
of them is air transport. There are at least 300 airports in Australia which have cemented
airstrips. In current years there have been much discussions over the capability of planned air
services to and from various regional communities in Australia (Sturman, Tyson & D’abreton,
2007). There have been issues over the past few years with strategy makers over sustainability
and accessibility of regional airports in Australia. There are various types of airports in Australia
namely, domestic regional and state airports (Australia, 2012).
The airports in the sector are categorized into three major sector, the international airports, the
regional airports and the domestic airports (Leigh, 2009). This project will analyze data obtained
from various sources which comprises airport passenger movement per month, airport aircraft
movement per month, airport aircraft movement for years and the airport passenger movement
for years this will help discover trends and patterns in the various airports in Australia with the
aim of helping various stakeholders in planning (Black, Black, 2009). There will be an analysis
ANALYSIS OF AIR TRAFFIC, PASSENGER MOVEMENT DATA TO DISCOVER TRENDS 6
on the climate data to discover the cause of the various trends (Brons, Pels, Nijkamp, Rietveld,
2012).
Problem Statement
Without air transport forecast many sectors are left in the dark on what to expect in the future on
the trends of aircrafts and passengers (De’Neufville, 2015). Civil aviation authorities, airlines,
organizations and individuals need air passenger traffic and aircraft forecast in carrying out their
plans. Revenue management in the airlines is enhanced by accurate forecasts. Airline’s risk is
significantly reduced by carrying out forecasts to determine demand in the air transport (Stohl,
Eckhardt, Forster, James & Spichtinger, 2012). Lack of accurate forecast on air transport will
make the civil authorities unable to efficiently plan decisions in air transport infrastructure. In
order to carry out these forecast consideration is put on the airport passenger movement per
month, airport aircraft movement per month, airport aircraft movement for years and the airport
passenger movement for years (Hocking & Haddon, 2011).
In the past years many academic researchers have made multiple contributions to air transport
forecasting in Australia but they have not done its comprehensively considering all aspects
including passenger movements, aircraft movements and the climatic conditions in the various
airports (Xia, Nitschke, Zhang, Shah, Crabb & Hansen, 2015).
Project Objectives
Analyze given data with the aim of finding the patterns, trends to help in forecasting the
number of passengers the airport may expect in the future to help different stakeholders
in decision making.
⊘ This is a preview!⊘
Do you want full access?
Subscribe today to unlock all pages.
Trusted by 1+ million students worldwide

ANALYSIS OF AIR TRAFFIC, PASSENGER MOVEMENT DATA TO DISCOVER TRENDS 7
Analyze climate data to find out the reasons for the trends in various airlines.
To help stakeholders to make better informed decisions by assessing where the air
transport industry is headed in both the long term and short term period.
Analyses Undertaken Using the Available Datasets include:
Analyze climate data to find out the reasons for the trends in various airlines.
To help stakeholders to make better informed decisions by assessing where the air
transport industry is headed in both the long term and short term period.
Analyses Undertaken Using the Available Datasets include:
Paraphrase This Document
Need a fresh take? Get an instant paraphrase of this document with our AI Paraphraser
ANALYSIS OF AIR TRAFFIC, PASSENGER MOVEMENT DATA TO DISCOVER TRENDS 8
LITERATURE REVIEW
According to Cheng (2009) in 2014 the Australian air transport employed more than 170,000
people. The passengers in the airports bought services and goods in the year leading to the
supporting of a further 100,000 jobs. By paying salary to its employees the sector supported a
further 60,000 jobs almost all being spent on consumer services and goods. Foreigners using the
Australian airports in the year are estimated to have supported a further 290,000 jobs (Cheng,
2009). Both the air transport industry and foreign tourists contributed an estimate of $64.3 billion
to the gross value added contribution to the Australian GDP this amounts to 4.5% of the
economy. Air transport in Australia facilitates tourism, exports, and foreign direct investment. In
2014 Australia exported US $300 billion worth of services and goods which were facilitated by
air transport (Cheng, 2009).
The air transport sector connects Australia to other countries both developed and undeveloped
this helps drive economic growth. According to available statistics there are sixteen direct flights
terminuses amongst the twenty fastest developing countries in the world (Bryce, 2013). There
are also twenty direct flight destinations to the twenty fastest growing cities in the world as
measured using GDP. North America and Europe are the biggest sources of inbound passengers
to Australia (Hooper, 2008).
ANALYSIS OF AIR TRAFFIC, PASSENGER MOVEMENT DATA TO DISCOVER TRENDS 9
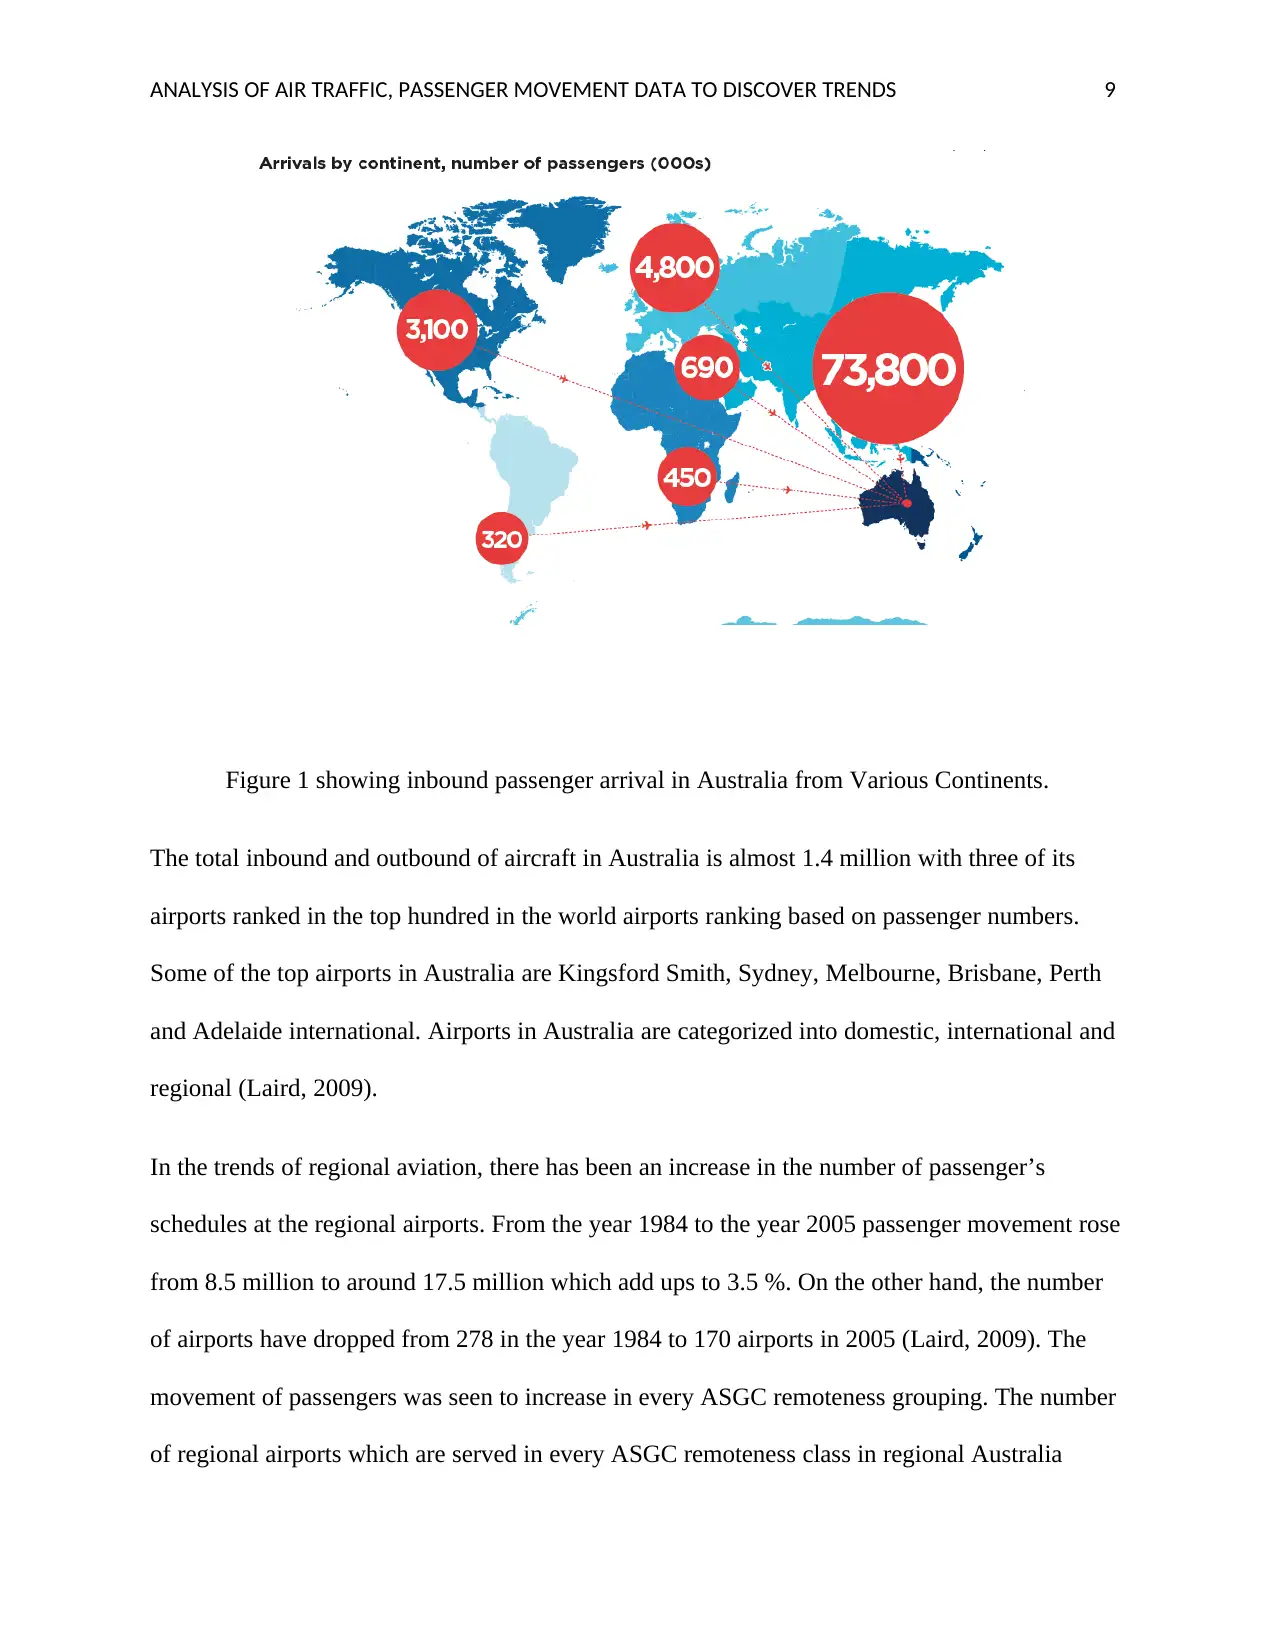
Figure 1 showing inbound passenger arrival in Australia from Various Continents.
The total inbound and outbound of aircraft in Australia is almost 1.4 million with three of its
airports ranked in the top hundred in the world airports ranking based on passenger numbers.
Some of the top airports in Australia are Kingsford Smith, Sydney, Melbourne, Brisbane, Perth
and Adelaide international. Airports in Australia are categorized into domestic, international and
regional (Laird, 2009).
In the trends of regional aviation, there has been an increase in the number of passenger’s
schedules at the regional airports. From the year 1984 to the year 2005 passenger movement rose
from 8.5 million to around 17.5 million which add ups to 3.5 %. On the other hand, the number
of airports have dropped from 278 in the year 1984 to 170 airports in 2005 (Laird, 2009). The
movement of passengers was seen to increase in every ASGC remoteness grouping. The number
of regional airports which are served in every ASGC remoteness class in regional Australia
⊘ This is a preview!⊘
Do you want full access?
Subscribe today to unlock all pages.
Trusted by 1+ million students worldwide
ANALYSIS OF AIR TRAFFIC, PASSENGER MOVEMENT DATA TO DISCOVER TRENDS
10
dropped. In the past years, Australia have experienced decline in the amount of regional airports
attended by airlines, followed by secluded Australia external regional Australia and inner
regional Australia (Forsyth, 2008, 2009, 2017). Nevertheless, in spite of the substantial drop
down over time, the amount of airports in very distant Australia remained high compared to
those in other AGSC remoteness classes are district areas.
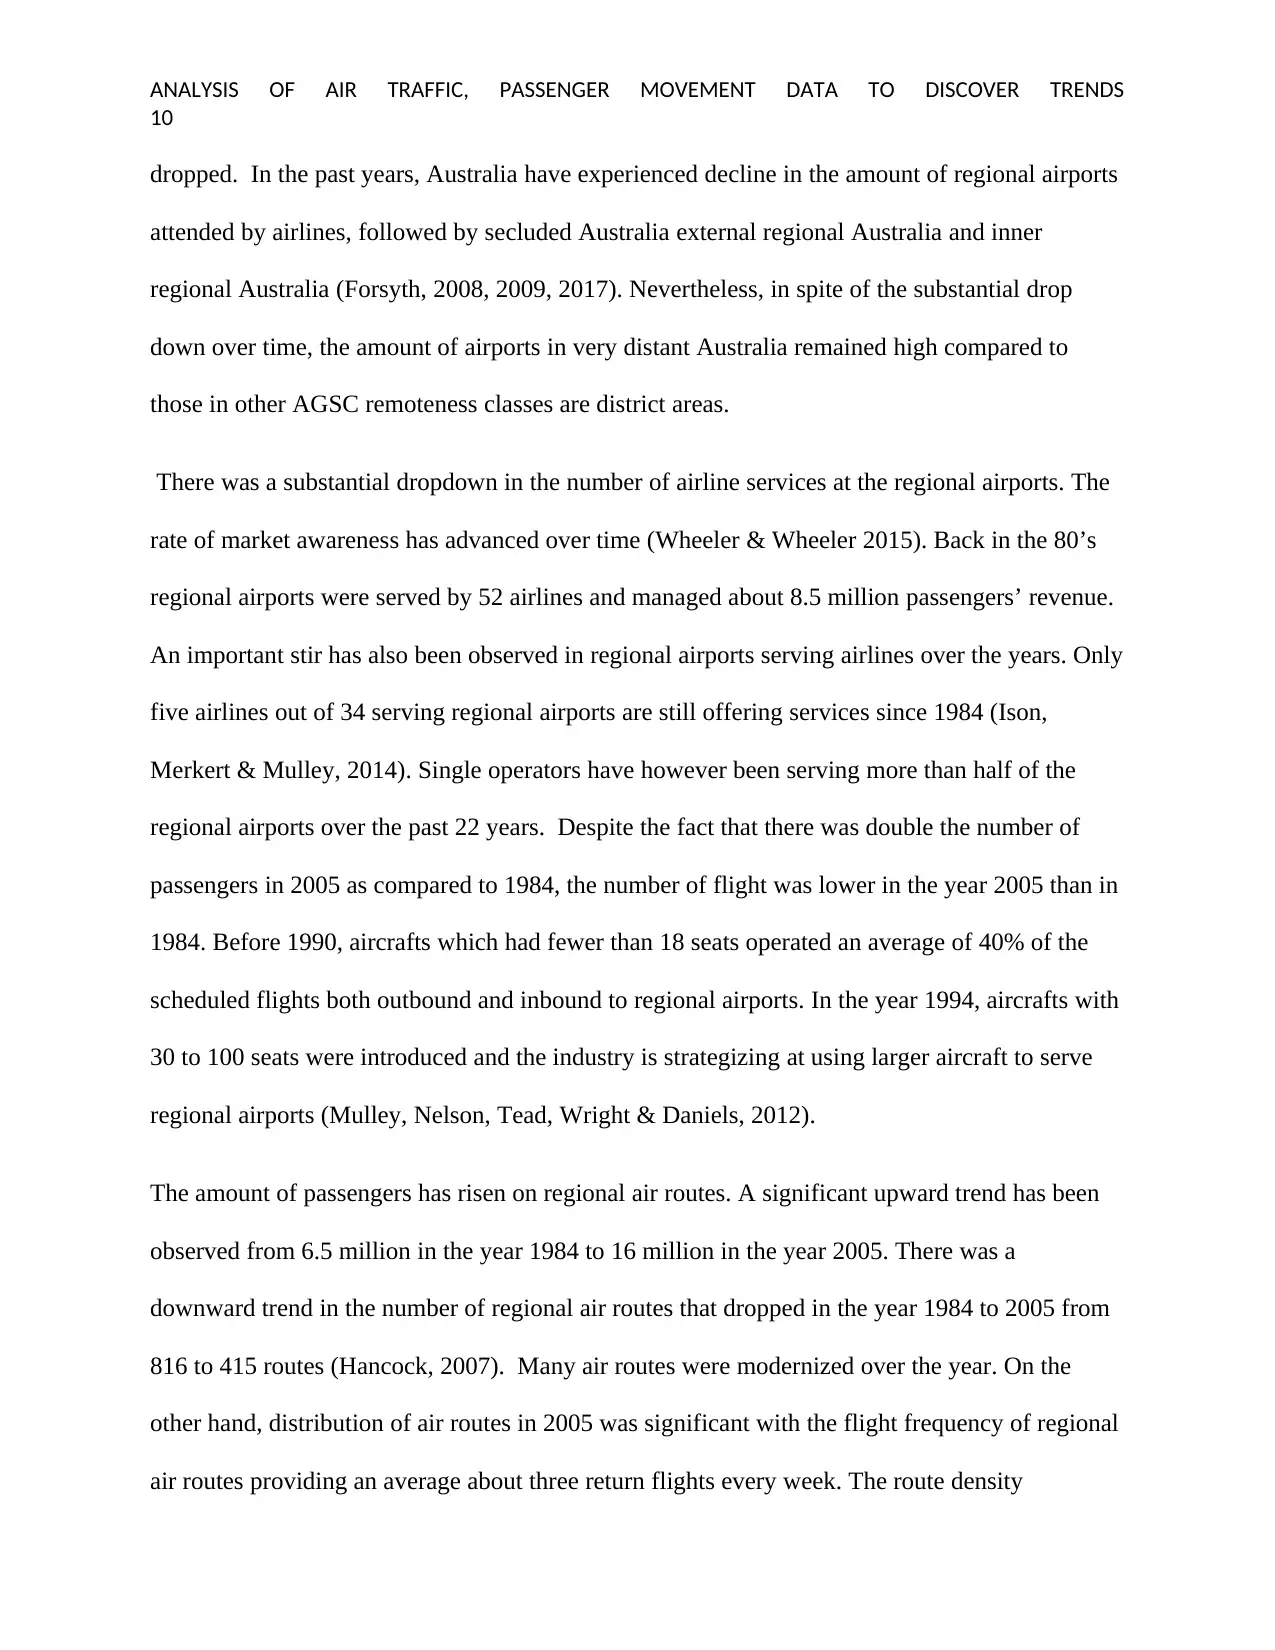
There was a substantial dropdown in the number of airline services at the regional airports. The
rate of market awareness has advanced over time (Wheeler & Wheeler 2015). Back in the 80’s
regional airports were served by 52 airlines and managed about 8.5 million passengers’ revenue.
An important stir has also been observed in regional airports serving airlines over the years. Only
five airlines out of 34 serving regional airports are still offering services since 1984 (Ison,
Merkert & Mulley, 2014). Single operators have however been serving more than half of the
regional airports over the past 22 years. Despite the fact that there was double the number of
passengers in 2005 as compared to 1984, the number of flight was lower in the year 2005 than in
1984. Before 1990, aircrafts which had fewer than 18 seats operated an average of 40% of the
scheduled flights both outbound and inbound to regional airports. In the year 1994, aircrafts with
30 to 100 seats were introduced and the industry is strategizing at using larger aircraft to serve
regional airports (Mulley, Nelson, Tead, Wright & Daniels, 2012).
The amount of passengers has risen on regional air routes. A significant upward trend has been
observed from 6.5 million in the year 1984 to 16 million in the year 2005. There was a
downward trend in the number of regional air routes that dropped in the year 1984 to 2005 from
816 to 415 routes (Hancock, 2007). Many air routes were modernized over the year. On the
other hand, distribution of air routes in 2005 was significant with the flight frequency of regional
air routes providing an average about three return flights every week. The route density
10
dropped. In the past years, Australia have experienced decline in the amount of regional airports
attended by airlines, followed by secluded Australia external regional Australia and inner
regional Australia (Forsyth, 2008, 2009, 2017). Nevertheless, in spite of the substantial drop
down over time, the amount of airports in very distant Australia remained high compared to
those in other AGSC remoteness classes are district areas.
There was a substantial dropdown in the number of airline services at the regional airports. The
rate of market awareness has advanced over time (Wheeler & Wheeler 2015). Back in the 80’s
regional airports were served by 52 airlines and managed about 8.5 million passengers’ revenue.
An important stir has also been observed in regional airports serving airlines over the years. Only
five airlines out of 34 serving regional airports are still offering services since 1984 (Ison,
Merkert & Mulley, 2014). Single operators have however been serving more than half of the
regional airports over the past 22 years. Despite the fact that there was double the number of
passengers in 2005 as compared to 1984, the number of flight was lower in the year 2005 than in
1984. Before 1990, aircrafts which had fewer than 18 seats operated an average of 40% of the
scheduled flights both outbound and inbound to regional airports. In the year 1994, aircrafts with
30 to 100 seats were introduced and the industry is strategizing at using larger aircraft to serve
regional airports (Mulley, Nelson, Tead, Wright & Daniels, 2012).
The amount of passengers has risen on regional air routes. A significant upward trend has been
observed from 6.5 million in the year 1984 to 16 million in the year 2005. There was a
downward trend in the number of regional air routes that dropped in the year 1984 to 2005 from
816 to 415 routes (Hancock, 2007). Many air routes were modernized over the year. On the
other hand, distribution of air routes in 2005 was significant with the flight frequency of regional
air routes providing an average about three return flights every week. The route density
Paraphrase This Document
Need a fresh take? Get an instant paraphrase of this document with our AI Paraphraser
ANALYSIS OF AIR TRAFFIC, PASSENGER MOVEMENT DATA TO DISCOVER TRENDS
11
transported fewer than 1000 revenue passengers annually. About 80% of regional air routes
travelled a distance of 1000km or less (Zhang & Zhang 2013).
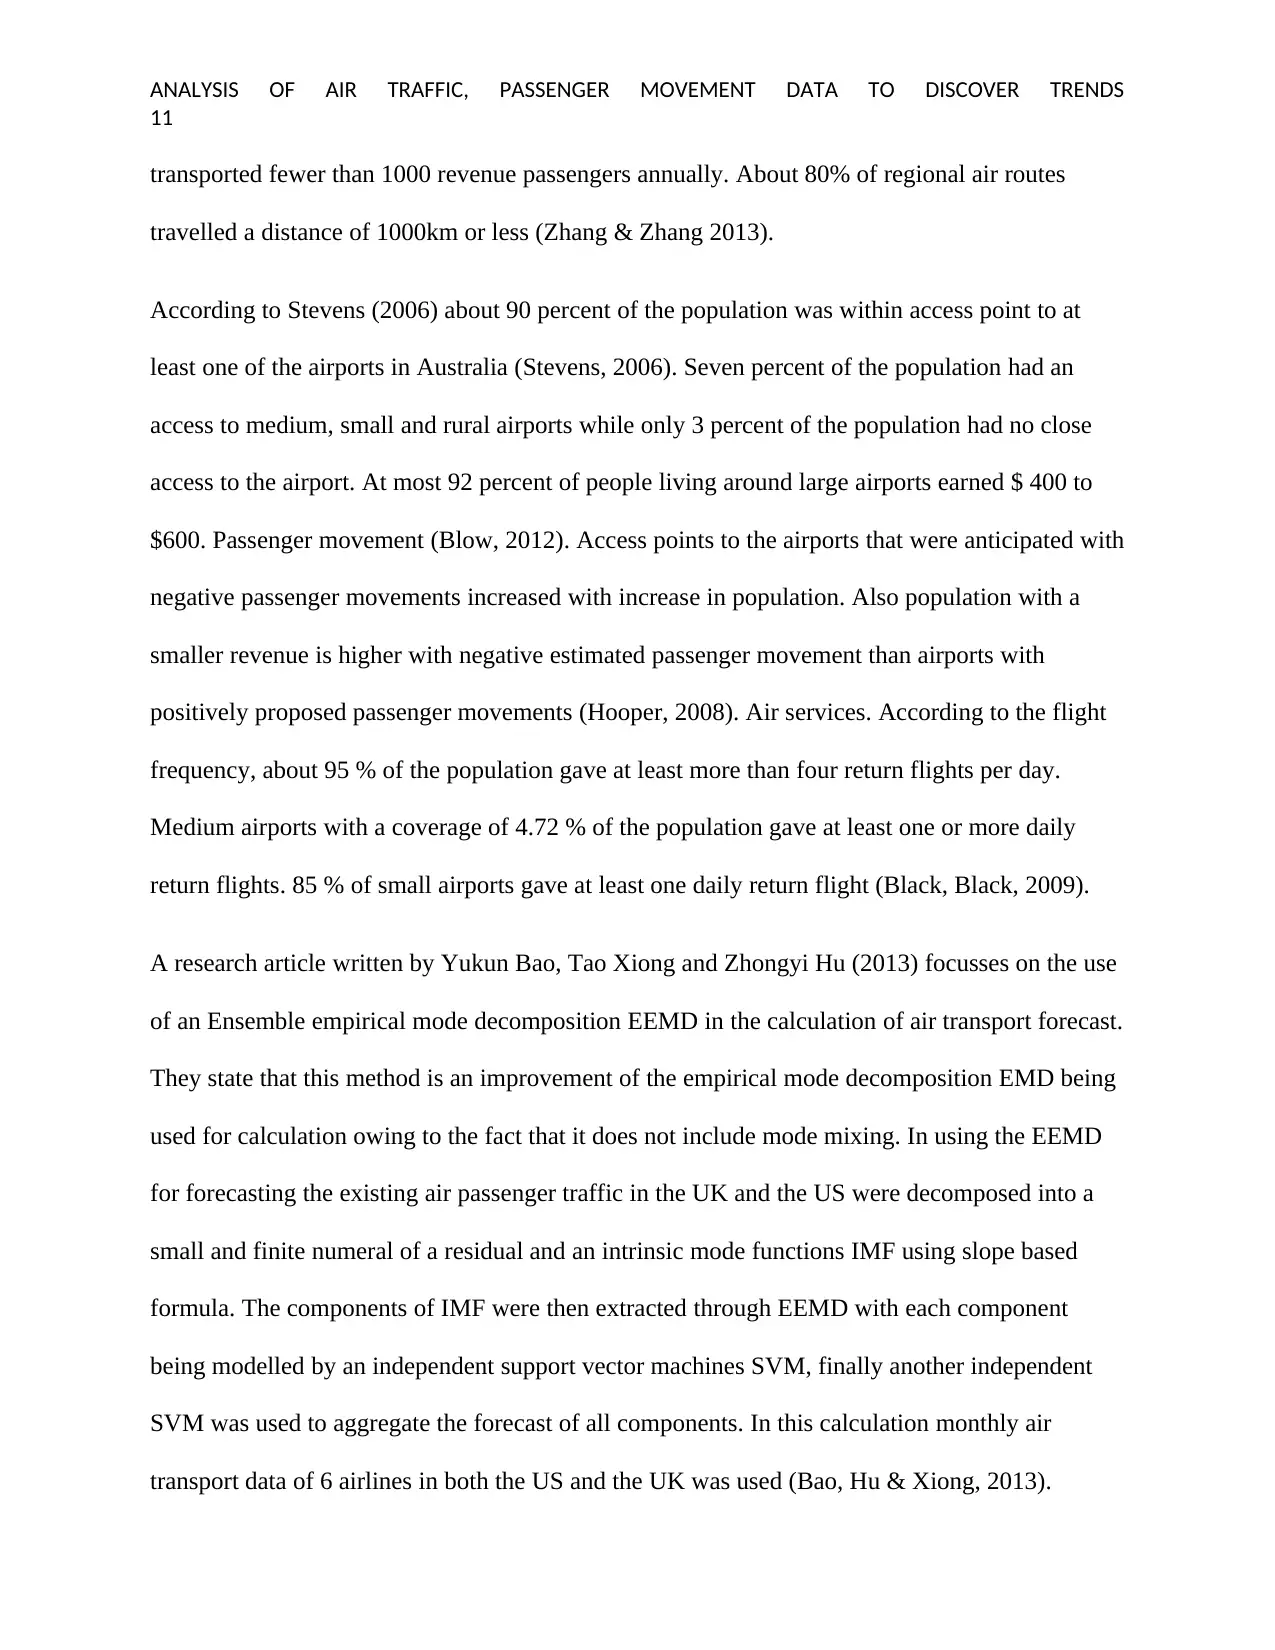
According to Stevens (2006) about 90 percent of the population was within access point to at
least one of the airports in Australia (Stevens, 2006). Seven percent of the population had an
access to medium, small and rural airports while only 3 percent of the population had no close
access to the airport. At most 92 percent of people living around large airports earned $ 400 to
$600. Passenger movement (Blow, 2012). Access points to the airports that were anticipated with
negative passenger movements increased with increase in population. Also population with a
smaller revenue is higher with negative estimated passenger movement than airports with
positively proposed passenger movements (Hooper, 2008). Air services. According to the flight
frequency, about 95 % of the population gave at least more than four return flights per day.
Medium airports with a coverage of 4.72 % of the population gave at least one or more daily
return flights. 85 % of small airports gave at least one daily return flight (Black, Black, 2009).
A research article written by Yukun Bao, Tao Xiong and Zhongyi Hu (2013) focusses on the use
of an Ensemble empirical mode decomposition EEMD in the calculation of air transport forecast.
They state that this method is an improvement of the empirical mode decomposition EMD being
used for calculation owing to the fact that it does not include mode mixing. In using the EEMD
for forecasting the existing air passenger traffic in the UK and the US were decomposed into a
small and finite numeral of a residual and an intrinsic mode functions IMF using slope based
formula. The components of IMF were then extracted through EEMD with each component
being modelled by an independent support vector machines SVM, finally another independent
SVM was used to aggregate the forecast of all components. In this calculation monthly air
transport data of 6 airlines in both the US and the UK was used (Bao, Hu & Xiong, 2013).
11
transported fewer than 1000 revenue passengers annually. About 80% of regional air routes
travelled a distance of 1000km or less (Zhang & Zhang 2013).
According to Stevens (2006) about 90 percent of the population was within access point to at
least one of the airports in Australia (Stevens, 2006). Seven percent of the population had an
access to medium, small and rural airports while only 3 percent of the population had no close
access to the airport. At most 92 percent of people living around large airports earned $ 400 to
$600. Passenger movement (Blow, 2012). Access points to the airports that were anticipated with
negative passenger movements increased with increase in population. Also population with a
smaller revenue is higher with negative estimated passenger movement than airports with
positively proposed passenger movements (Hooper, 2008). Air services. According to the flight
frequency, about 95 % of the population gave at least more than four return flights per day.
Medium airports with a coverage of 4.72 % of the population gave at least one or more daily
return flights. 85 % of small airports gave at least one daily return flight (Black, Black, 2009).
A research article written by Yukun Bao, Tao Xiong and Zhongyi Hu (2013) focusses on the use
of an Ensemble empirical mode decomposition EEMD in the calculation of air transport forecast.
They state that this method is an improvement of the empirical mode decomposition EMD being
used for calculation owing to the fact that it does not include mode mixing. In using the EEMD
for forecasting the existing air passenger traffic in the UK and the US were decomposed into a
small and finite numeral of a residual and an intrinsic mode functions IMF using slope based
formula. The components of IMF were then extracted through EEMD with each component
being modelled by an independent support vector machines SVM, finally another independent
SVM was used to aggregate the forecast of all components. In this calculation monthly air
transport data of 6 airlines in both the US and the UK was used (Bao, Hu & Xiong, 2013).
ANALYSIS OF AIR TRAFFIC, PASSENGER MOVEMENT DATA TO DISCOVER TRENDS
12
In recent decades the aviation industry in Australia has faced a major debate on the competence
of programmed air flights both inbound and outbound from regional societies (Gunaratnam,
Tobin, Seale, Marich & Mc-Anulty, 2014). Various policy makers in the country’s different
organizations have faced matters concerning the accessibility, viability and sustainability of
some of the parts in the country (Lepani, Freed, Murphy & Mc-Givillary, 2009). There is need
for a detailed research with the aim of informing the industry and policy development (Collyer,
Barnes, Churchman, Clarkson & Steiner, 2014). This should be done by ensuring the research
provides a better comprehension of the state of the air transport industry, pointing out essential
issues and trends.
FRAMEWORKS
Various types of relevant literature have been reviewed on the artefact addressing the project
problem efficiently. In the project data has been gathered on the inbound and outbound of
aircraft in Australia. The data has been fed to the Microsoft excel software and analysis done on
it with the aim of addressing the problem statement which is to discover trends and patterns in air
transport in Australia in order to help in forecasting (Gaudry & Mayes, 2012).
The analysis is done based on the fact that the Australian air transport industry is important to the
economy and the globe since it has a significant impact. It is assumed that a significant number
of stakeholders will find the data analysis and discussion important in making their decisions
related to the Australian air transport industry (May, Hill, 2006).
It is assumed that the data used in this project which has been gathered from various online
sources is accurate and thus can be relied on by the various stakeholders who have been
discussed in the problem statement.
⊘ This is a preview!⊘
Do you want full access?
Subscribe today to unlock all pages.
Trusted by 1+ million students worldwide
1 out of 47


Your All-in-One AI-Powered Toolkit for Academic Success.
+13062052269
info@desklib.com
Available 24*7 on WhatsApp / Email
![[object Object]](/_next/static/media/star-bottom.7253800d.svg)
Unlock your academic potential
Copyright © 2020–2026 A2Z Services. All Rights Reserved. Developed and managed by ZUCOL.