University Data Analysis Report: Airbnb Business Statistics (BUS708)
VerifiedAdded on 2022/08/28
|14
|1823
|19
Report
AI Summary
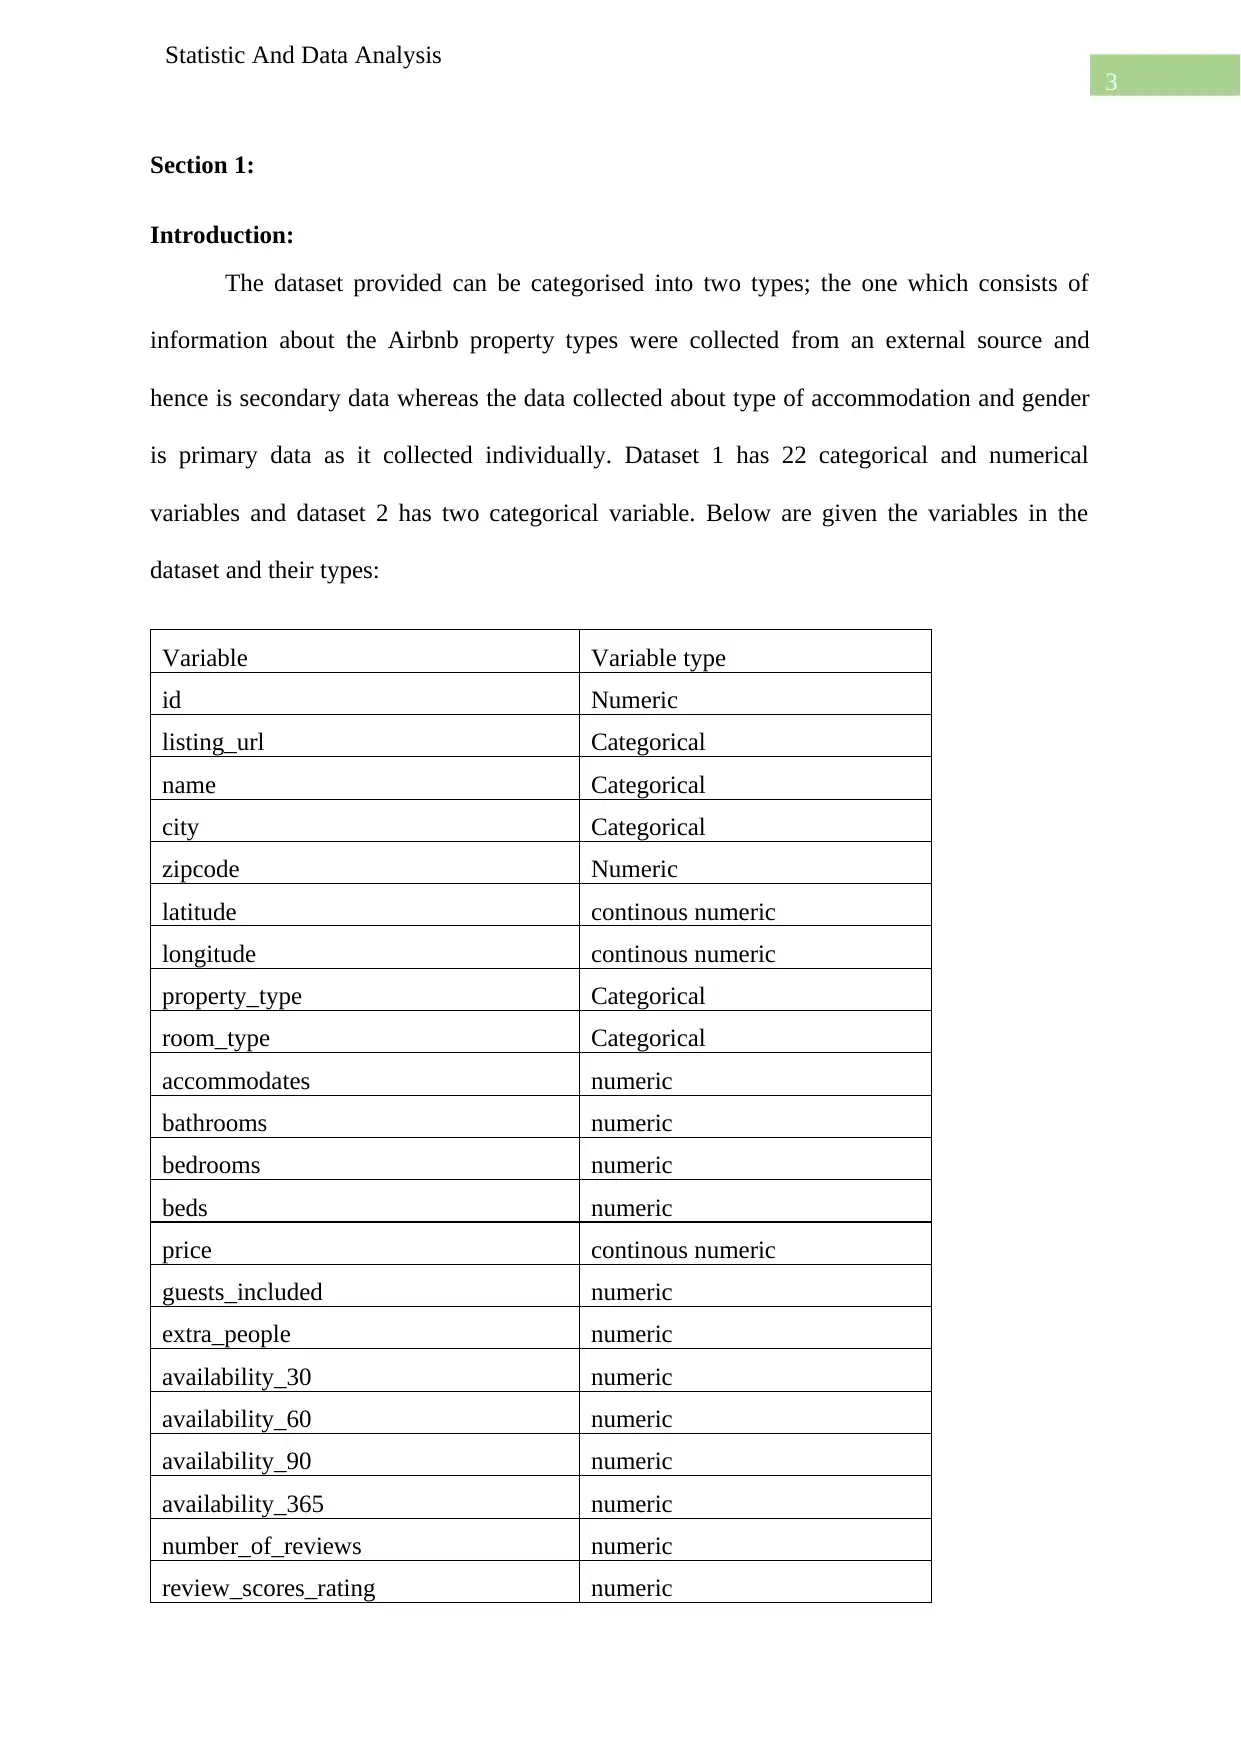
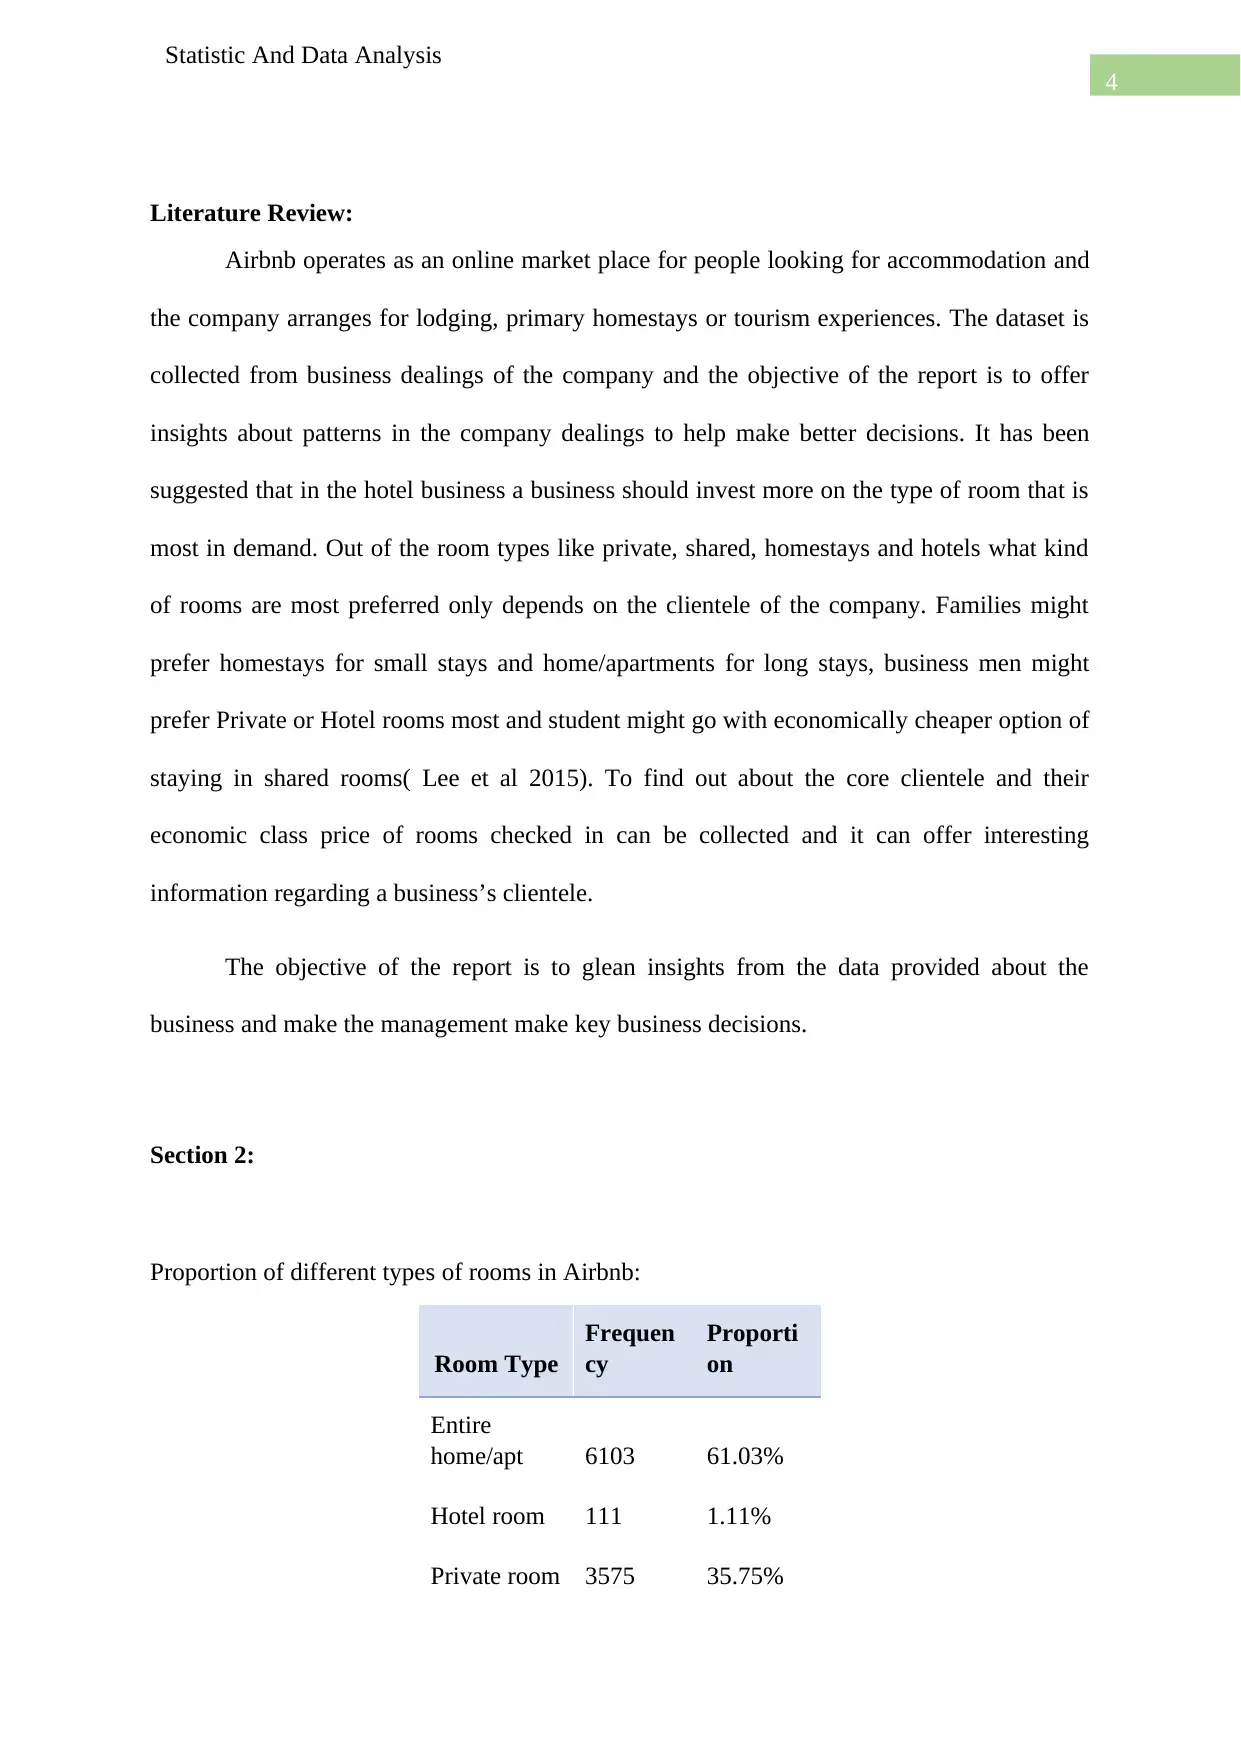
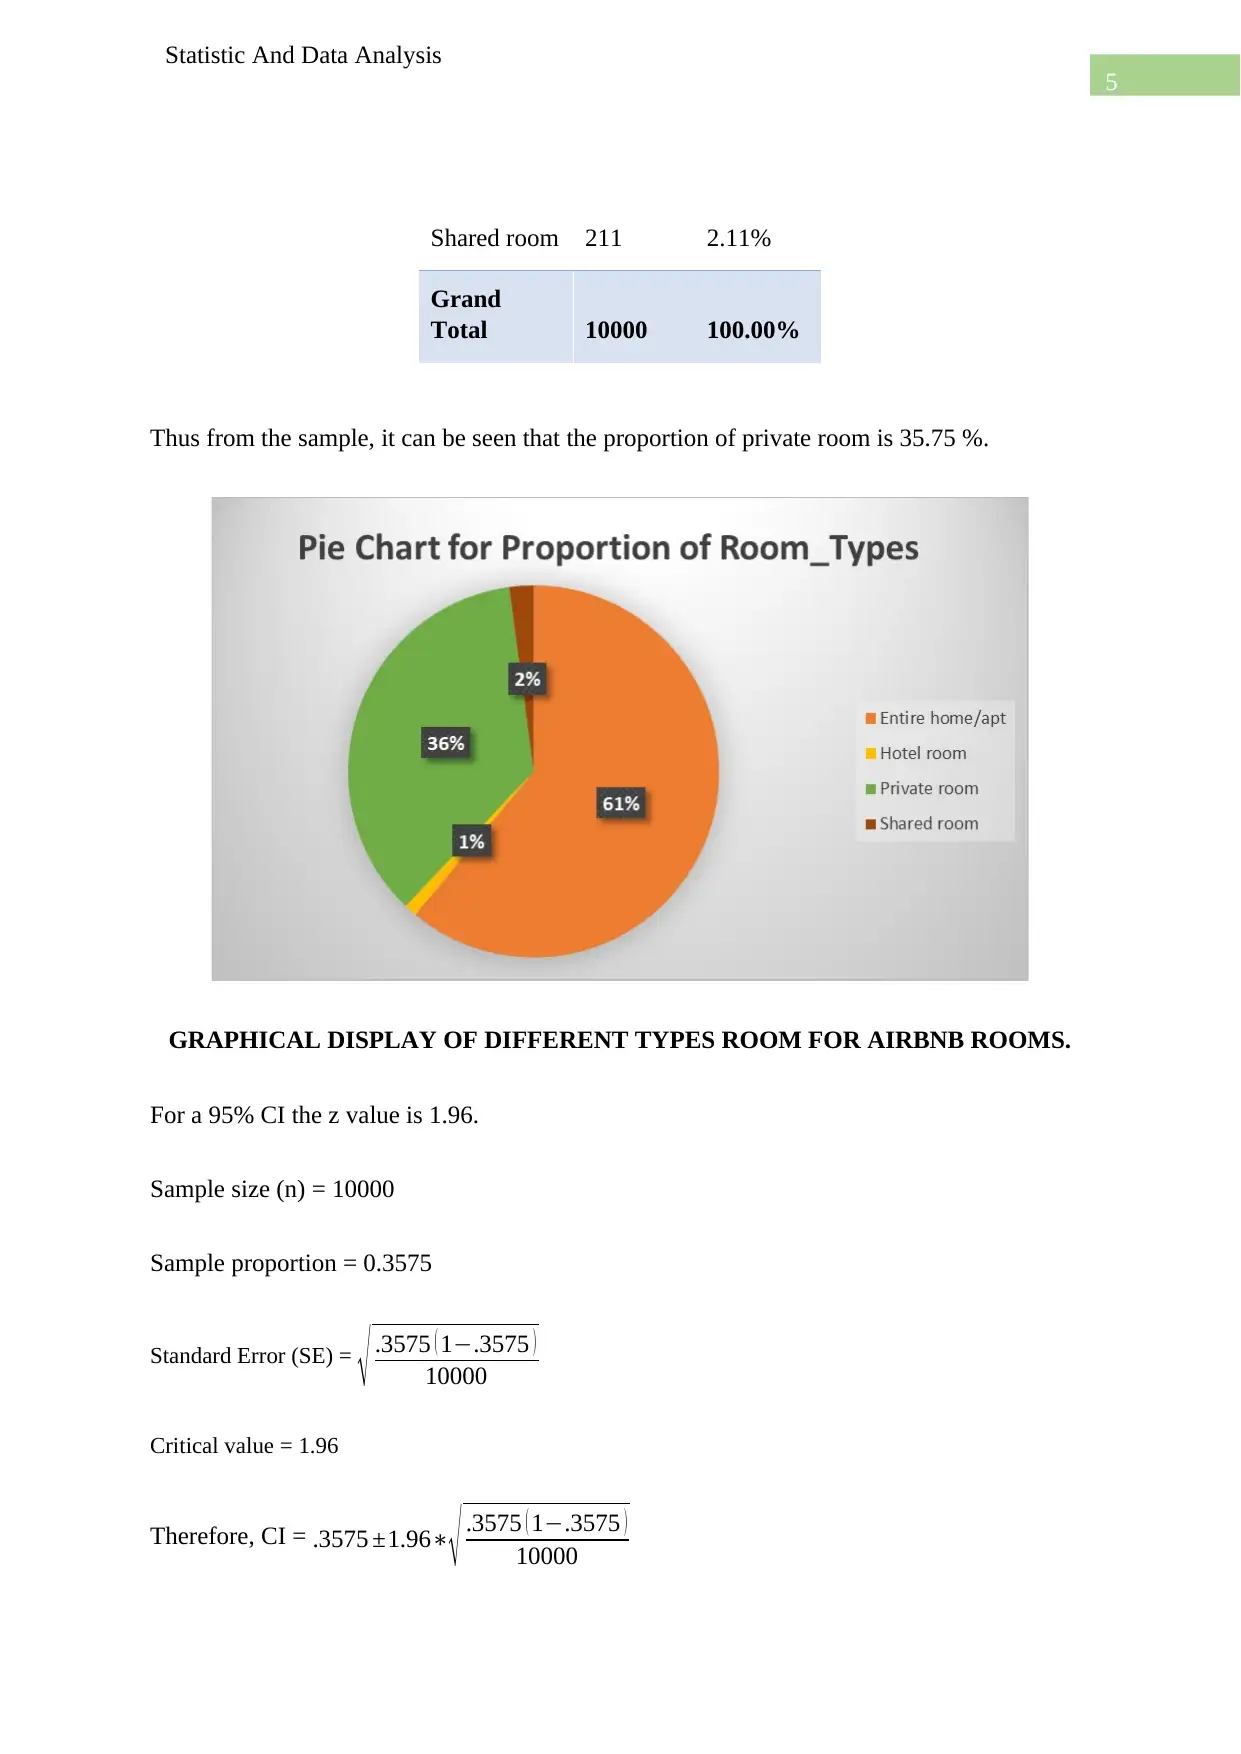
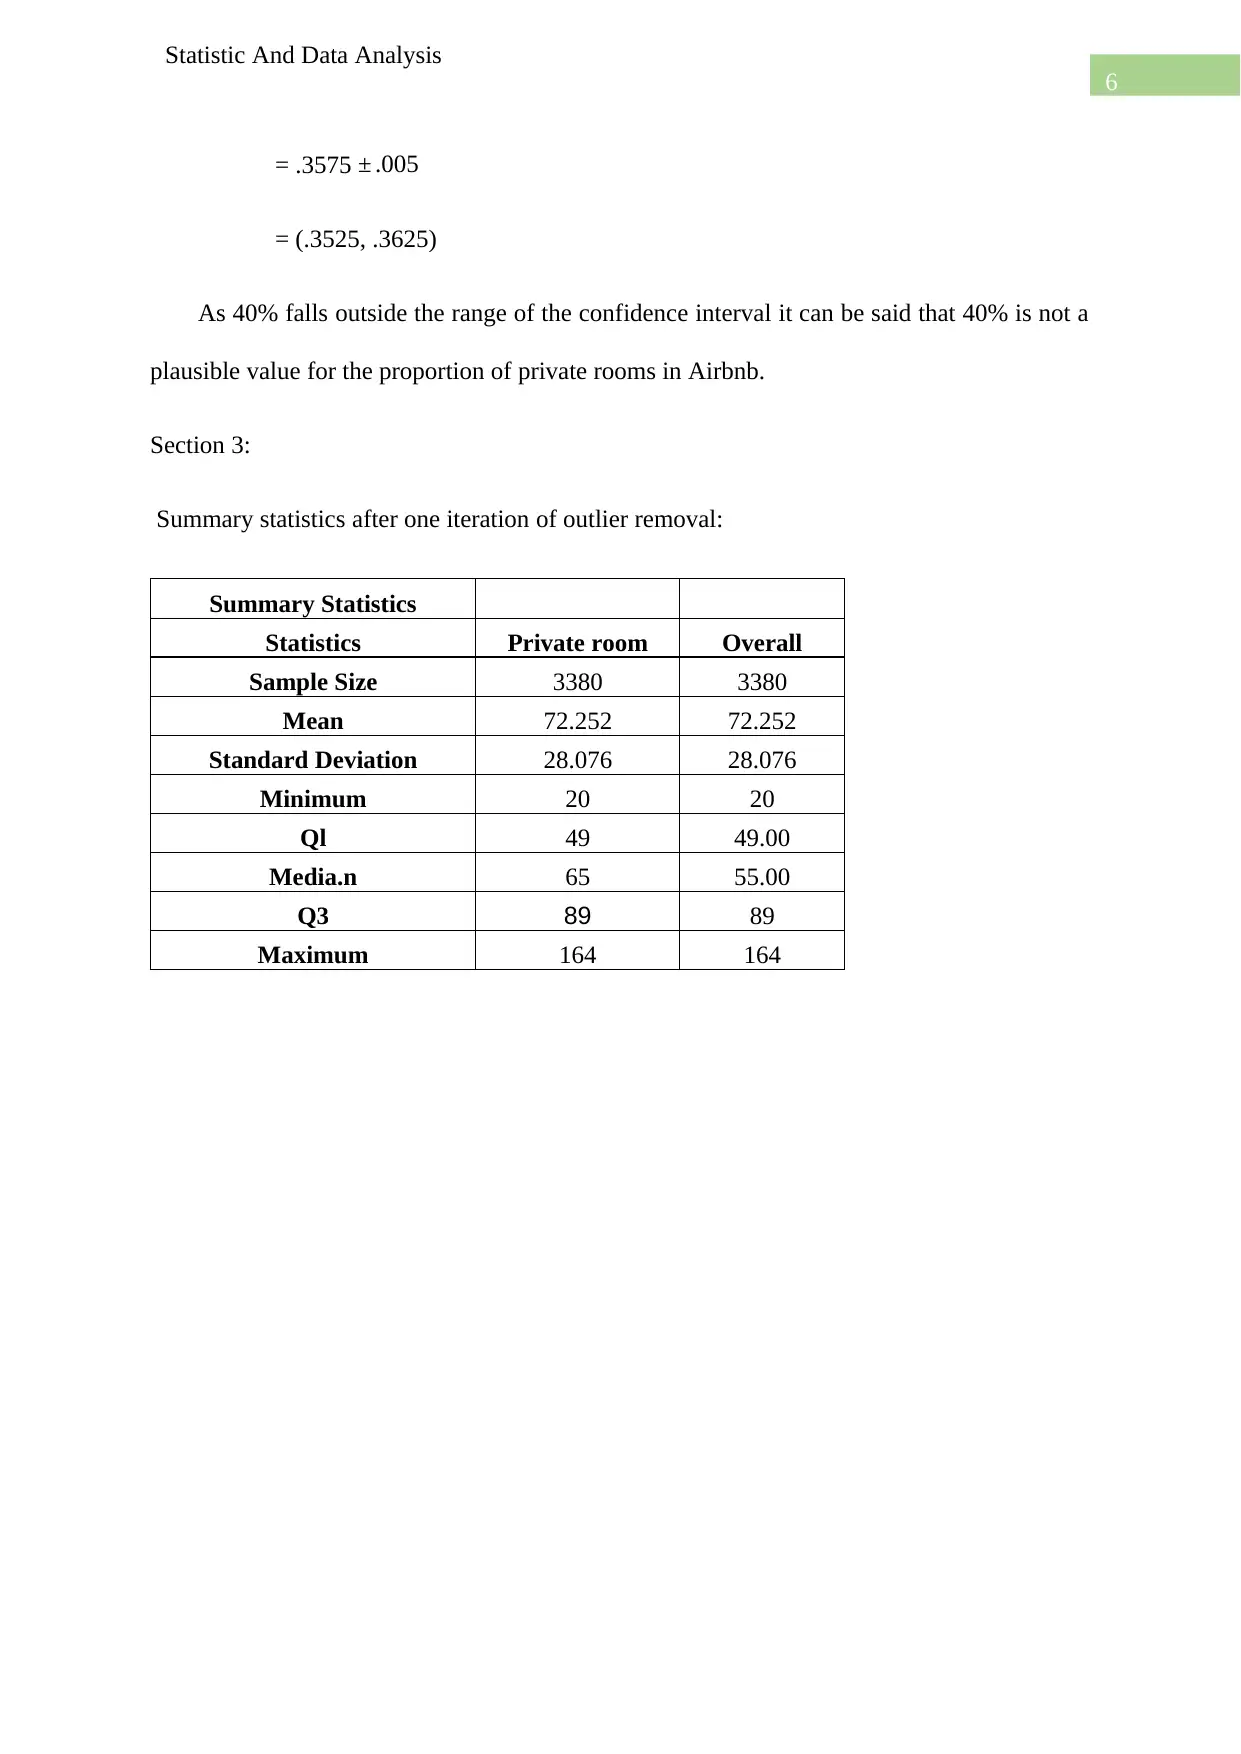
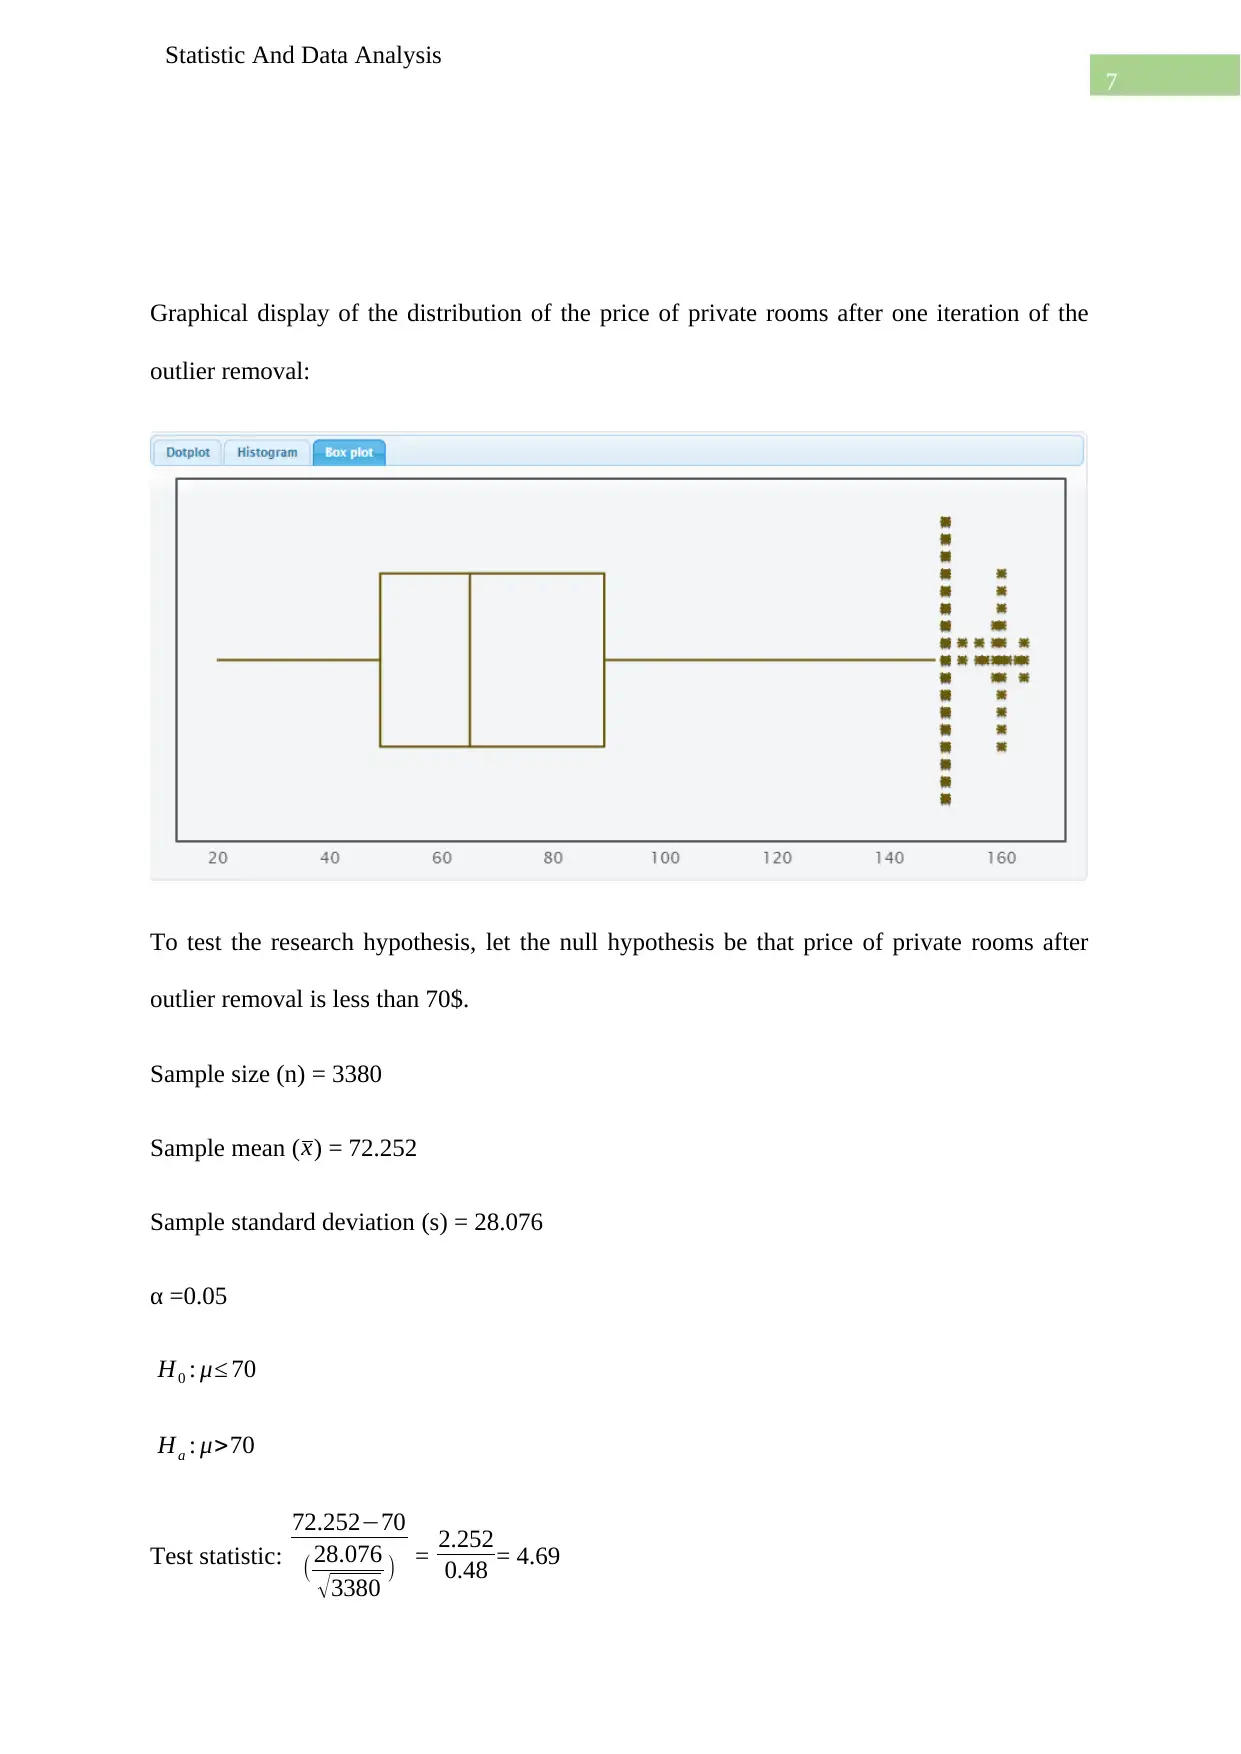
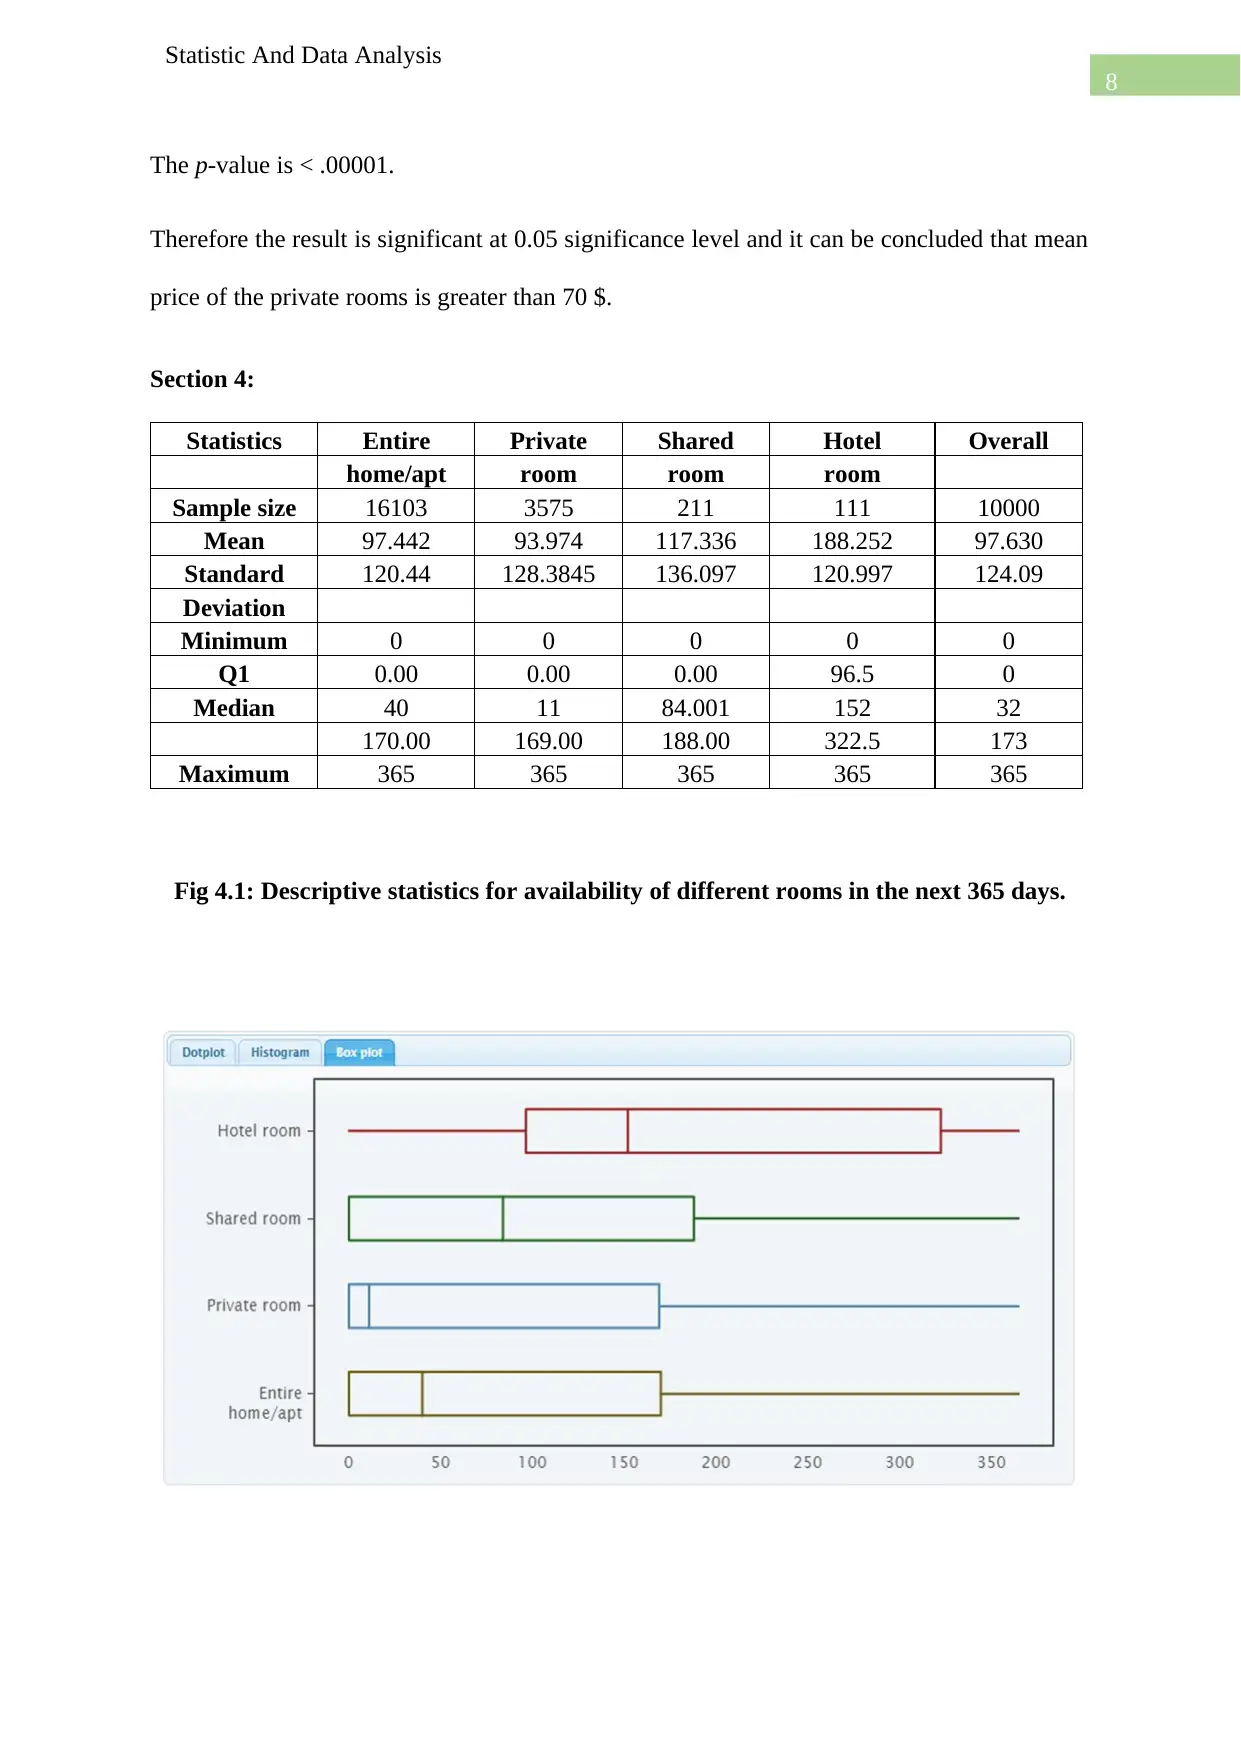
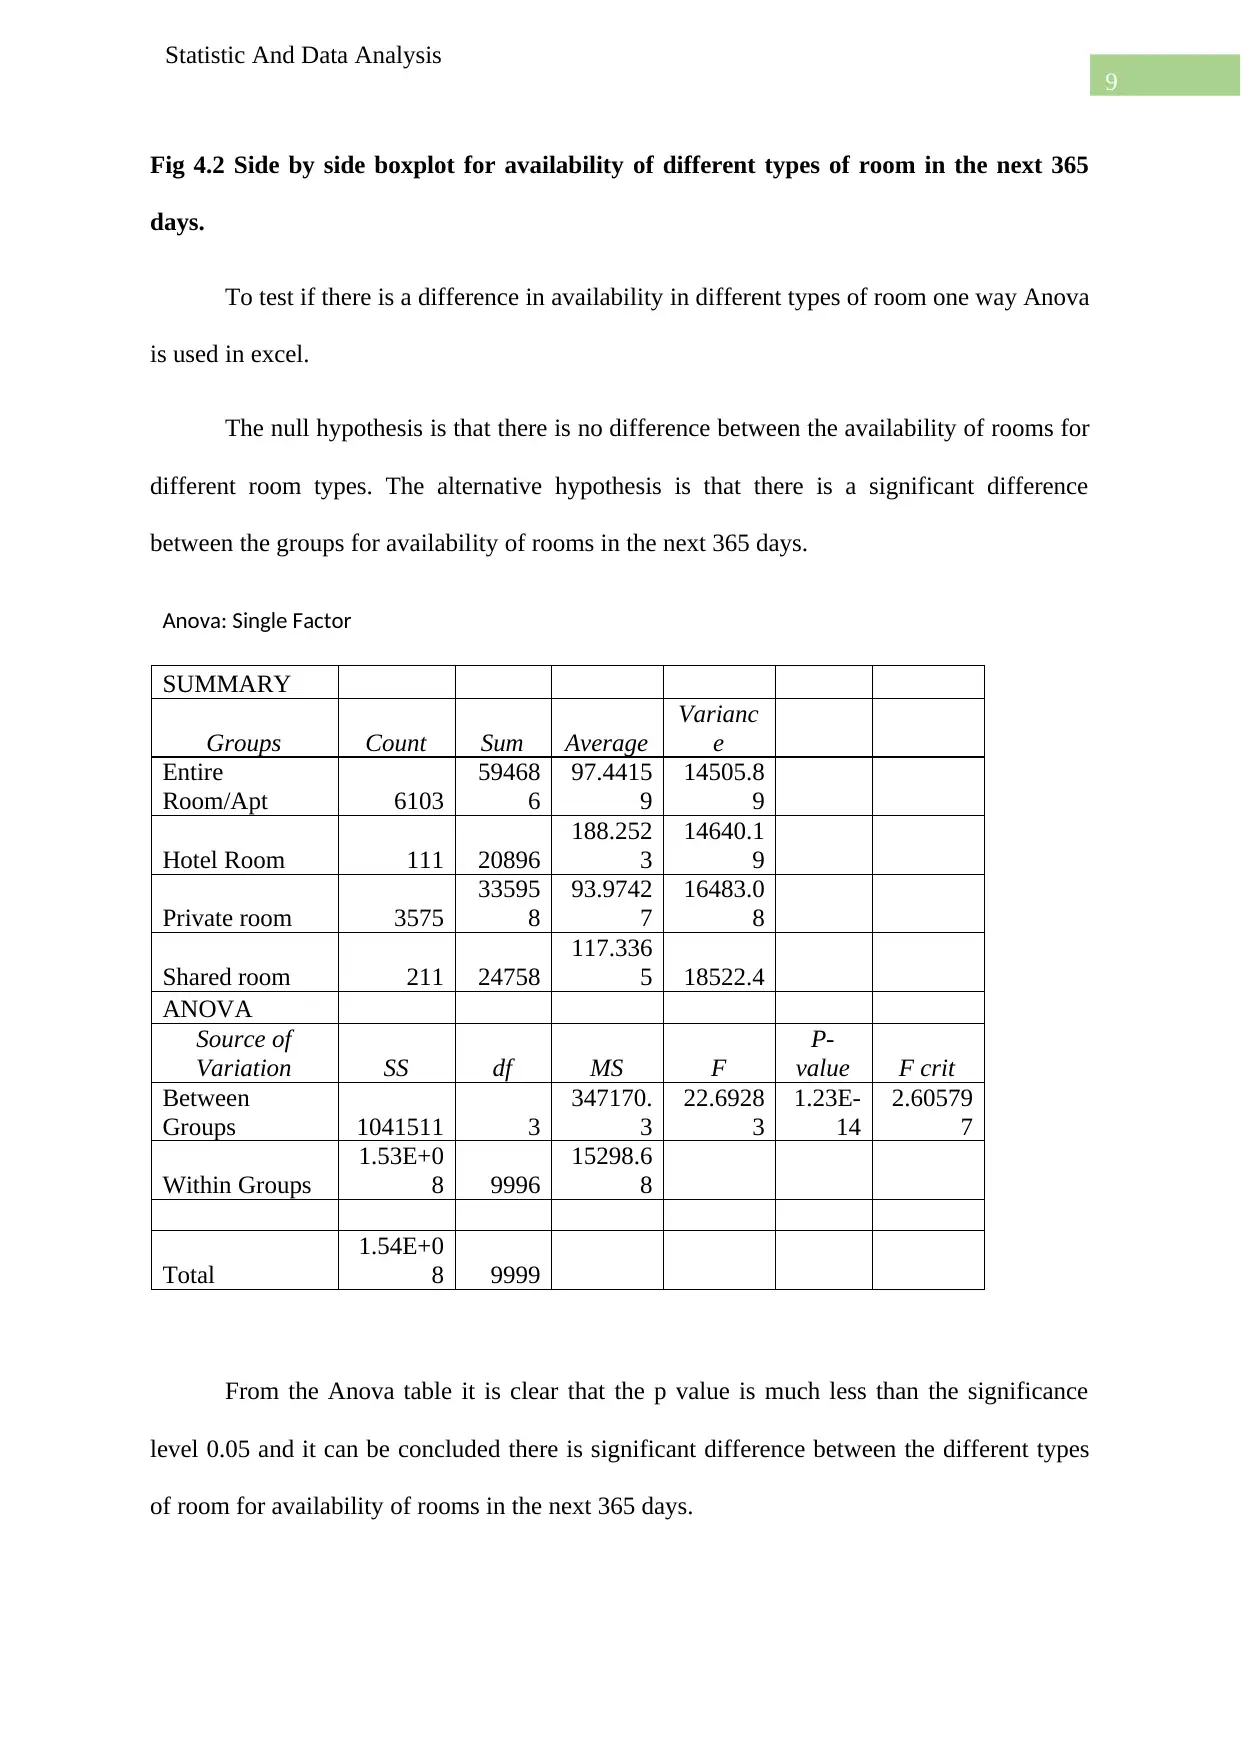
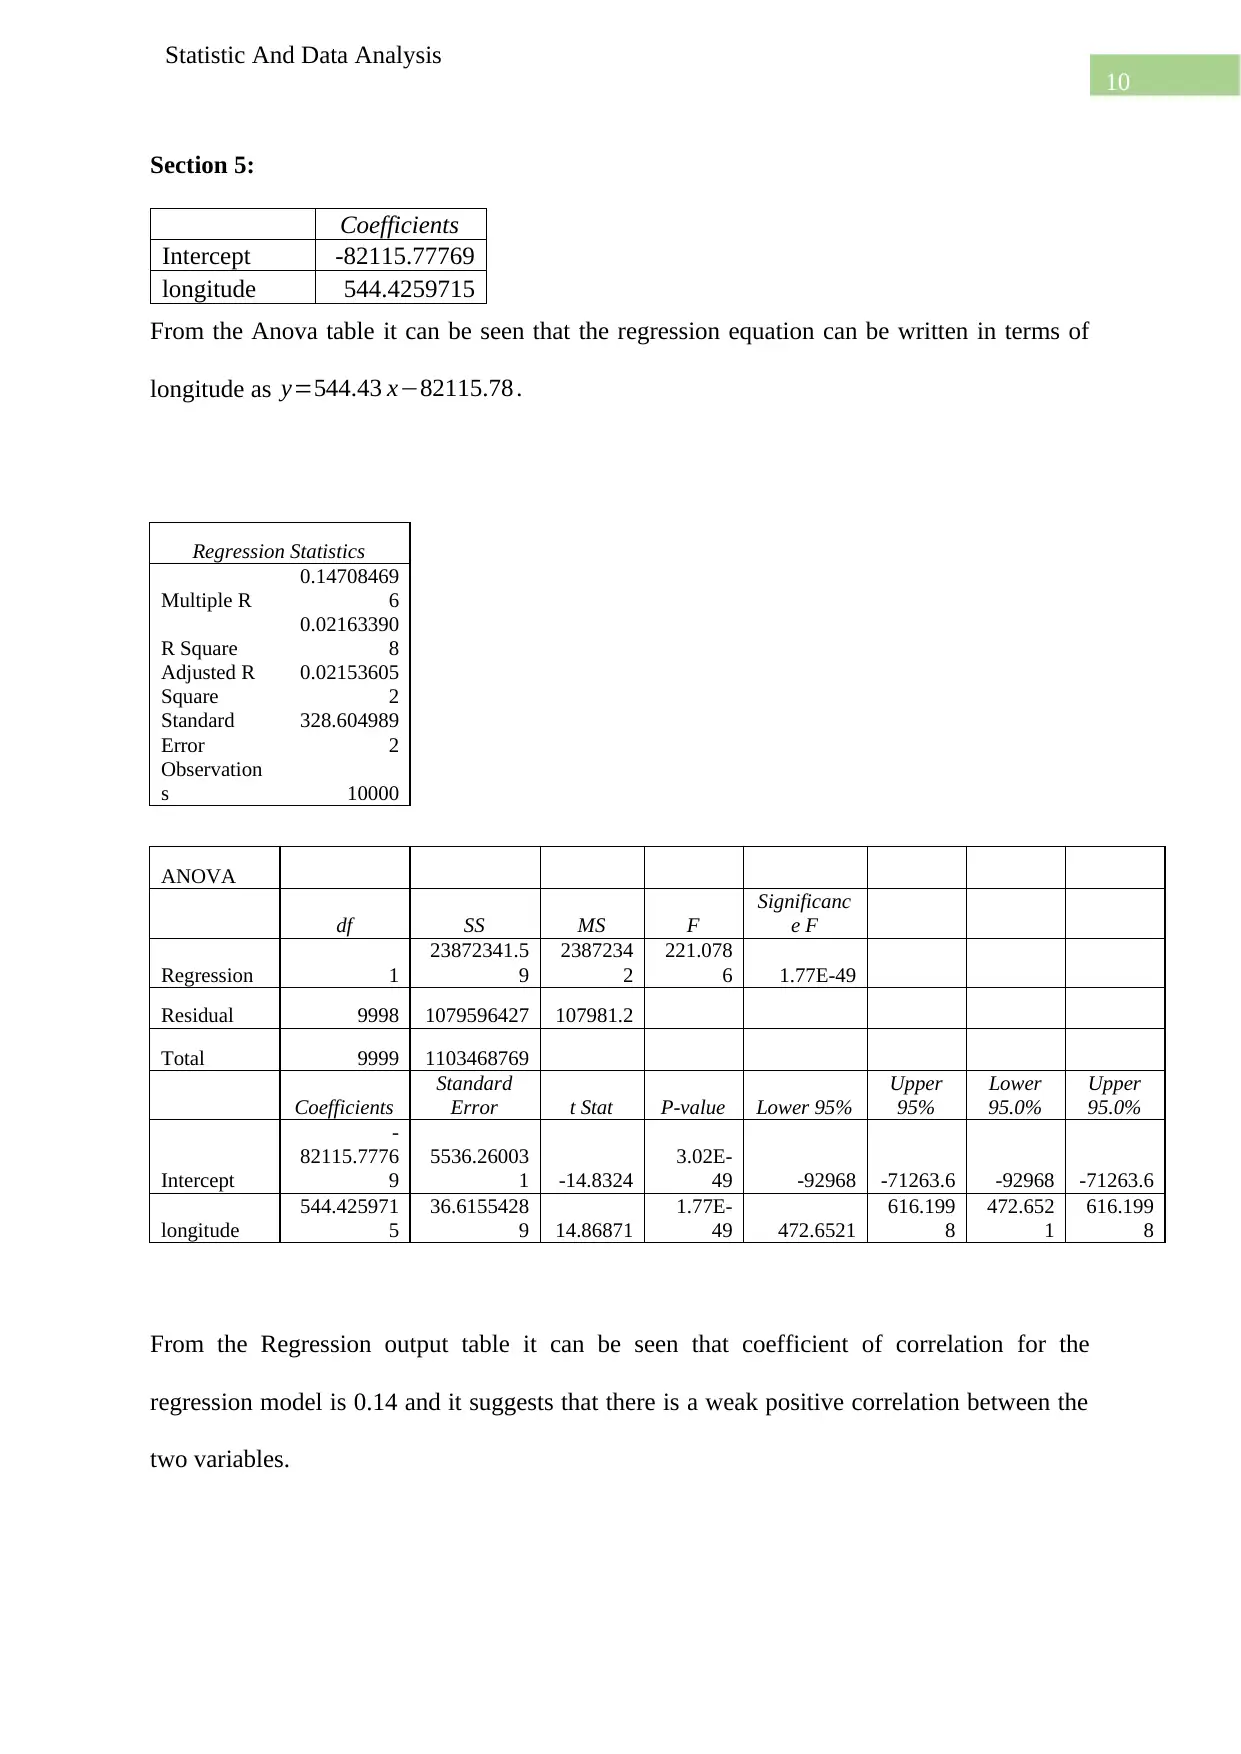
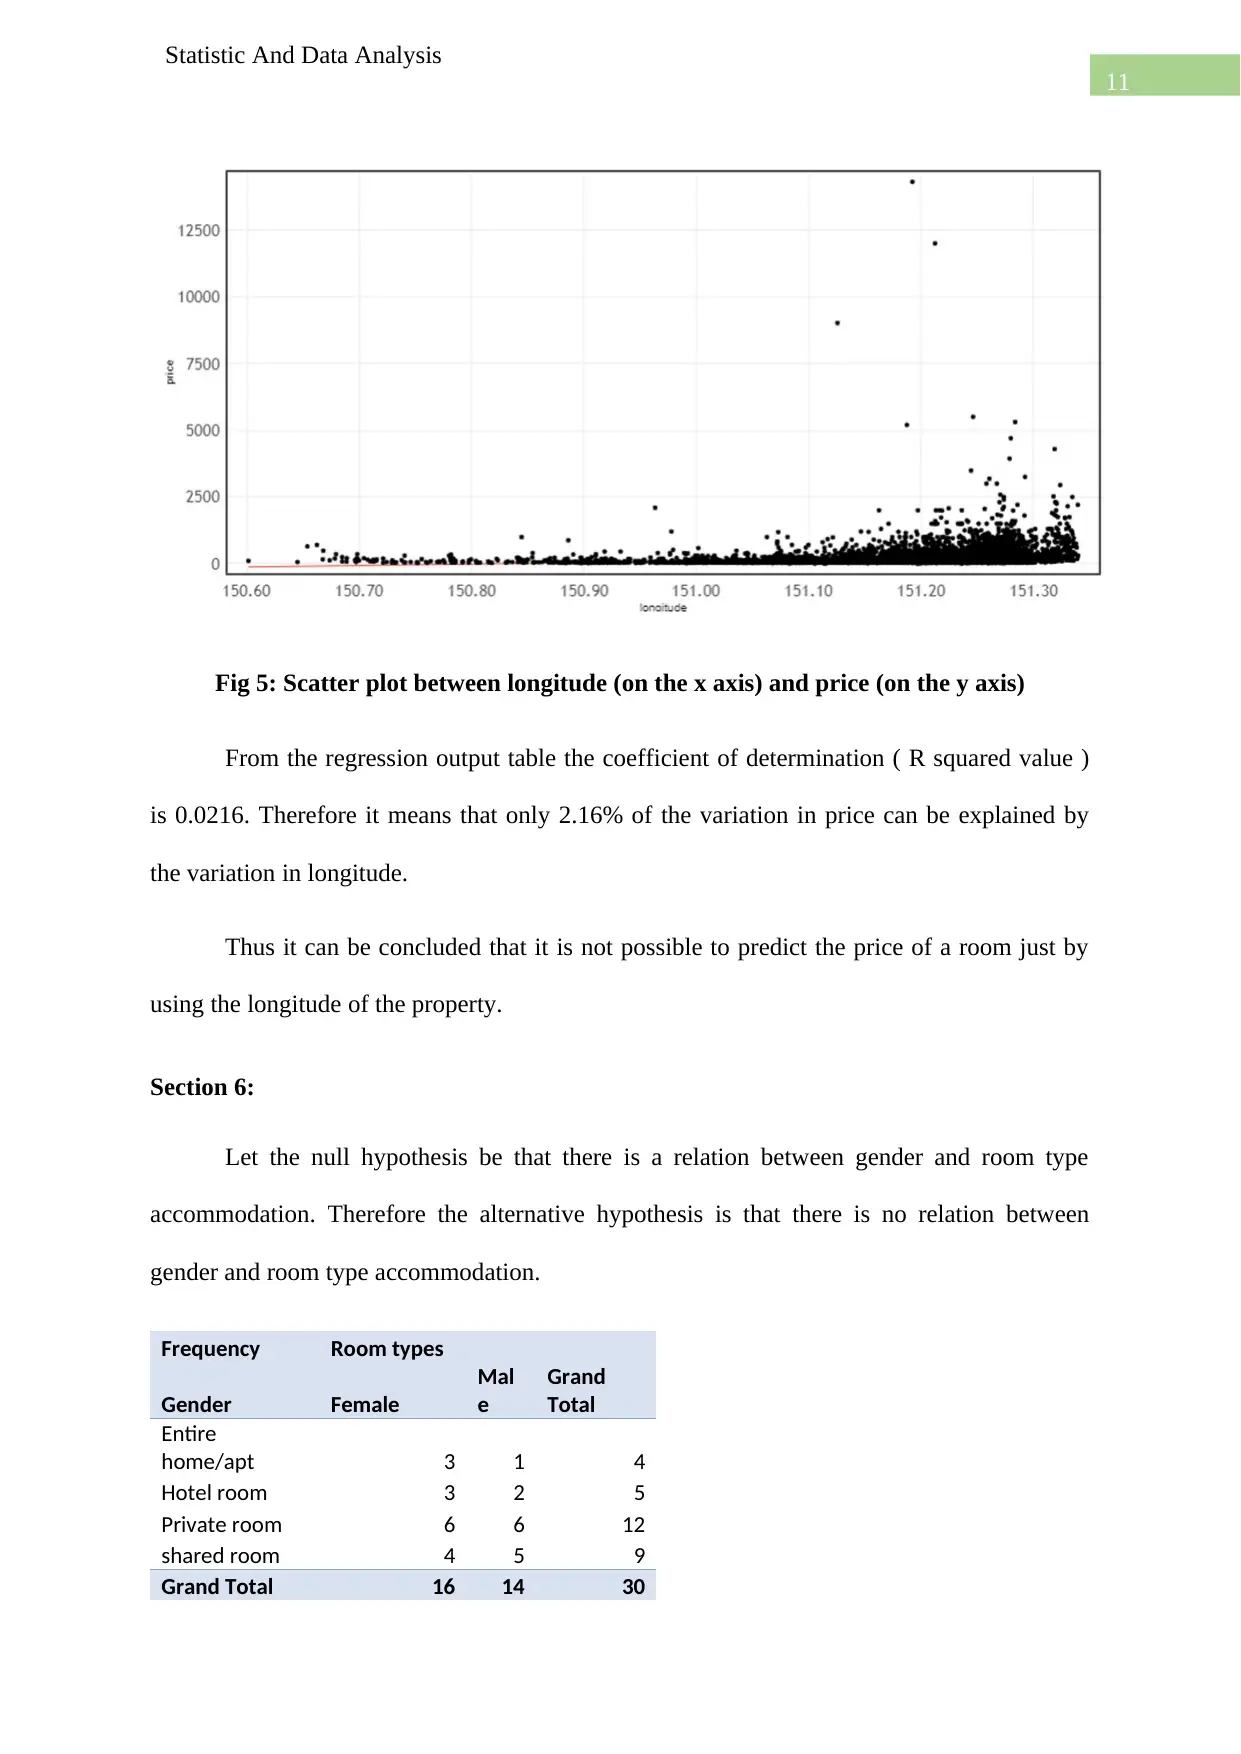
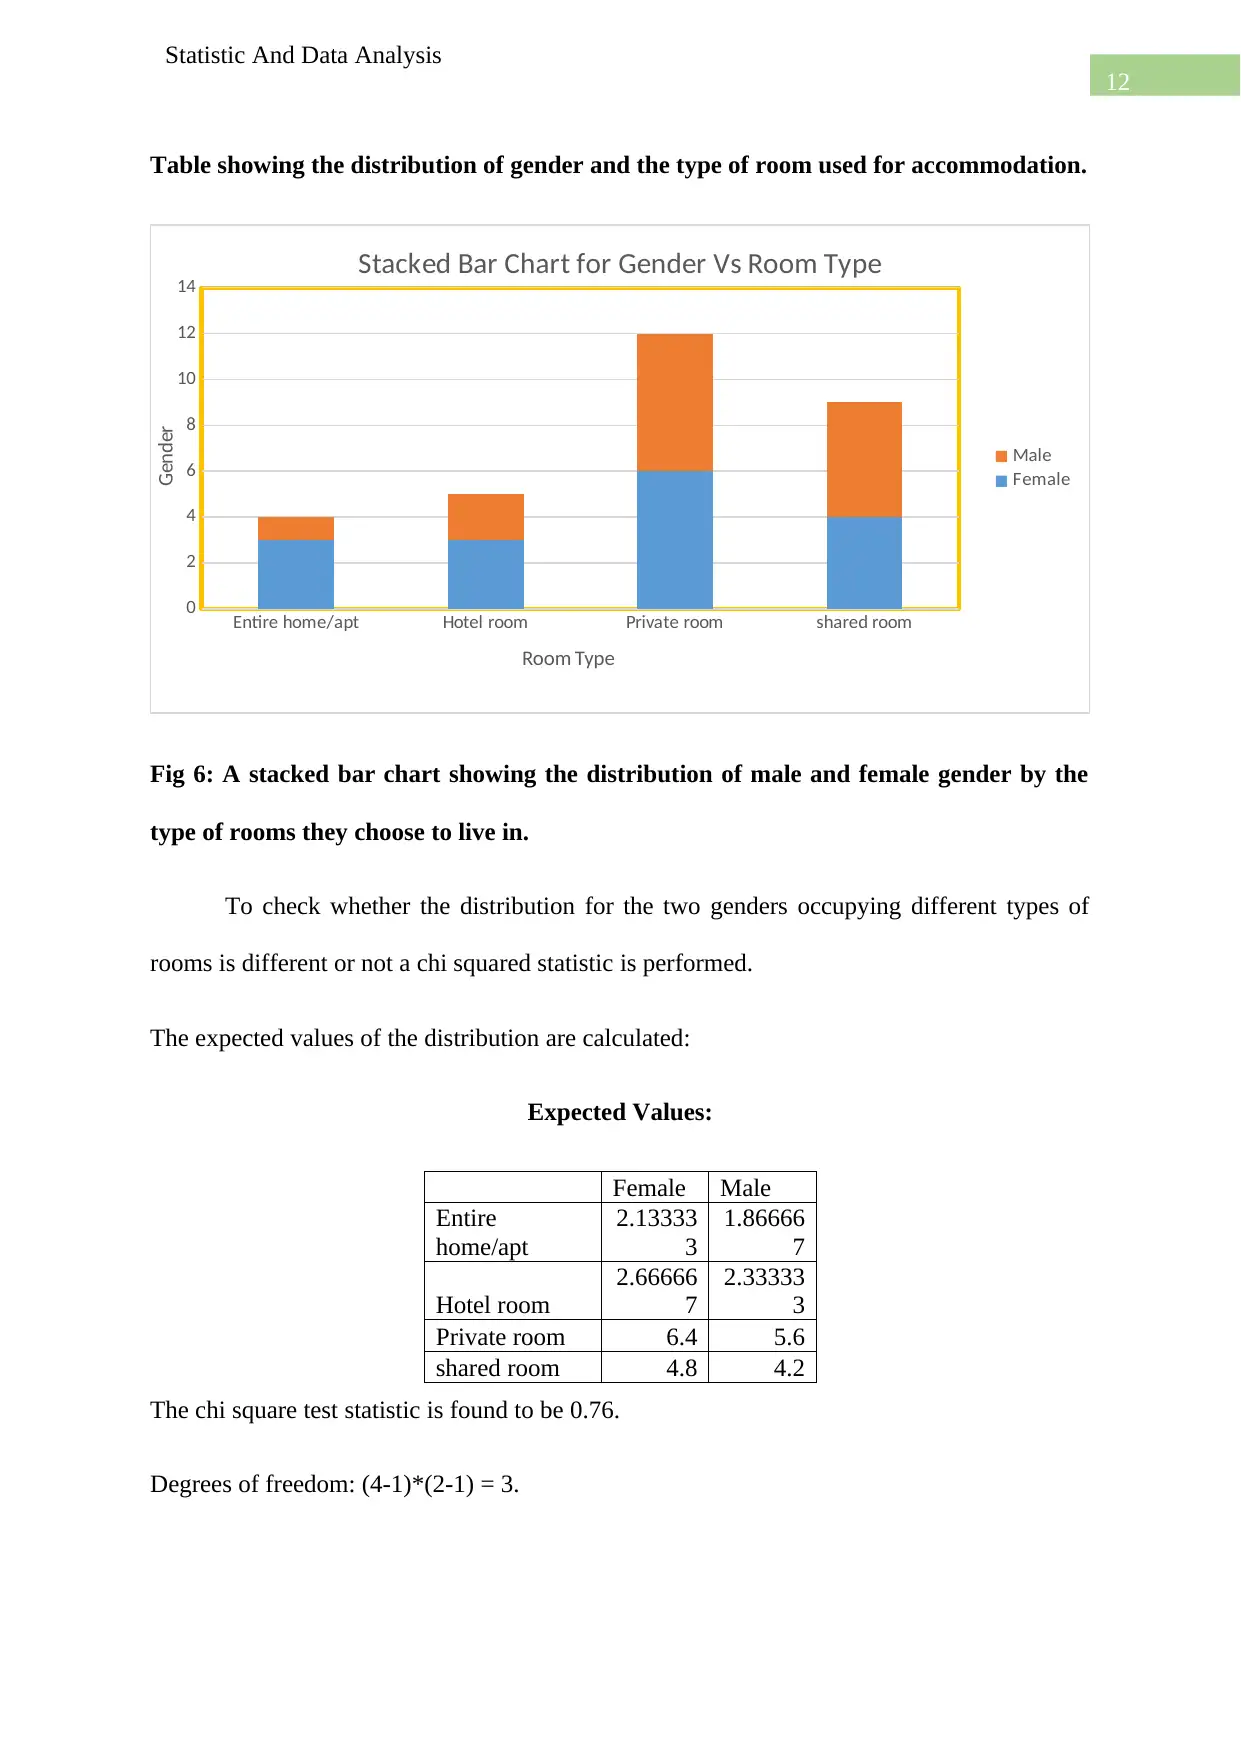
This report presents a comprehensive statistical analysis of Airbnb data, encompassing various aspects of the business operations. The introduction categorizes the datasets and defines the variables. The report begins by examining the proportions of different room types, calculating confidence intervals, and assessing the plausibility of specific values. Summary statistics and graphical displays of the distribution of private room prices are presented, followed by hypothesis testing to determine if the mean price exceeds a certain threshold. The analysis extends to comparing the availability of different room types using ANOVA, establishing significant differences. Regression analysis is performed to explore the relationship between longitude and price, revealing a weak correlation. Finally, a chi-squared test is conducted to investigate the relationship between gender and room type preference, concluding no significant association. The report concludes with a summary of findings and recommendations for informed business decisions, such as focusing on high-demand room types, understanding customer demographics, and further research into price determinants.
Contribute Materials
Your contribution can guide someone’s learning journey. Share your
documents today.

Running head: Statistic And Data Analysis
Statistic And Data Analysis
Name of the Student
Name of the University
Statistic And Data Analysis
Name of the Student
Name of the University
Secure Best Marks with AI Grader
Need help grading? Try our AI Grader for instant feedback on your assignments.

2
Statistic And Data Analysis
Table of Contents
Section 1:....................................................................................................................................3
Section 2:....................................................................................................................................4
Section 4:....................................................................................................................................8
Section 5:....................................................................................................................................9
Section 6:..................................................................................................................................11
Section 7:..................................................................................................................................12
References:...............................................................................................................................14

3
Statistic And Data Analysis
Section 1:
Introduction:
The dataset provided can be categorised into two types; the one which consists of
information about the Airbnb property types were collected from an external source and
hence is secondary data whereas the data collected about type of accommodation and gender
is primary data as it collected individually. Dataset 1 has 22 categorical and numerical
variables and dataset 2 has two categorical variable. Below are given the variables in the
dataset and their types:
Variable Variable type
id Numeric
listing_url Categorical
name Categorical
city Categorical
zipcode Numeric
latitude continous numeric
longitude continous numeric
property_type Categorical
room_type Categorical
accommodates numeric
bathrooms numeric
bedrooms numeric
beds numeric
price continous numeric
guests_included numeric
extra_people numeric
availability_30 numeric
availability_60 numeric
availability_90 numeric
availability_365 numeric
number_of_reviews numeric
review_scores_rating numeric

4
Statistic And Data Analysis
Literature Review:
Airbnb operates as an online market place for people looking for accommodation and
the company arranges for lodging, primary homestays or tourism experiences. The dataset is
collected from business dealings of the company and the objective of the report is to offer
insights about patterns in the company dealings to help make better decisions. It has been
suggested that in the hotel business a business should invest more on the type of room that is
most in demand. Out of the room types like private, shared, homestays and hotels what kind
of rooms are most preferred only depends on the clientele of the company. Families might
prefer homestays for small stays and home/apartments for long stays, business men might
prefer Private or Hotel rooms most and student might go with economically cheaper option of
staying in shared rooms( Lee et al 2015). To find out about the core clientele and their
economic class price of rooms checked in can be collected and it can offer interesting
information regarding a business’s clientele.
The objective of the report is to glean insights from the data provided about the
business and make the management make key business decisions.
Section 2:
Proportion of different types of rooms in Airbnb:
Room Type
Frequen
cy
Proporti
on
Entire
home/apt 6103 61.03%
Hotel room 111 1.11%
Private room 3575 35.75%
Secure Best Marks with AI Grader
Need help grading? Try our AI Grader for instant feedback on your assignments.

5
Statistic And Data Analysis
Shared room 211 2.11%
Grand
Total 10000 100.00%
Thus from the sample, it can be seen that the proportion of private room is 35.75 %.
GRAPHICAL DISPLAY OF DIFFERENT TYPES ROOM FOR AIRBNB ROOMS.
For a 95% CI the z value is 1.96.
Sample size (n) = 10000
Sample proportion = 0.3575
Standard Error (SE) = √ .3575 ( 1−.3575 )
10000
Critical value = 1.96
Therefore, CI = .3575 ±1.96∗
√ .3575 ( 1−.3575 )
10000

6
Statistic And Data Analysis
= .3575 ± .005
= (.3525, .3625)
As 40% falls outside the range of the confidence interval it can be said that 40% is not a
plausible value for the proportion of private rooms in Airbnb.
Section 3:
Summary statistics after one iteration of outlier removal:
Summary Statistics
Statistics Private room Overall
Sample Size 3380 3380
Mean 72.252 72.252
Standard Deviation 28.076 28.076
Minimum 20 20
Ql 49 49.00
Media.n 65 55.00
Q3 89 89
Maximum 164 164

7
Statistic And Data Analysis
Graphical display of the distribution of the price of private rooms after one iteration of the
outlier removal:
To test the research hypothesis, let the null hypothesis be that price of private rooms after
outlier removal is less than 70$.
Sample size (n) = 3380
Sample mean (x) = 72.252
Sample standard deviation (s) = 28.076
α =0.05
H0 : μ≤ 70
Ha : μ>70
Test statistic:
72.252−70
( 28.076
√ 3380 ) = 2.252
0.48 = 4.69
Paraphrase This Document
Need a fresh take? Get an instant paraphrase of this document with our AI Paraphraser

8
Statistic And Data Analysis
The p-value is < .00001.
Therefore the result is significant at 0.05 significance level and it can be concluded that mean
price of the private rooms is greater than 70 $.
Section 4:
Statistics Entire Private Shared Hotel Overall
home/apt room room room
Sample size 16103 3575 211 111 10000
Mean 97.442 93.974 117.336 188.252 97.630
Standard 120.44 128.3845 136.097 120.997 124.09
Deviation
Minimum 0 0 0 0 0
Q1 0.00 0.00 0.00 96.5 0
Median 40 11 84.001 152 32
170.00 169.00 188.00 322.5 173
Maximum 365 365 365 365 365
Fig 4.1: Descriptive statistics for availability of different rooms in the next 365 days.

9
Statistic And Data Analysis
Fig 4.2 Side by side boxplot for availability of different types of room in the next 365
days.
To test if there is a difference in availability in different types of room one way Anova
is used in excel.
The null hypothesis is that there is no difference between the availability of rooms for
different room types. The alternative hypothesis is that there is a significant difference
between the groups for availability of rooms in the next 365 days.
Anova: Single Factor
SUMMARY
Groups Count Sum Average
Varianc
e
Entire
Room/Apt 6103
59468
6
97.4415
9
14505.8
9
Hotel Room 111 20896
188.252
3
14640.1
9
Private room 3575
33595
8
93.9742
7
16483.0
8
Shared room 211 24758
117.336
5 18522.4
ANOVA
Source of
Variation SS df MS F
P-
value F crit
Between
Groups 1041511 3
347170.
3
22.6928
3
1.23E-
14
2.60579
7
Within Groups
1.53E+0
8 9996
15298.6
8
Total
1.54E+0
8 9999
From the Anova table it is clear that the p value is much less than the significance
level 0.05 and it can be concluded there is significant difference between the different types
of room for availability of rooms in the next 365 days.

10
Statistic And Data Analysis
Section 5:
Coefficients
Intercept -82115.77769
longitude 544.4259715
From the Anova table it can be seen that the regression equation can be written in terms of
longitude as y=544.43 x−82115.78 .
Regression Statistics
Multiple R
0.14708469
6
R Square
0.02163390
8
Adjusted R
Square
0.02153605
2
Standard
Error
328.604989
2
Observation
s 10000
ANOVA
df SS MS F
Significanc
e F
Regression 1
23872341.5
9
2387234
2
221.078
6 1.77E-49
Residual 9998 1079596427 107981.2
Total 9999 1103468769
Coefficients
Standard
Error t Stat P-value Lower 95%
Upper
95%
Lower
95.0%
Upper
95.0%
Intercept
-
82115.7776
9
5536.26003
1 -14.8324
3.02E-
49 -92968 -71263.6 -92968 -71263.6
longitude
544.425971
5
36.6155428
9 14.86871
1.77E-
49 472.6521
616.199
8
472.652
1
616.199
8
From the Regression output table it can be seen that coefficient of correlation for the
regression model is 0.14 and it suggests that there is a weak positive correlation between the
two variables.
Secure Best Marks with AI Grader
Need help grading? Try our AI Grader for instant feedback on your assignments.

11
Statistic And Data Analysis
Fig 5: Scatter plot between longitude (on the x axis) and price (on the y axis)
From the regression output table the coefficient of determination ( R squared value )
is 0.0216. Therefore it means that only 2.16% of the variation in price can be explained by
the variation in longitude.
Thus it can be concluded that it is not possible to predict the price of a room just by
using the longitude of the property.
Section 6:
Let the null hypothesis be that there is a relation between gender and room type
accommodation. Therefore the alternative hypothesis is that there is no relation between
gender and room type accommodation.
Frequency Room types
Gender Female
Mal
e
Grand
Total
Entire
home/apt 3 1 4
Hotel room 3 2 5
Private room 6 6 12
shared room 4 5 9
Grand Total 16 14 30

12
Statistic And Data Analysis
Table showing the distribution of gender and the type of room used for accommodation.
Entire home/apt Hotel room Private room shared room
0
2
4
6
8
10
12
14
Stacked Bar Chart for Gender Vs Room Type
Male
Female
Room Type
Gender
Fig 6: A stacked bar chart showing the distribution of male and female gender by the
type of rooms they choose to live in.
To check whether the distribution for the two genders occupying different types of
rooms is different or not a chi squared statistic is performed.
The expected values of the distribution are calculated:
Expected Values:
Female Male
Entire
home/apt
2.13333
3
1.86666
7
Hotel room
2.66666
7
2.33333
3
Private room 6.4 5.6
shared room 4.8 4.2
The chi square test statistic is found to be 0.76.
Degrees of freedom: (4-1)*(2-1) = 3.

13
Statistic And Data Analysis
From the chi square distribution table, the P-Value is .86 which is not significant at
α=0.05 .
Thus, it can be concluded that there is no relation between gender and room type
accommodation.
Section 7:
Conclusion:
Thus our data exploration and inferences about the business dealings of Airbnb comes
to an end and the insights gained from the data analysis will hopefully help the management
make informed decisions about the company’s future decisions.
It was seen that out of the different types of rooms, Entire home/ Apartments are the
most in demand and shared rooms have relatively low demand. The private rooms that are
booked have an average cost of 73$ after removing the outlier prices. It was also seen that for
the four different types of rooms there is a significant difference between the availability of
the rooms in a single year. A weak correlation was seen between longitude and price and
suggested some other variable must be taken for a successful prediction. It was finally
noticed that different genders have no association with preference of room type.
Further research can be taken along other lines to gain more insights about the nature
of the business. For example to predict the price of a room a regression analysis can be done
taking into account the number of bedrooms and bathrooms. Also the price distribution of
rooms booked for the different room types can be calculated to get an idea of the economic
class of its clientele, and therefore the overall picture of the target demographic for the
business.
Paraphrase This Document
Need a fresh take? Get an instant paraphrase of this document with our AI Paraphraser

14
Statistic And Data Analysis
References:
Black, K.U., 2019. Business statistics: for contemporary decision making. Wiley.
Fry, G.S., 2019. Business statistics a decision-making approach. Pearson Education Limited.
Lee, D., Hyun, W., Ryu, J., Lee, W.J., Rhee, W. and Suh, B., 2015, February. An analysis of
social features associated with room sales of Airbnb. In Proceedings of the 18th ACM
Conference Companion on Computer Supported Cooperative Work & Social Computing (pp.
219-222). ACM.
Lowry, R., 2014. Concepts and applications of inferential statistics.
Pyrczak, F., 2016. Making sense of statistics: A conceptual overview. Routledge.
Siegel, A., 2016. Practical business statistics. Academic Press.
Trafimow, D. and MacDonald, J.A., 2017. Performing inferential statistics prior to data
collection. Educational and psychological measurement, 77(2), pp.204-219.
1 out of 14

Your All-in-One AI-Powered Toolkit for Academic Success.
+13062052269
info@desklib.com
Available 24*7 on WhatsApp / Email
Unlock your academic potential
© 2024 | Zucol Services PVT LTD | All rights reserved.