Finance Report: Analysis of Airline Companies' Financial Ratios
VerifiedAdded on 2020/10/22
|23
|4160
|122
Report
AI Summary
This report provides a comprehensive financial analysis of three airline companies: Ryanair, Flybe, and Easyjet. It begins with an introduction to finance and its core concepts, followed by a detailed ratio analysis of each company's performance over a three-year period. The analysis covers key financial ratios, including current ratio, shareholders' liquidity ratio, gearing ratio, net assets turnover ratio, net profit margin ratio, stock turnover ratio, return on equity, interest coverage ratio, and solvency ratio. The report highlights the strengths and weaknesses of each company based on these ratios, providing insights into their financial health and investment potential. The report includes calculations and interpretations of these ratios, offering a comparative perspective on the companies' financial positions. The report also considers the financial performance of each company for investment purposes. The report concludes with a summary of the findings and a list of references.

FINANCE
Paraphrase This Document
Need a fresh take? Get an instant paraphrase of this document with our AI Paraphraser
Table of Contents
INTRODUCTION...........................................................................................................................1
TASK 1............................................................................................................................................1
TASK 2 .......................................................................................................................................12
CONCLUSION..............................................................................................................................15
REFERENCES..............................................................................................................................16
INTRODUCTION
Finance is defined as the management of money and it consist of different business
activities such as investing, borrowing, budgeting, lending, saving and forecasting (Antras and
Foley, 2015) . It is a broadly term which is defined the study and system of money, investments
and other financial instruments. It can categorise in three part such as personal finance, public
finance and corporate finance. The basic concepts of finance come from micro and macro
economic theories. It includes the over sight, creation and study of money, assets and liabilities,
investment, credit after that prepare financial statements. In the report consist of 3 companies
which are Ryanair holdings public limited company, Flybe group plc and Easyjet plc. There are
calculating ratios of 3 years and show which company performance is good as investment
perspective and which one has poor. In section second, prepare a memo on investment appraisal
in the context of decision making process.
TASK 1
Ratio Analysis
Ratio Analysis is a form of financial statement analysis which can use to show quick
indication in reference to performance of firm in various key areas. The ration will be divided as
per short term solvency, efficiency ratio and investments ratio. Most of the companies apply ratio
analysis instead of absolute figures because it can provide performance of a company.
Strength – There are mentioned strength of the ratio analysis -
It can help to validate the operating, financing and investing decision of the company. With the help of ratio analysis company identify all problems and carry out attention of
the management in specific areas.
Weakness – If ratio analysis have strength so there are is weakness which are -
The ratio analysis can ignore the price level due to changes in inflation and over look in
price level between periods.
Financial ratio can not sort out any problem related to financial problems and they have
mean to the end, not the actual solution.
Current Ratio – Current ratio is part of financial ratio which can show how much
liquidity in the company to pay out their debts regarding to short terms. From the financial report
it has been analysed that from 2016 to 2018 Ryanair has facing problems and up down coming in
1
⊘ This is a preview!⊘
Do you want full access?
Subscribe today to unlock all pages.
Trusted by 1+ million students worldwide
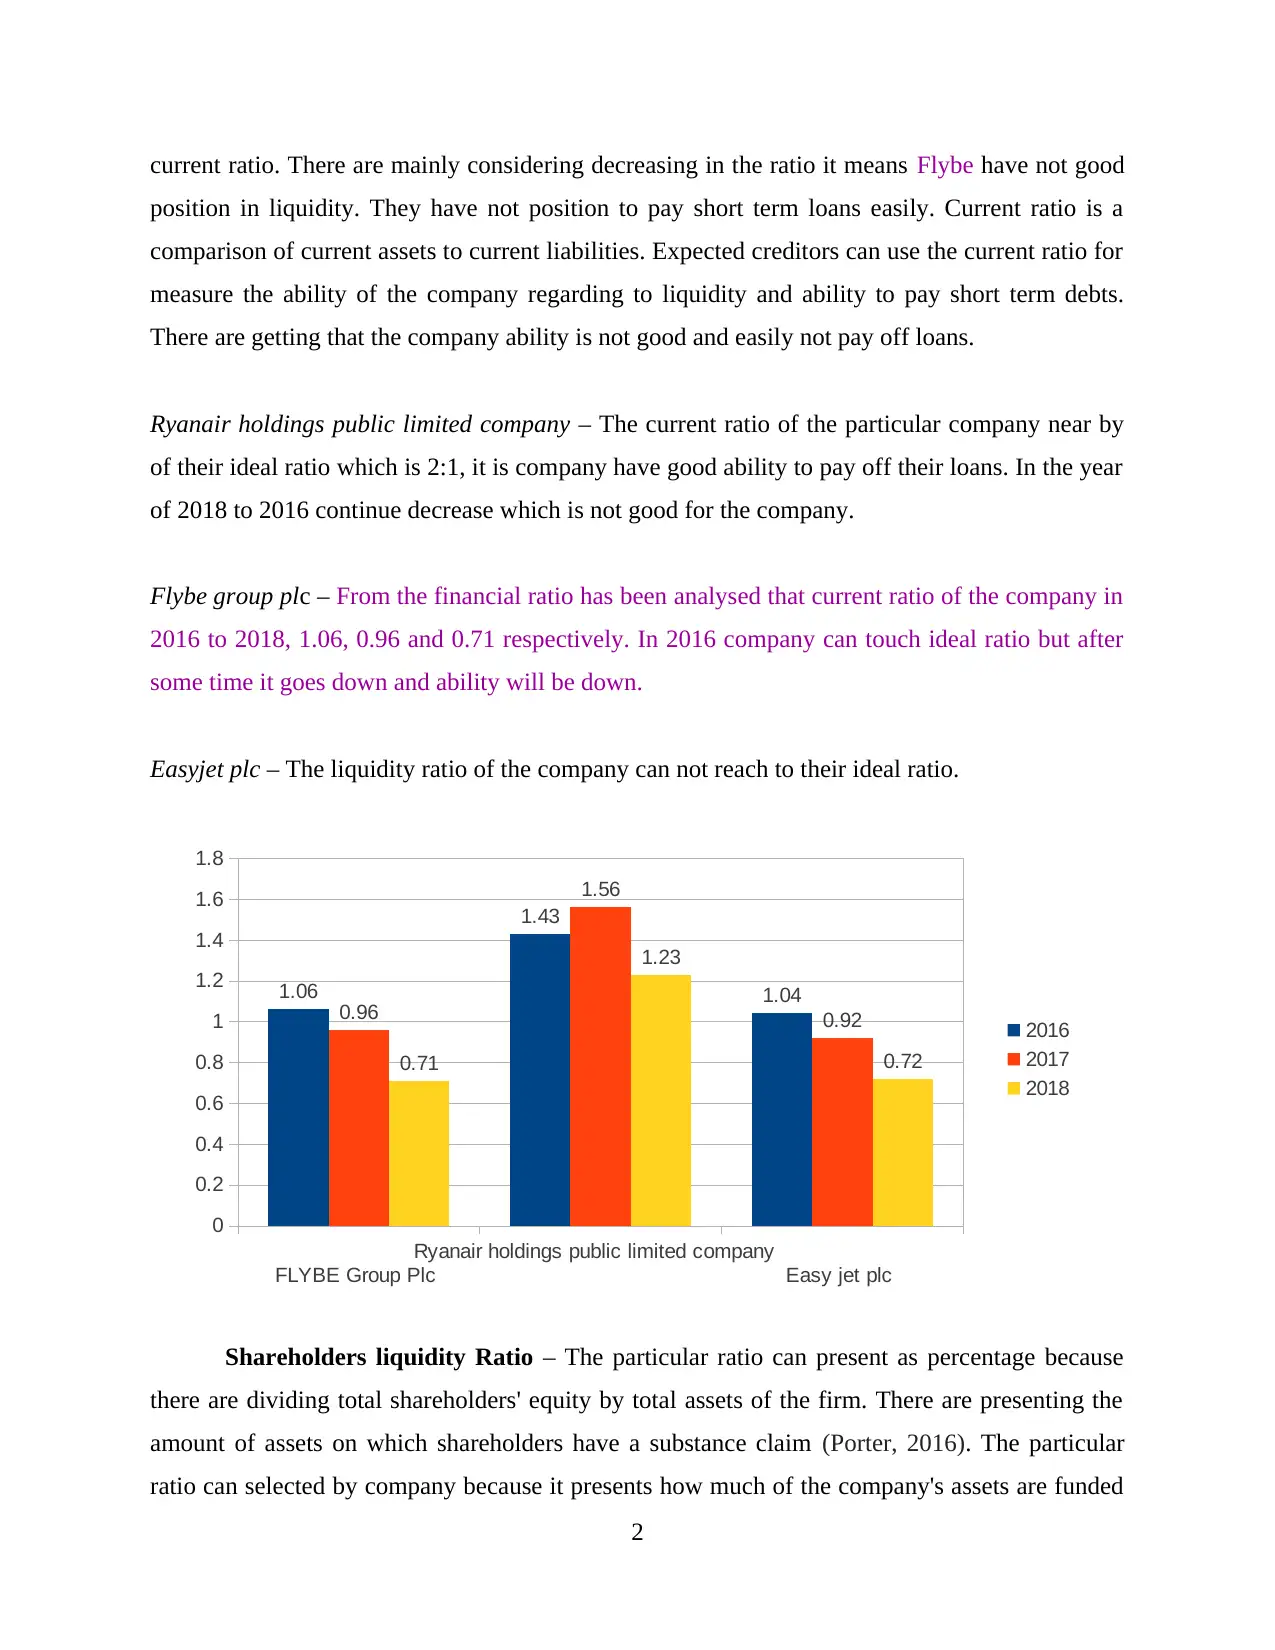
current ratio. There are mainly considering decreasing in the ratio it means Flybe have not good
position in liquidity. They have not position to pay short term loans easily. Current ratio is a
comparison of current assets to current liabilities. Expected creditors can use the current ratio for
measure the ability of the company regarding to liquidity and ability to pay short term debts.
There are getting that the company ability is not good and easily not pay off loans.
Ryanair holdings public limited company – The current ratio of the particular company near by
of their ideal ratio which is 2:1, it is company have good ability to pay off their loans. In the year
of 2018 to 2016 continue decrease which is not good for the company.
Flybe group plc – From the financial ratio has been analysed that current ratio of the company in
2016 to 2018, 1.06, 0.96 and 0.71 respectively. In 2016 company can touch ideal ratio but after
some time it goes down and ability will be down.
Easyjet plc – The liquidity ratio of the company can not reach to their ideal ratio.
FLYBE Group Plc
Ryanair holdings public limited company
Easy jet plc
0
0.2
0.4
0.6
0.8
1
1.2
1.4
1.6
1.8
1.06
1.43
1.04
0.96
1.56
0.92
0.71
1.23
0.72
2016
2017
2018
Shareholders liquidity Ratio – The particular ratio can present as percentage because
there are dividing total shareholders' equity by total assets of the firm. There are presenting the
amount of assets on which shareholders have a substance claim (Porter, 2016). The particular
ratio can selected by company because it presents how much of the company's assets are funded
2
Paraphrase This Document
Need a fresh take? Get an instant paraphrase of this document with our AI Paraphraser
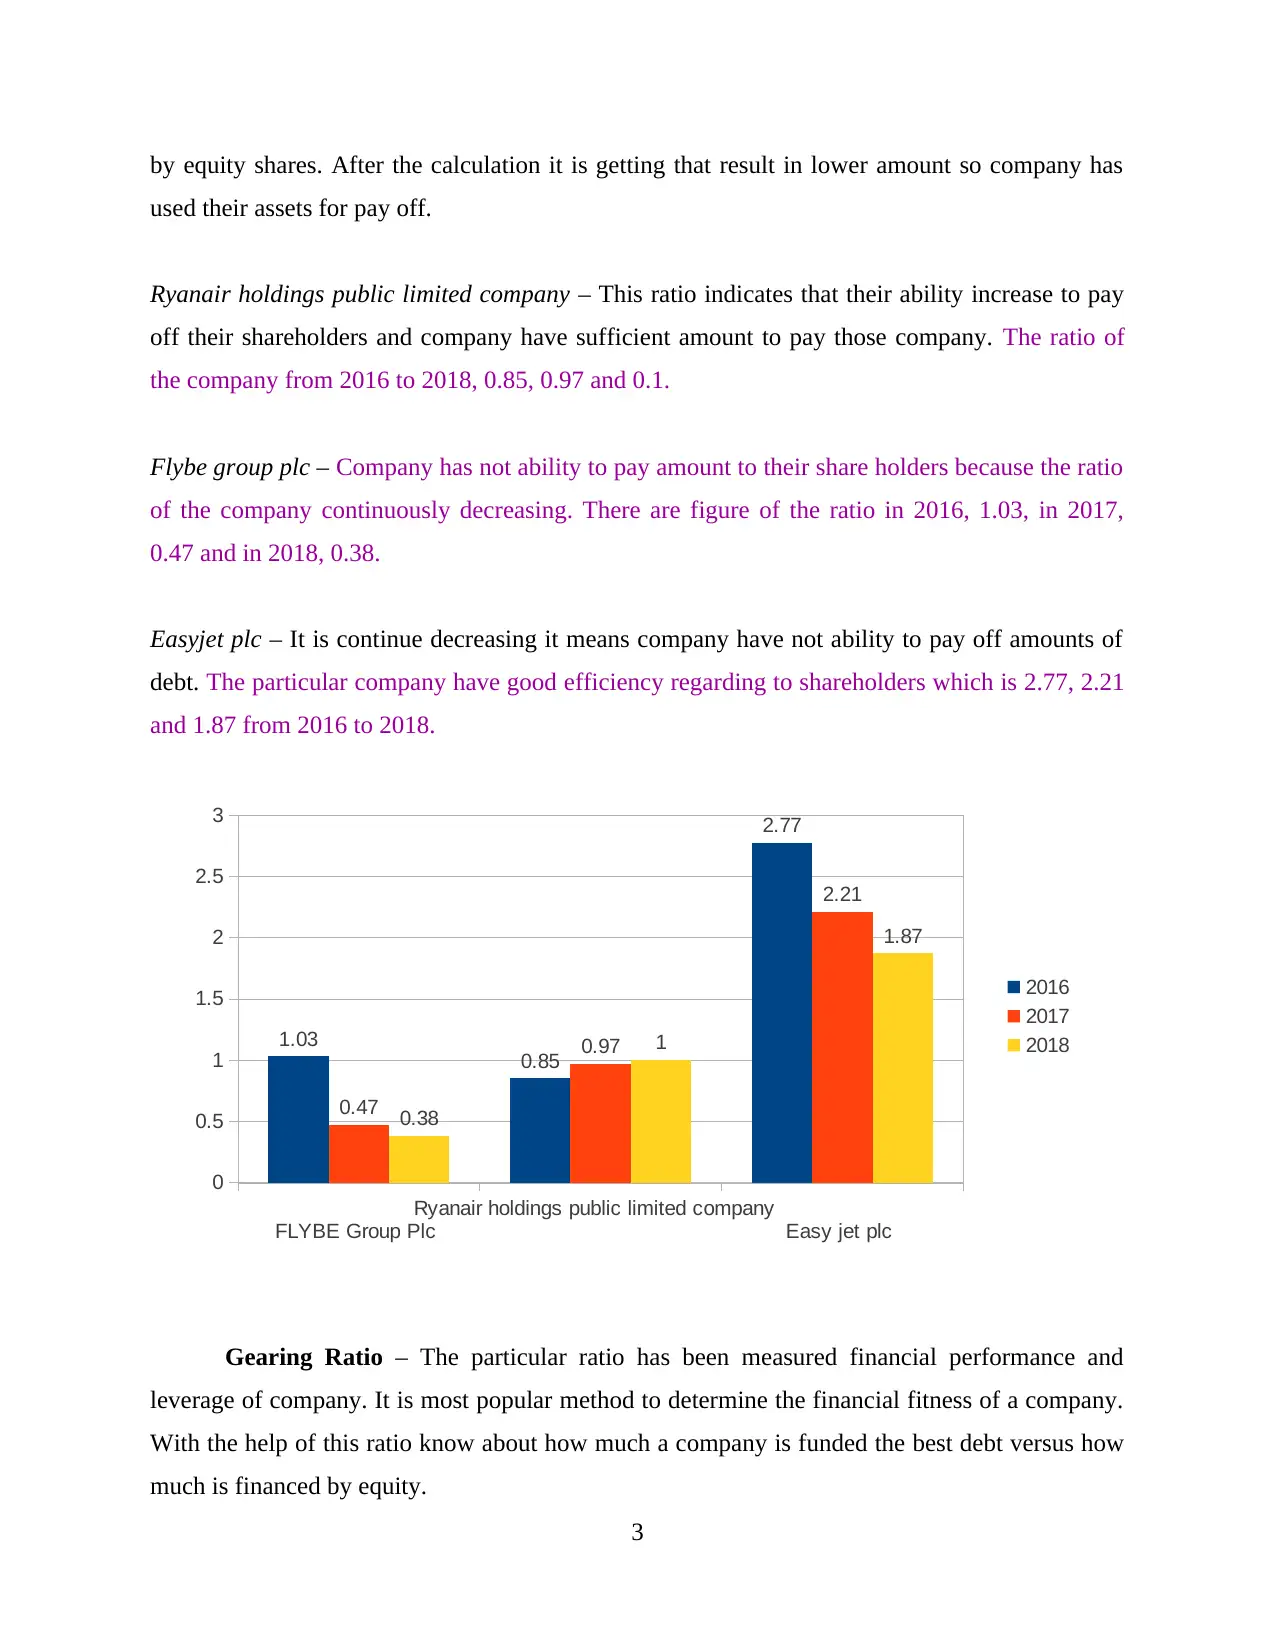
by equity shares. After the calculation it is getting that result in lower amount so company has
used their assets for pay off.
Ryanair holdings public limited company – This ratio indicates that their ability increase to pay
off their shareholders and company have sufficient amount to pay those company. The ratio of
the company from 2016 to 2018, 0.85, 0.97 and 0.1.
Flybe group plc – Company has not ability to pay amount to their share holders because the ratio
of the company continuously decreasing. There are figure of the ratio in 2016, 1.03, in 2017,
0.47 and in 2018, 0.38.
Easyjet plc – It is continue decreasing it means company have not ability to pay off amounts of
debt. The particular company have good efficiency regarding to shareholders which is 2.77, 2.21
and 1.87 from 2016 to 2018.
FLYBE Group Plc
Ryanair holdings public limited company
Easy jet plc
0
0.5
1
1.5
2
2.5
3
1.03
0.85
2.77
0.47
0.97
2.21
0.38
1
1.87
2016
2017
2018
Gearing Ratio – The particular ratio has been measured financial performance and
leverage of company. It is most popular method to determine the financial fitness of a company.
With the help of this ratio know about how much a company is funded the best debt versus how
much is financed by equity.
3
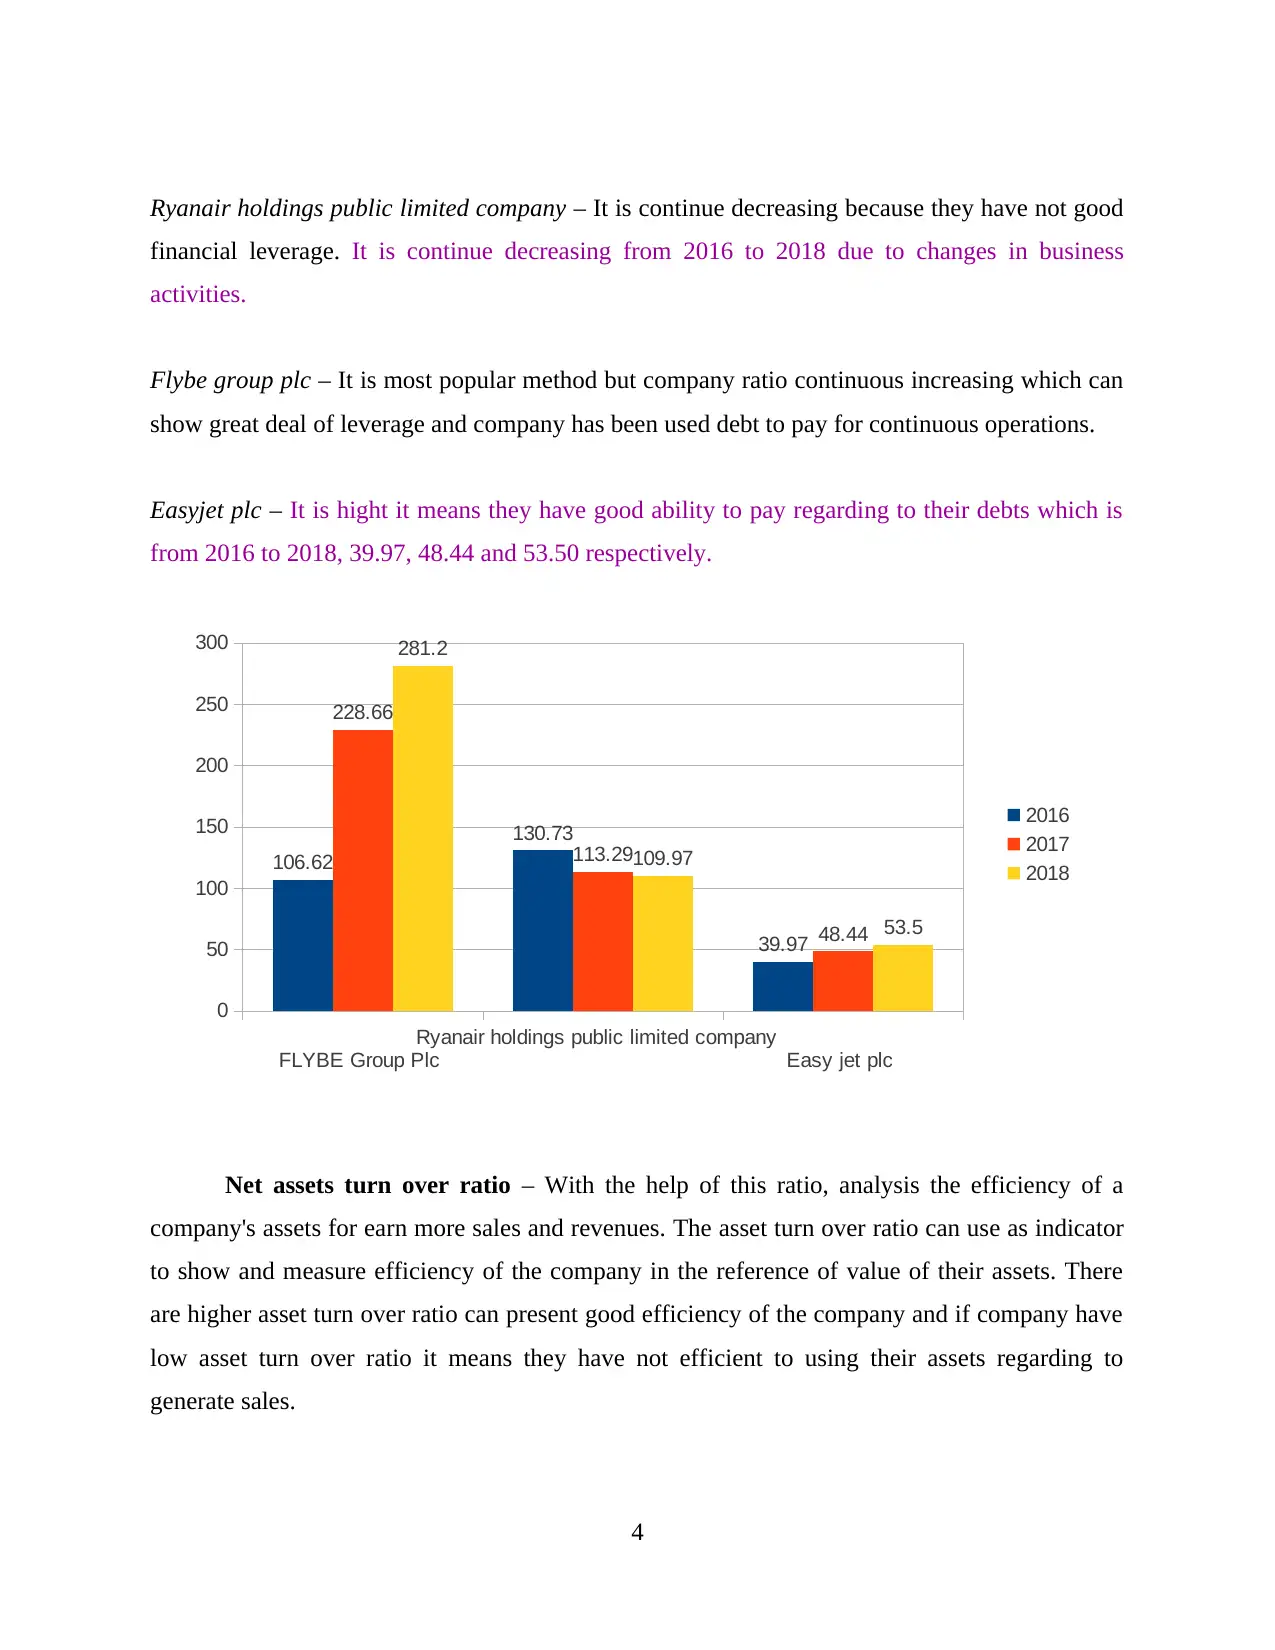
Ryanair holdings public limited company – It is continue decreasing because they have not good
financial leverage. It is continue decreasing from 2016 to 2018 due to changes in business
activities.
Flybe group plc – It is most popular method but company ratio continuous increasing which can
show great deal of leverage and company has been used debt to pay for continuous operations.
Easyjet plc – It is hight it means they have good ability to pay regarding to their debts which is
from 2016 to 2018, 39.97, 48.44 and 53.50 respectively.
FLYBE Group Plc
Ryanair holdings public limited company
Easy jet plc
0
50
100
150
200
250
300
106.62
130.73
39.97
228.66
113.29
48.44
281.2
109.97
53.5
2016
2017
2018
Net assets turn over ratio – With the help of this ratio, analysis the efficiency of a
company's assets for earn more sales and revenues. The asset turn over ratio can use as indicator
to show and measure efficiency of the company in the reference of value of their assets. There
are higher asset turn over ratio can present good efficiency of the company and if company have
low asset turn over ratio it means they have not efficient to using their assets regarding to
generate sales.
4
⊘ This is a preview!⊘
Do you want full access?
Subscribe today to unlock all pages.
Trusted by 1+ million students worldwide
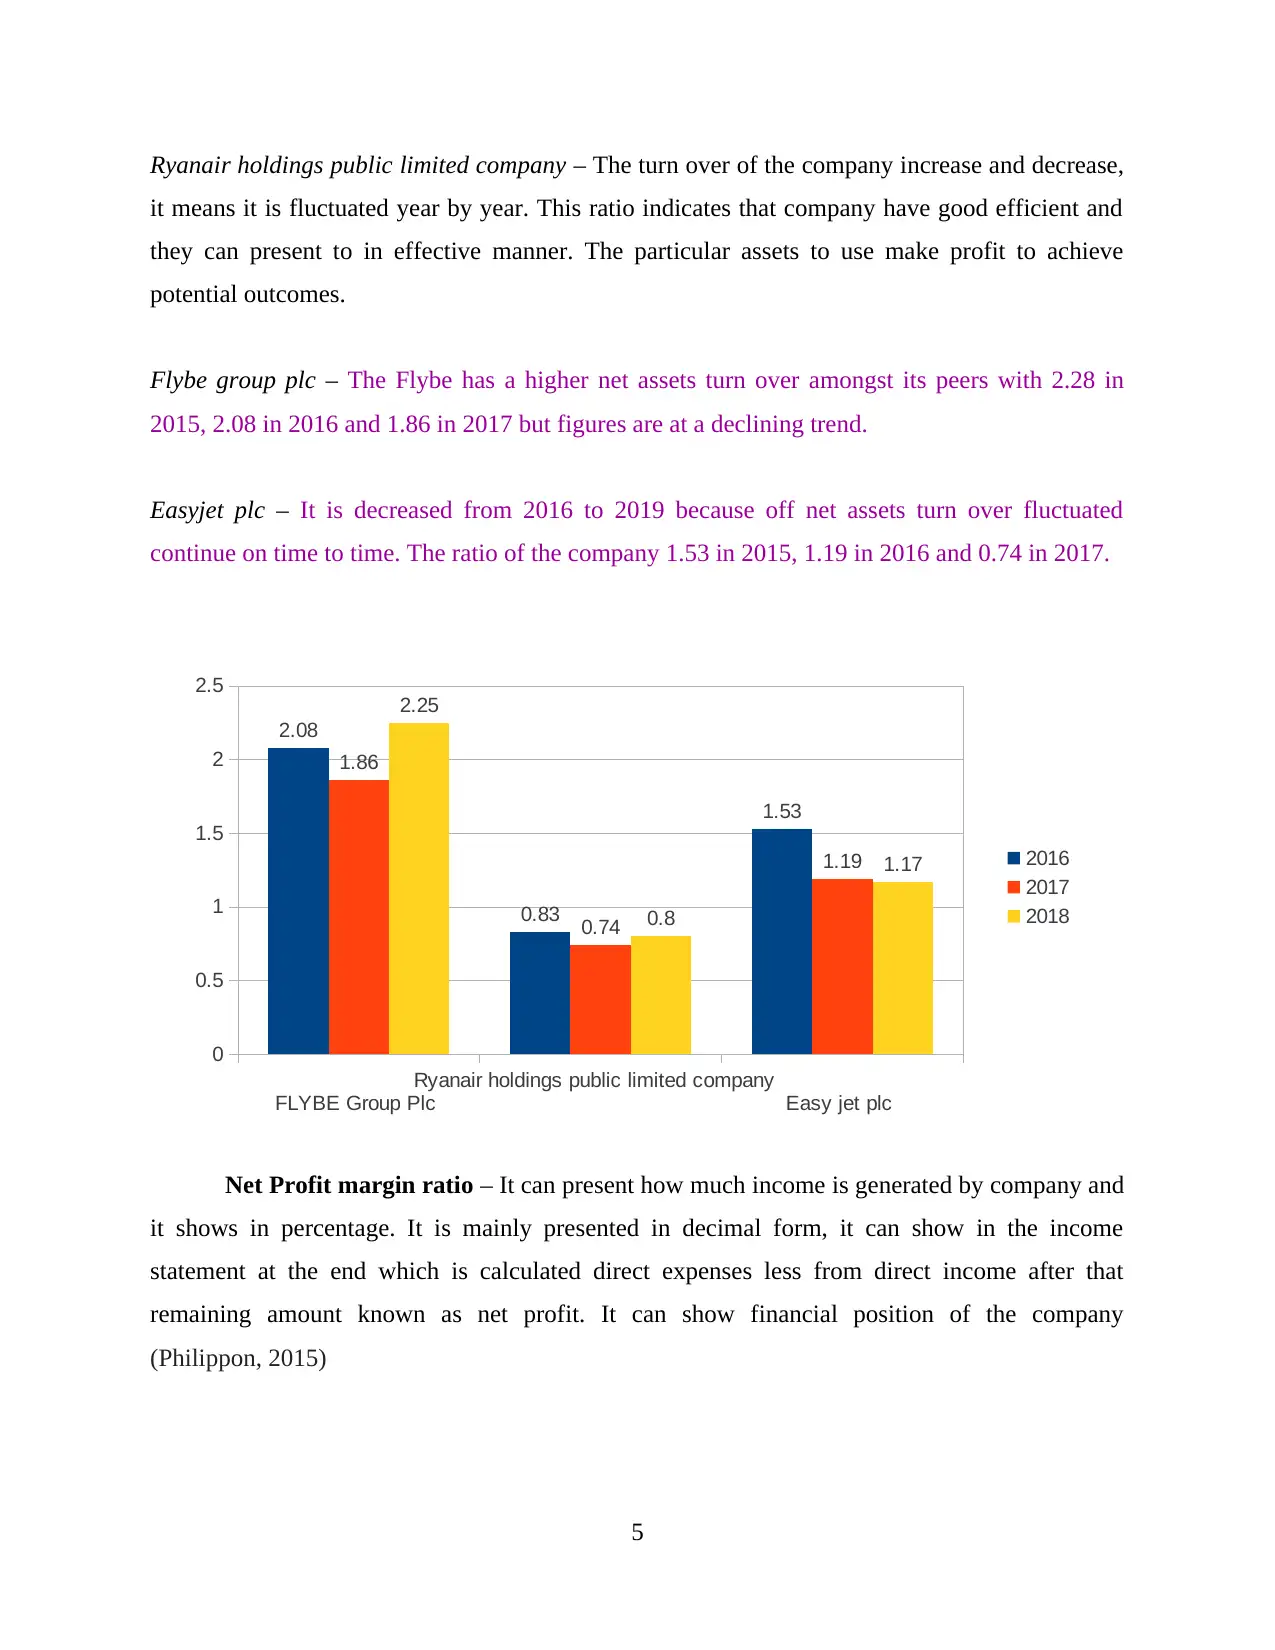
Ryanair holdings public limited company – The turn over of the company increase and decrease,
it means it is fluctuated year by year. This ratio indicates that company have good efficient and
they can present to in effective manner. The particular assets to use make profit to achieve
potential outcomes.
Flybe group plc – The Flybe has a higher net assets turn over amongst its peers with 2.28 in
2015, 2.08 in 2016 and 1.86 in 2017 but figures are at a declining trend.
Easyjet plc – It is decreased from 2016 to 2019 because off net assets turn over fluctuated
continue on time to time. The ratio of the company 1.53 in 2015, 1.19 in 2016 and 0.74 in 2017.
FLYBE Group Plc
Ryanair holdings public limited company
Easy jet plc
0
0.5
1
1.5
2
2.5
2.08
0.83
1.53
1.86
0.74
1.19
2.25
0.8
1.17 2016
2017
2018
Net Profit margin ratio – It can present how much income is generated by company and
it shows in percentage. It is mainly presented in decimal form, it can show in the income
statement at the end which is calculated direct expenses less from direct income after that
remaining amount known as net profit. It can show financial position of the company
(Philippon, 2015)
5
Paraphrase This Document
Need a fresh take? Get an instant paraphrase of this document with our AI Paraphraser
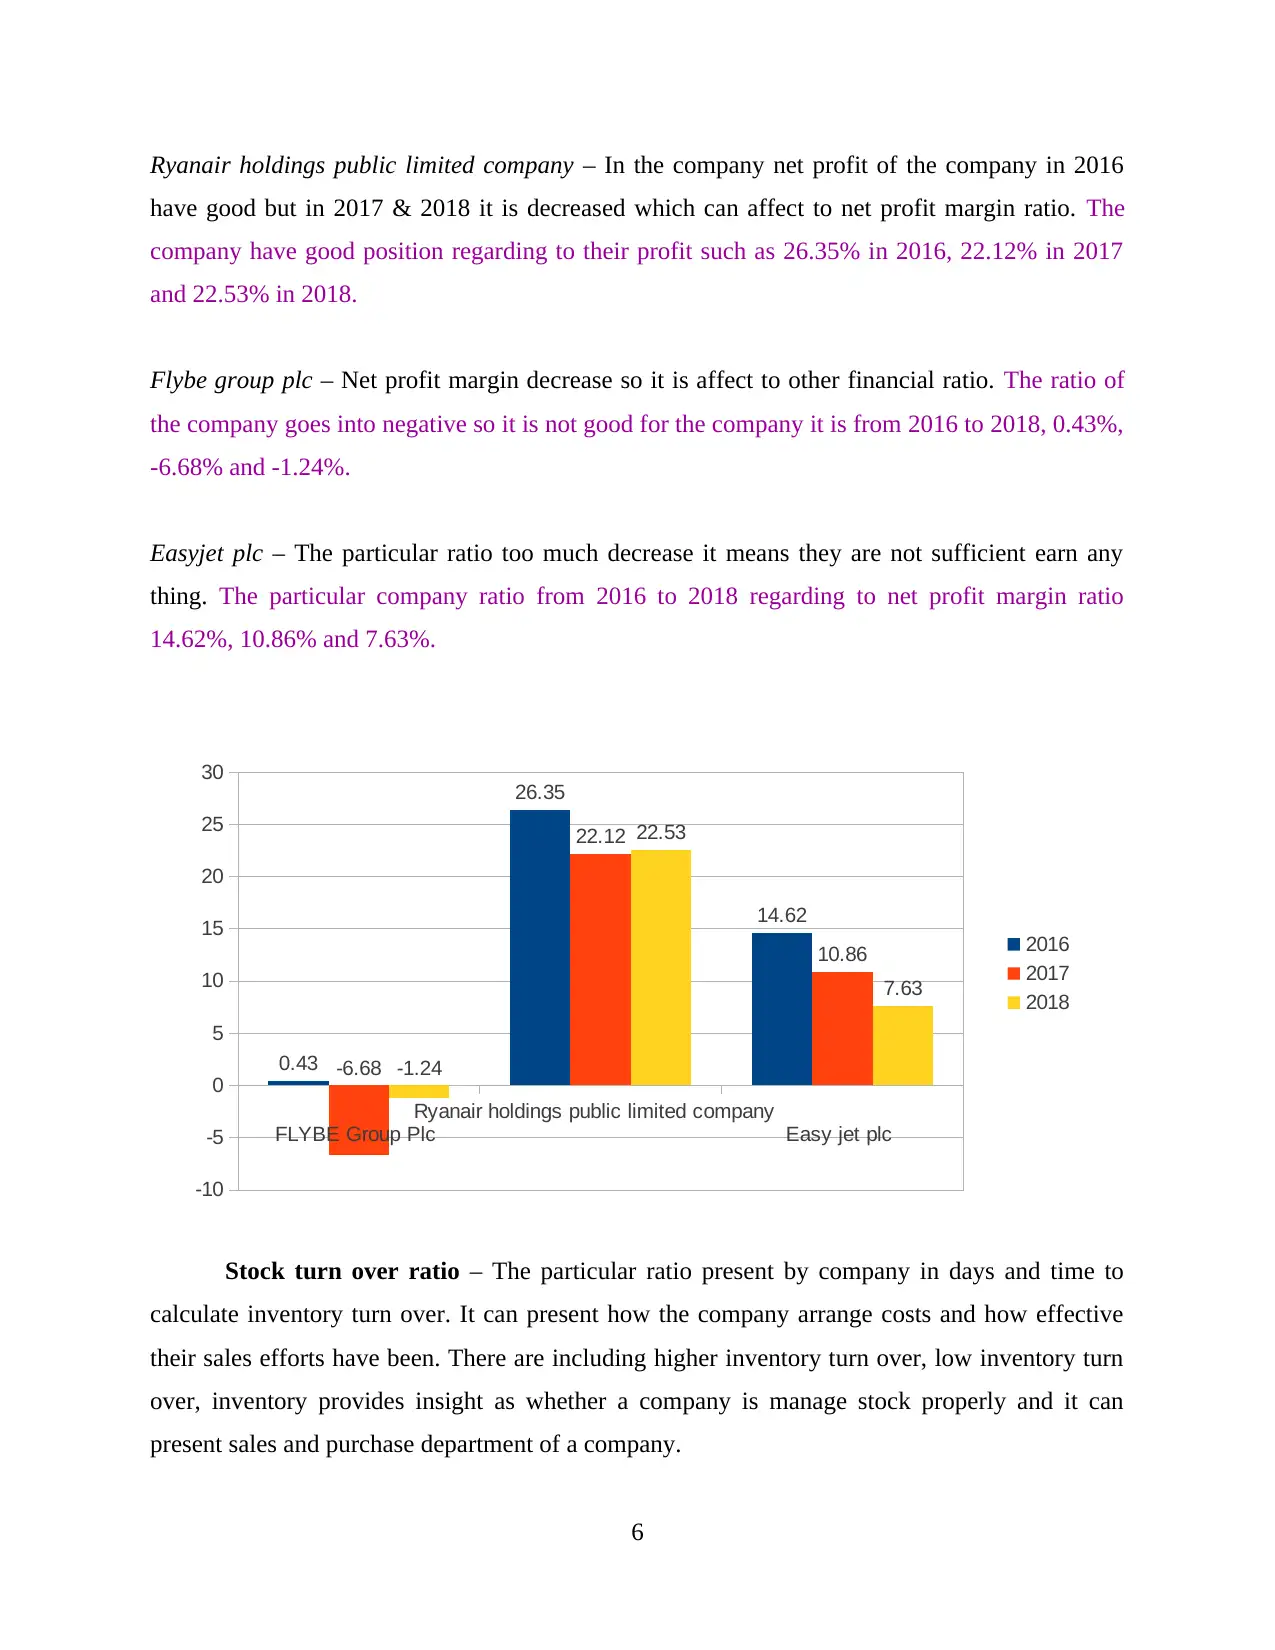
Ryanair holdings public limited company – In the company net profit of the company in 2016
have good but in 2017 & 2018 it is decreased which can affect to net profit margin ratio. The
company have good position regarding to their profit such as 26.35% in 2016, 22.12% in 2017
and 22.53% in 2018.
Flybe group plc – Net profit margin decrease so it is affect to other financial ratio. The ratio of
the company goes into negative so it is not good for the company it is from 2016 to 2018, 0.43%,
-6.68% and -1.24%.
Easyjet plc – The particular ratio too much decrease it means they are not sufficient earn any
thing. The particular company ratio from 2016 to 2018 regarding to net profit margin ratio
14.62%, 10.86% and 7.63%.
FLYBE Group Plc
Ryanair holdings public limited company
Easy jet plc
-10
-5
0
5
10
15
20
25
30
0.43
26.35
14.62
-6.68
22.12
10.86
-1.24
22.53
7.63
2016
2017
2018
Stock turn over ratio – The particular ratio present by company in days and time to
calculate inventory turn over. It can present how the company arrange costs and how effective
their sales efforts have been. There are including higher inventory turn over, low inventory turn
over, inventory provides insight as whether a company is manage stock properly and it can
present sales and purchase department of a company.
6
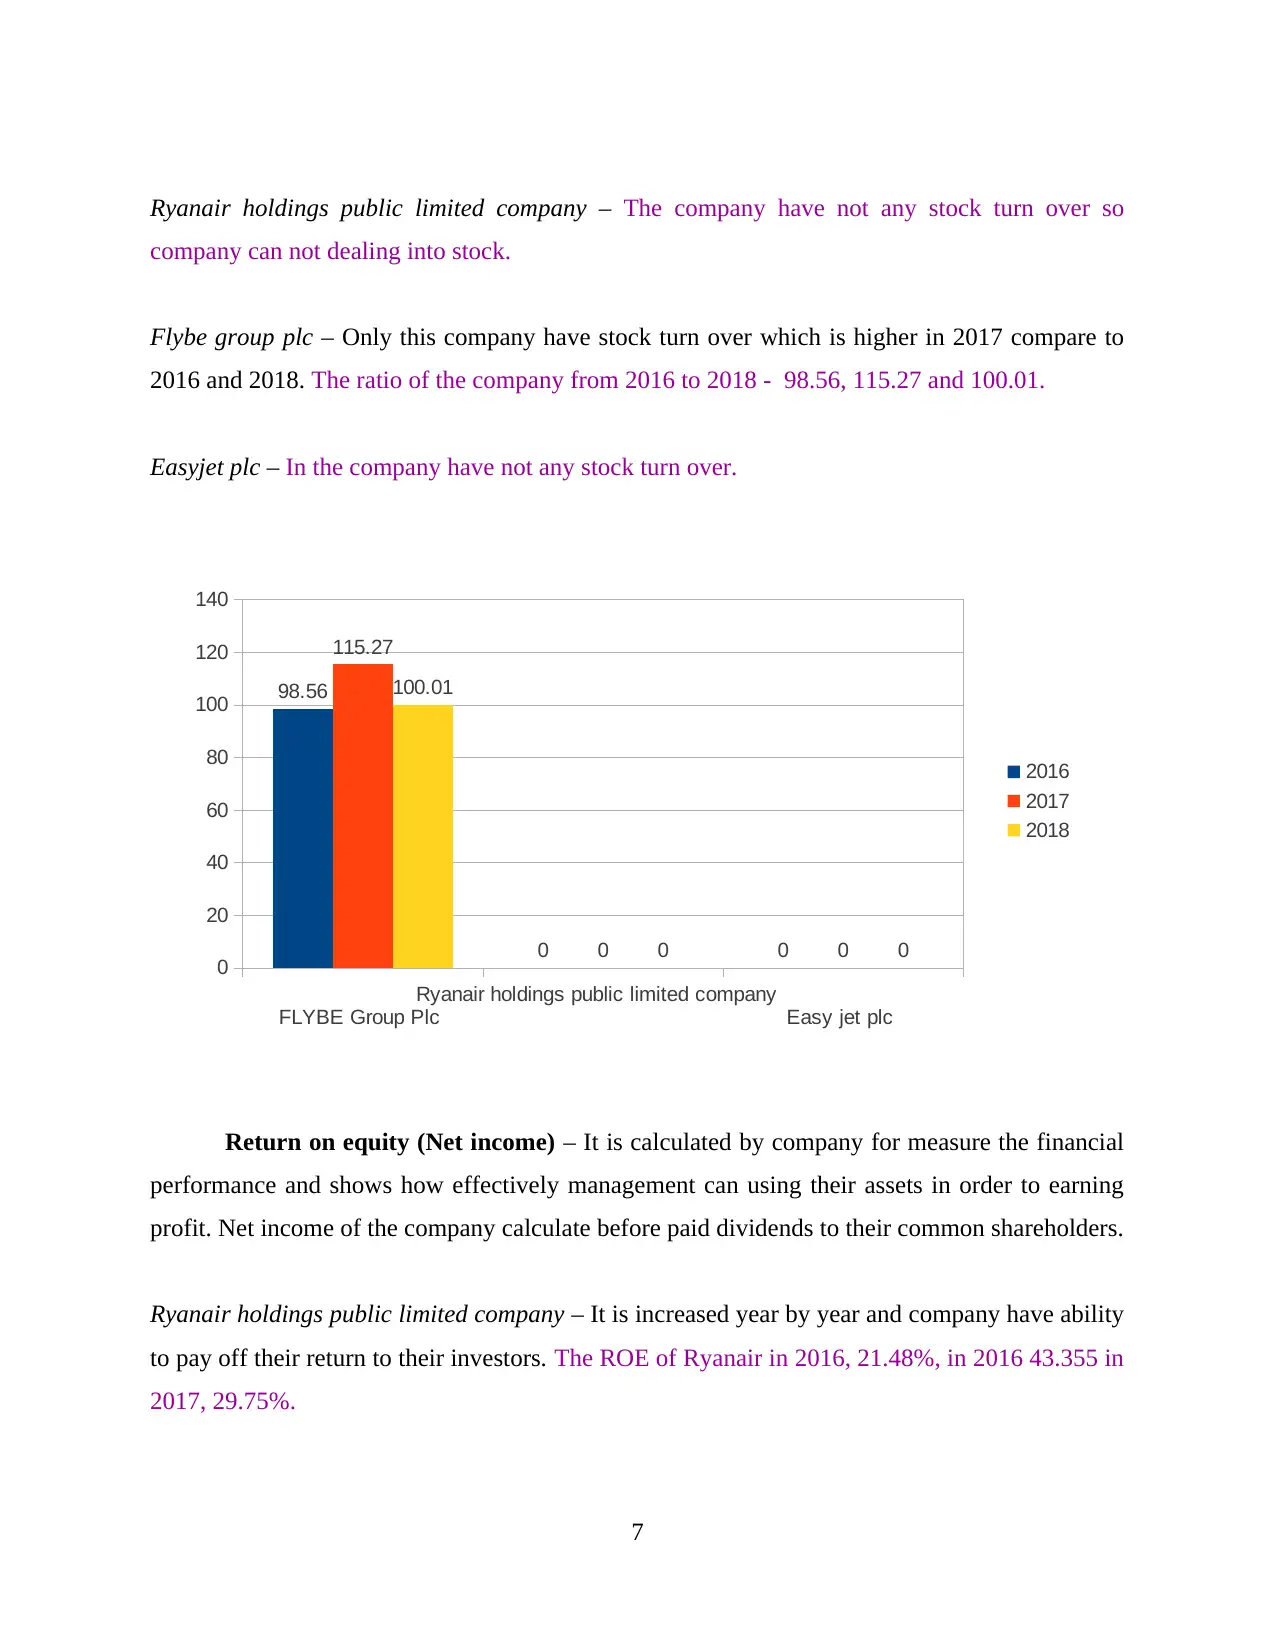
Ryanair holdings public limited company – The company have not any stock turn over so
company can not dealing into stock.
Flybe group plc – Only this company have stock turn over which is higher in 2017 compare to
2016 and 2018. The ratio of the company from 2016 to 2018 - 98.56, 115.27 and 100.01.
Easyjet plc – In the company have not any stock turn over.
FLYBE Group Plc
Ryanair holdings public limited company
Easy jet plc
0
20
40
60
80
100
120
140
98.56
0 0
115.27
0 0
100.01
0 0
2016
2017
2018
Return on equity (Net income) – It is calculated by company for measure the financial
performance and shows how effectively management can using their assets in order to earning
profit. Net income of the company calculate before paid dividends to their common shareholders.
Ryanair holdings public limited company – It is increased year by year and company have ability
to pay off their return to their investors. The ROE of Ryanair in 2016, 21.48%, in 2016 43.355 in
2017, 29.75%.
7
⊘ This is a preview!⊘
Do you want full access?
Subscribe today to unlock all pages.
Trusted by 1+ million students worldwide
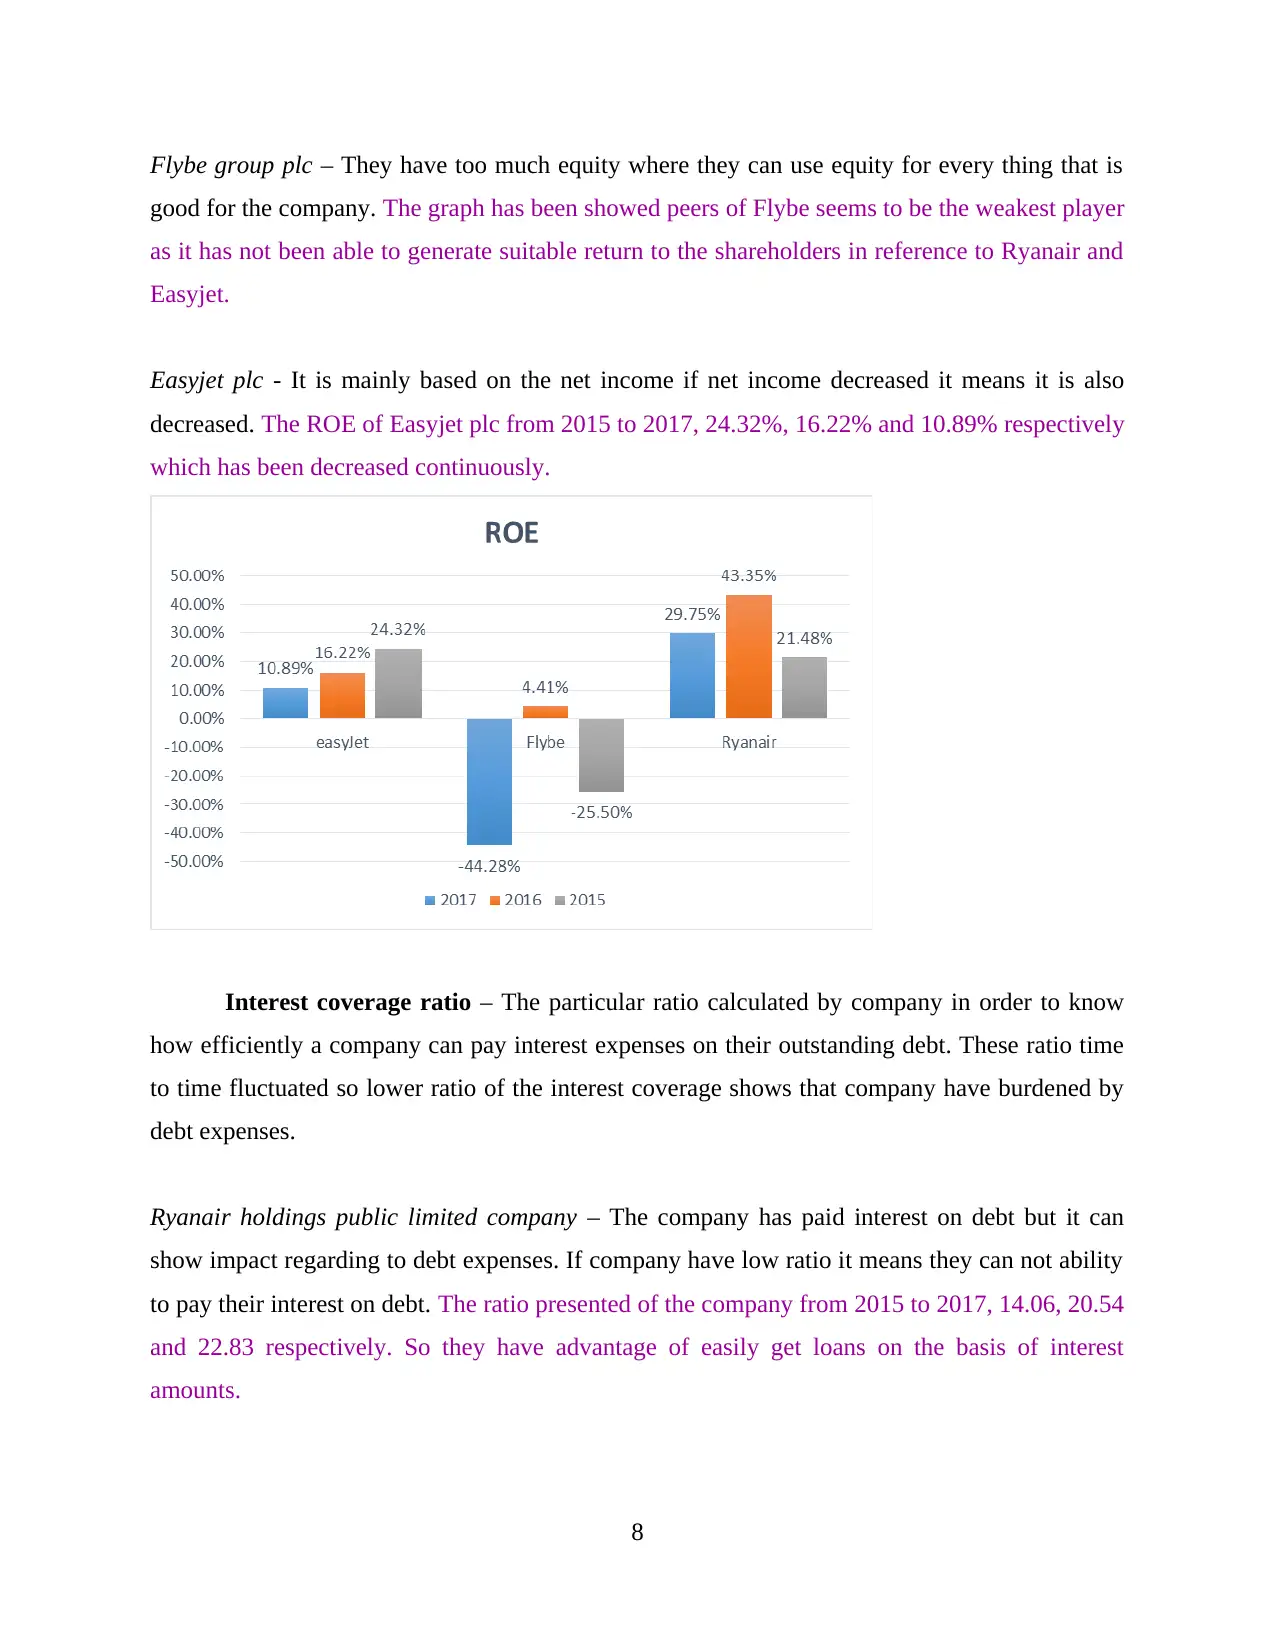
Flybe group plc – They have too much equity where they can use equity for every thing that is
good for the company. The graph has been showed peers of Flybe seems to be the weakest player
as it has not been able to generate suitable return to the shareholders in reference to Ryanair and
Easyjet.
Easyjet plc - It is mainly based on the net income if net income decreased it means it is also
decreased. The ROE of Easyjet plc from 2015 to 2017, 24.32%, 16.22% and 10.89% respectively
which has been decreased continuously.
Interest coverage ratio – The particular ratio calculated by company in order to know
how efficiently a company can pay interest expenses on their outstanding debt. These ratio time
to time fluctuated so lower ratio of the interest coverage shows that company have burdened by
debt expenses.
Ryanair holdings public limited company – The company has paid interest on debt but it can
show impact regarding to debt expenses. If company have low ratio it means they can not ability
to pay their interest on debt. The ratio presented of the company from 2015 to 2017, 14.06, 20.54
and 22.83 respectively. So they have advantage of easily get loans on the basis of interest
amounts.
8
Paraphrase This Document
Need a fresh take? Get an instant paraphrase of this document with our AI Paraphraser
Flybe group plc – The scenario of the particular company has been different because the ratio of
the company has been showed negative figures in 2015 to 2017, -9.33, 1.73 and -10.78. so
lenders have doubt for company regarding to pay off loans.
Easyjet plc – It is fall down continuously that means company have too much ability to pay off
their interest and can not bear debt expenses of a company. There are promising figures of 62.55
in 2015 which is decreased to 39.46 in 2016 and 14.07 in 2017.
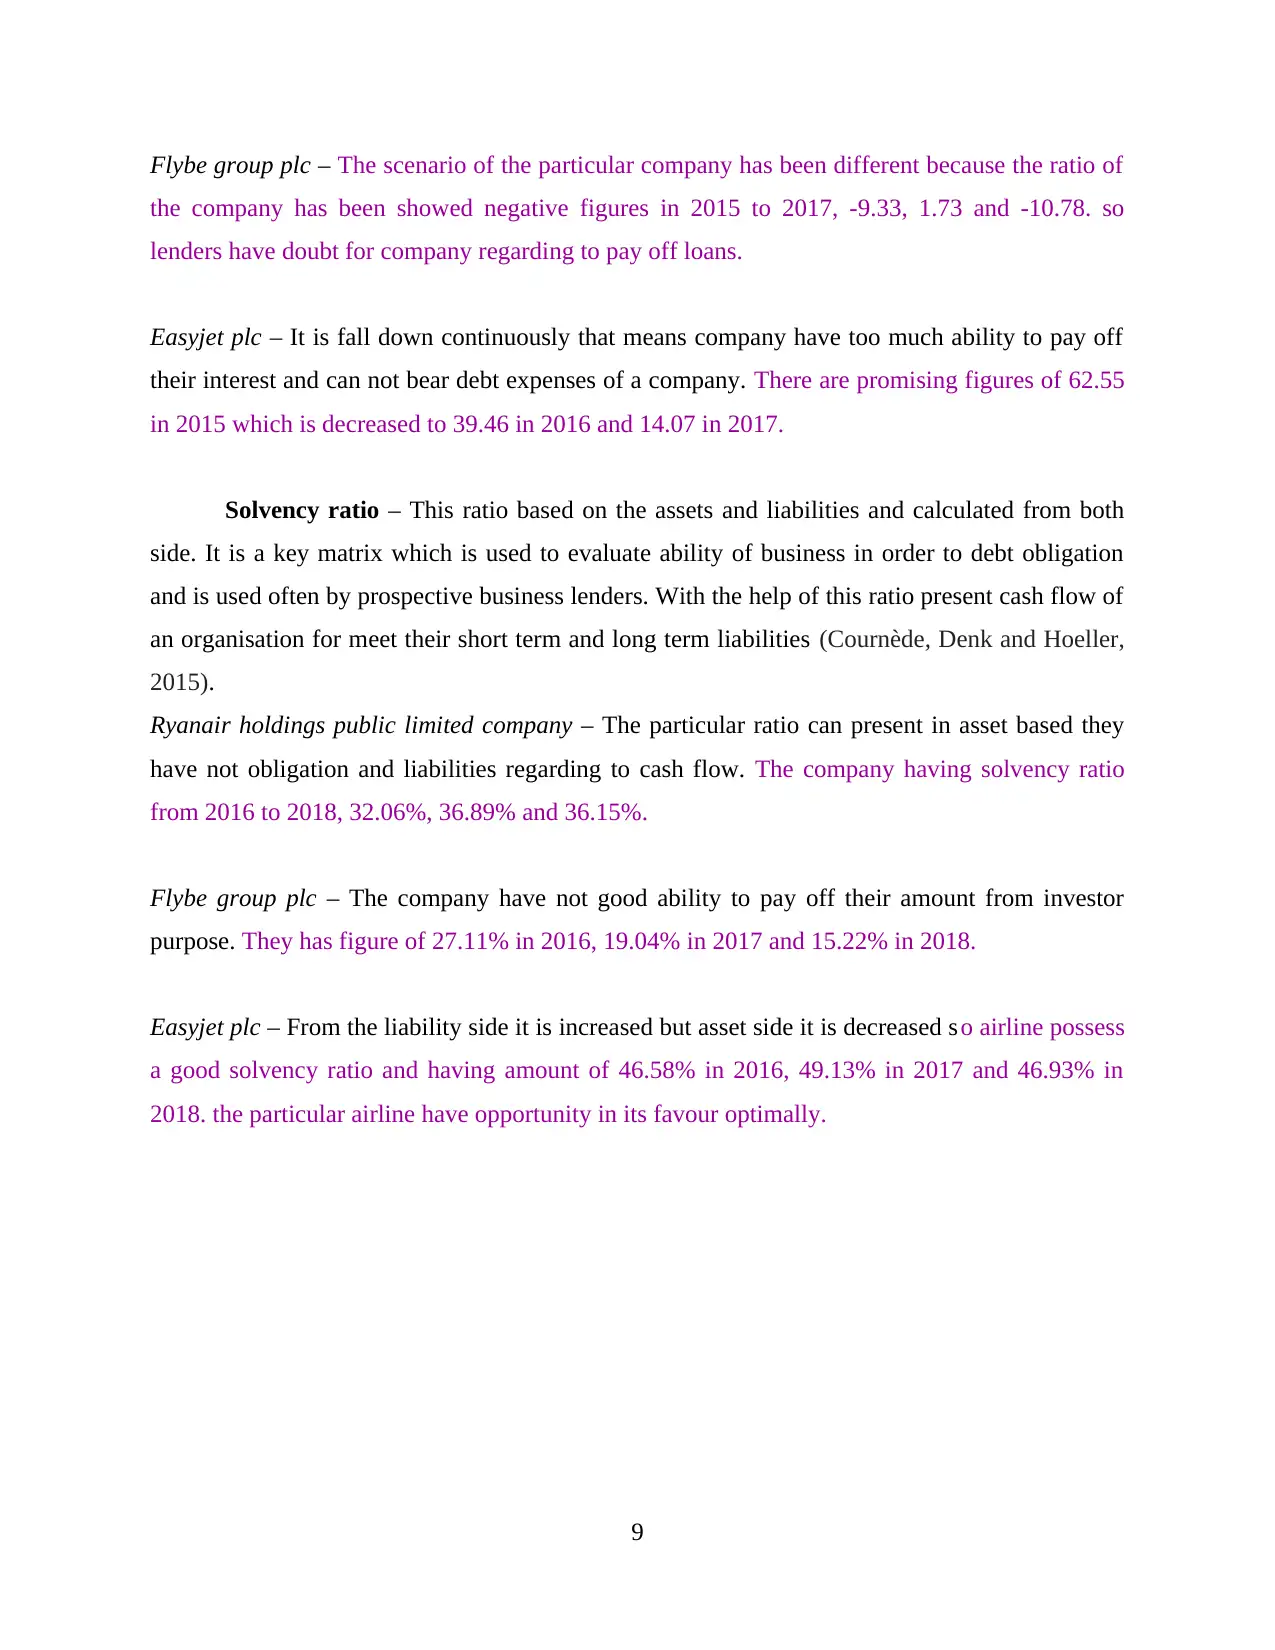
Solvency ratio – This ratio based on the assets and liabilities and calculated from both
side. It is a key matrix which is used to evaluate ability of business in order to debt obligation
and is used often by prospective business lenders. With the help of this ratio present cash flow of
an organisation for meet their short term and long term liabilities (Cournède, Denk and Hoeller,
2015).
Ryanair holdings public limited company – The particular ratio can present in asset based they
have not obligation and liabilities regarding to cash flow. The company having solvency ratio
from 2016 to 2018, 32.06%, 36.89% and 36.15%.
Flybe group plc – The company have not good ability to pay off their amount from investor
purpose. They has figure of 27.11% in 2016, 19.04% in 2017 and 15.22% in 2018.
Easyjet plc – From the liability side it is increased but asset side it is decreased s o airline possess
a good solvency ratio and having amount of 46.58% in 2016, 49.13% in 2017 and 46.93% in
2018. the particular airline have opportunity in its favour optimally.
9
the company has been showed negative figures in 2015 to 2017, -9.33, 1.73 and -10.78. so
lenders have doubt for company regarding to pay off loans.
Easyjet plc – It is fall down continuously that means company have too much ability to pay off
their interest and can not bear debt expenses of a company. There are promising figures of 62.55
in 2015 which is decreased to 39.46 in 2016 and 14.07 in 2017.
Solvency ratio – This ratio based on the assets and liabilities and calculated from both
side. It is a key matrix which is used to evaluate ability of business in order to debt obligation
and is used often by prospective business lenders. With the help of this ratio present cash flow of
an organisation for meet their short term and long term liabilities (Cournède, Denk and Hoeller,
2015).
Ryanair holdings public limited company – The particular ratio can present in asset based they
have not obligation and liabilities regarding to cash flow. The company having solvency ratio
from 2016 to 2018, 32.06%, 36.89% and 36.15%.
Flybe group plc – The company have not good ability to pay off their amount from investor
purpose. They has figure of 27.11% in 2016, 19.04% in 2017 and 15.22% in 2018.
Easyjet plc – From the liability side it is increased but asset side it is decreased s o airline possess
a good solvency ratio and having amount of 46.58% in 2016, 49.13% in 2017 and 46.93% in
2018. the particular airline have opportunity in its favour optimally.
9
FLYBE Group Plc
Ryanair holdings public limited company
Easy jet plc
0
10
20
30
40
50
60
27.11
32.06
46.58
19.04
36.89
49.13
15.22
36.15
46.93
2016
2017
2018
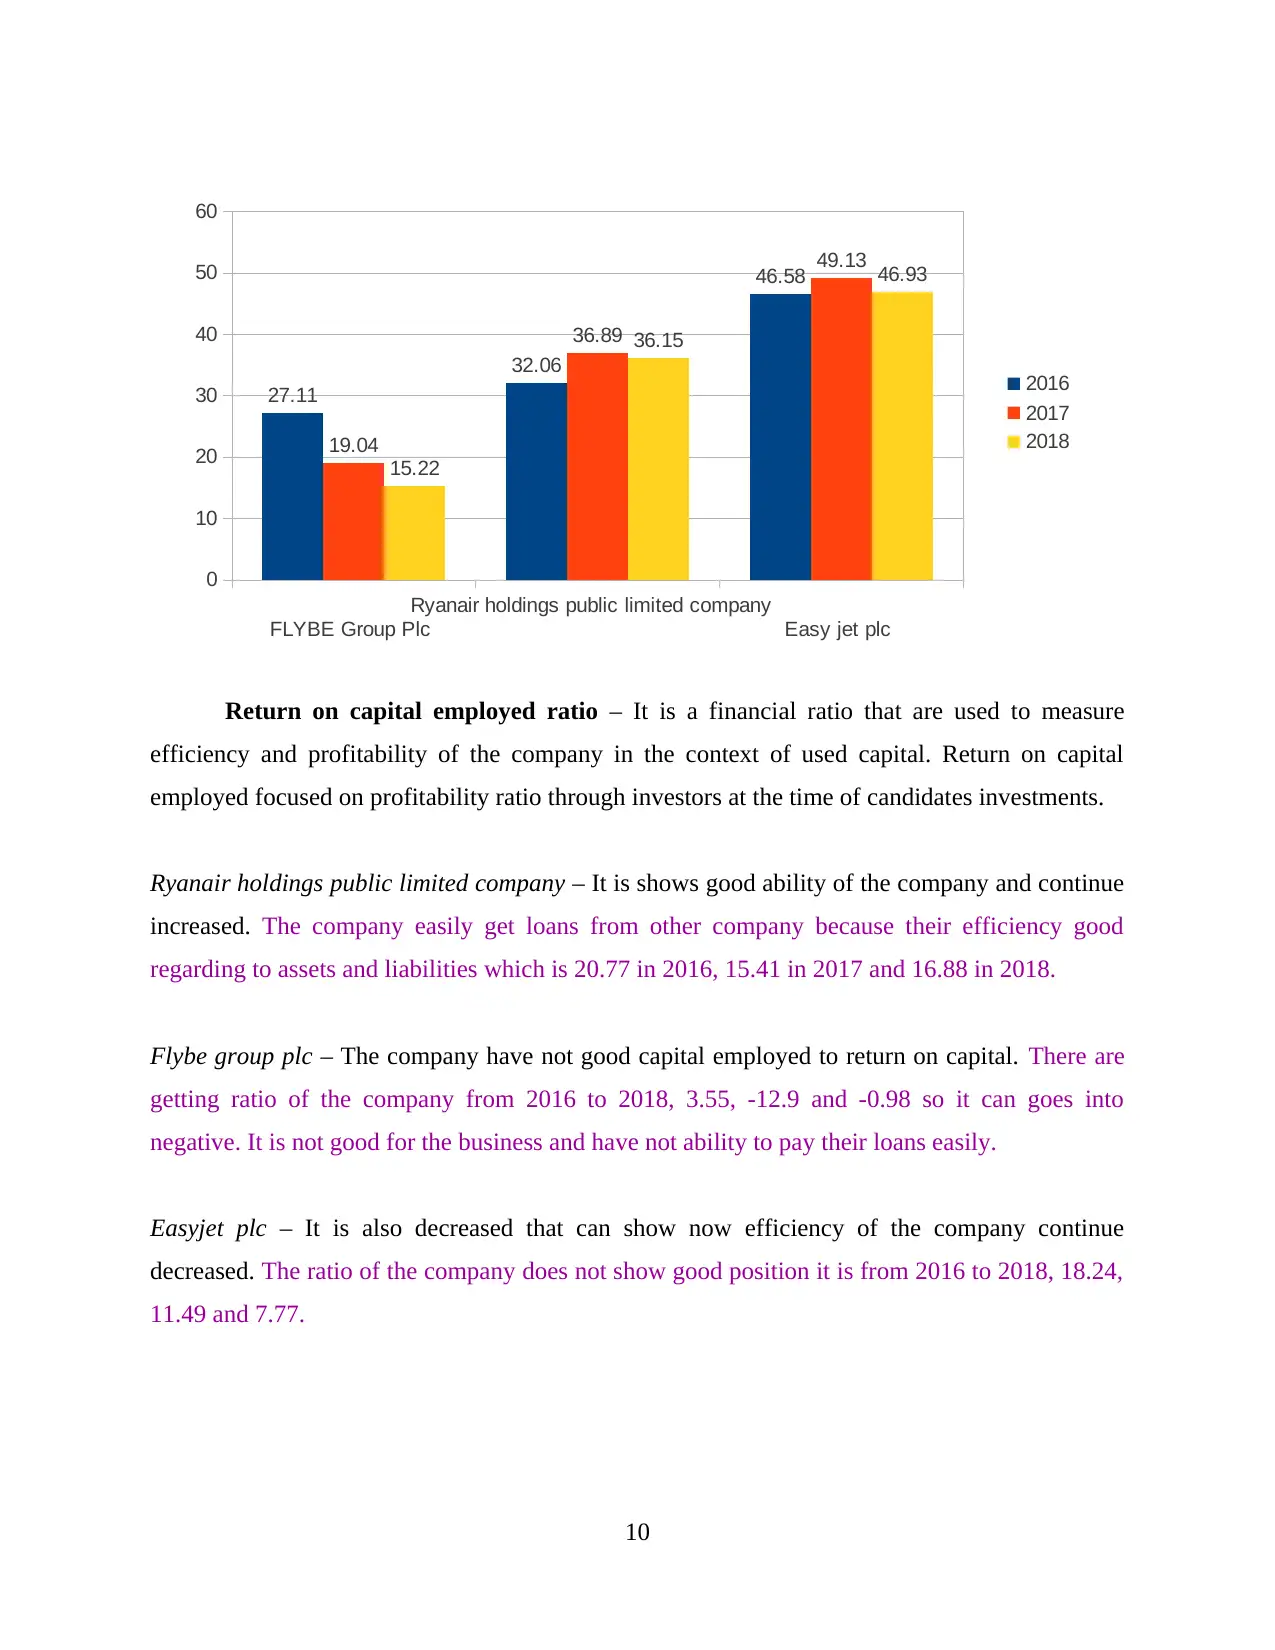
Return on capital employed ratio – It is a financial ratio that are used to measure
efficiency and profitability of the company in the context of used capital. Return on capital
employed focused on profitability ratio through investors at the time of candidates investments.
Ryanair holdings public limited company – It is shows good ability of the company and continue
increased. The company easily get loans from other company because their efficiency good
regarding to assets and liabilities which is 20.77 in 2016, 15.41 in 2017 and 16.88 in 2018.
Flybe group plc – The company have not good capital employed to return on capital. There are
getting ratio of the company from 2016 to 2018, 3.55, -12.9 and -0.98 so it can goes into
negative. It is not good for the business and have not ability to pay their loans easily.
Easyjet plc – It is also decreased that can show now efficiency of the company continue
decreased. The ratio of the company does not show good position it is from 2016 to 2018, 18.24,
11.49 and 7.77.
10
Ryanair holdings public limited company
Easy jet plc
0
10
20
30
40
50
60
27.11
32.06
46.58
19.04
36.89
49.13
15.22
36.15
46.93
2016
2017
2018
Return on capital employed ratio – It is a financial ratio that are used to measure
efficiency and profitability of the company in the context of used capital. Return on capital
employed focused on profitability ratio through investors at the time of candidates investments.
Ryanair holdings public limited company – It is shows good ability of the company and continue
increased. The company easily get loans from other company because their efficiency good
regarding to assets and liabilities which is 20.77 in 2016, 15.41 in 2017 and 16.88 in 2018.
Flybe group plc – The company have not good capital employed to return on capital. There are
getting ratio of the company from 2016 to 2018, 3.55, -12.9 and -0.98 so it can goes into
negative. It is not good for the business and have not ability to pay their loans easily.
Easyjet plc – It is also decreased that can show now efficiency of the company continue
decreased. The ratio of the company does not show good position it is from 2016 to 2018, 18.24,
11.49 and 7.77.
10
⊘ This is a preview!⊘
Do you want full access?
Subscribe today to unlock all pages.
Trusted by 1+ million students worldwide
1 out of 23
Related Documents


Your All-in-One AI-Powered Toolkit for Academic Success.
+13062052269
info@desklib.com
Available 24*7 on WhatsApp / Email
![[object Object]](/_next/static/media/star-bottom.7253800d.svg)
Unlock your academic potential
Copyright © 2020–2026 A2Z Services. All Rights Reserved. Developed and managed by ZUCOL.