Predictive Analysis Report: Airline Customer Recommendation Study
VerifiedAdded on 2021/06/17
|17
|2124
|193
Report
AI Summary
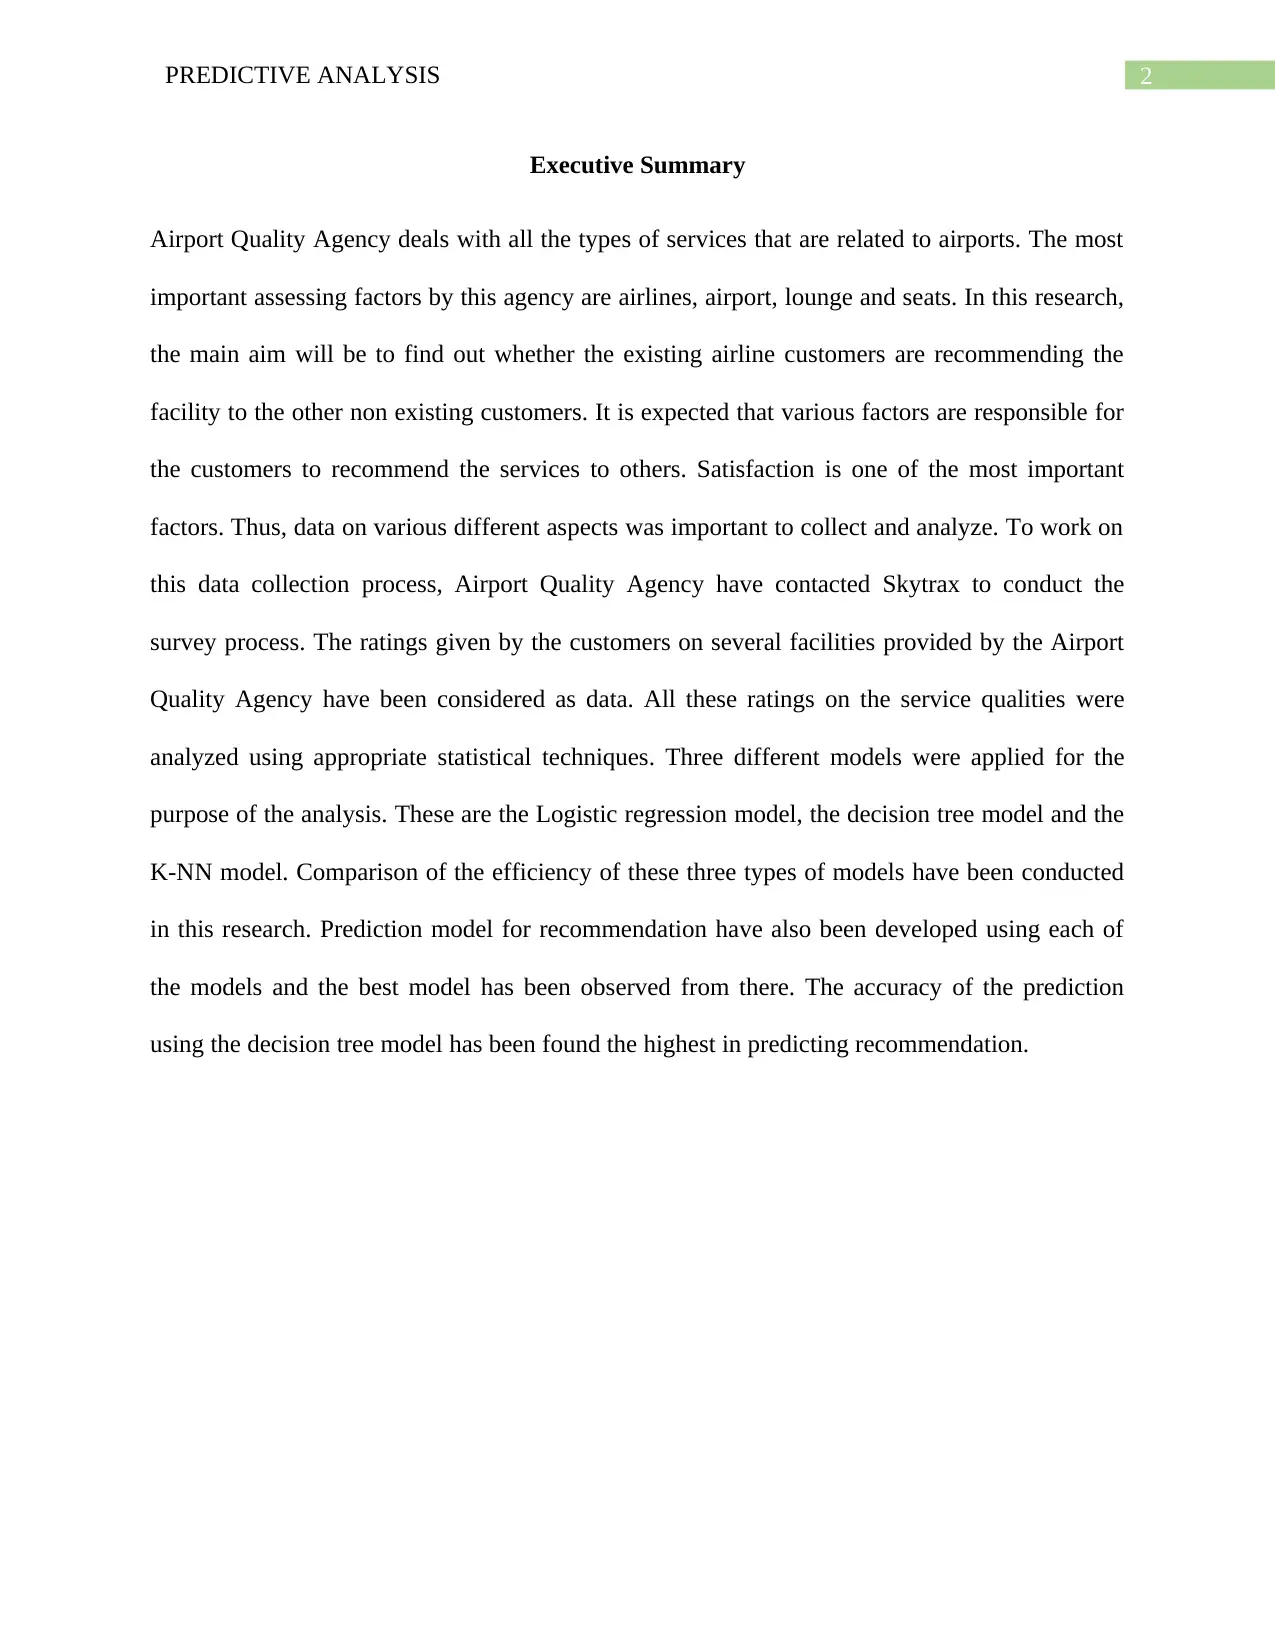
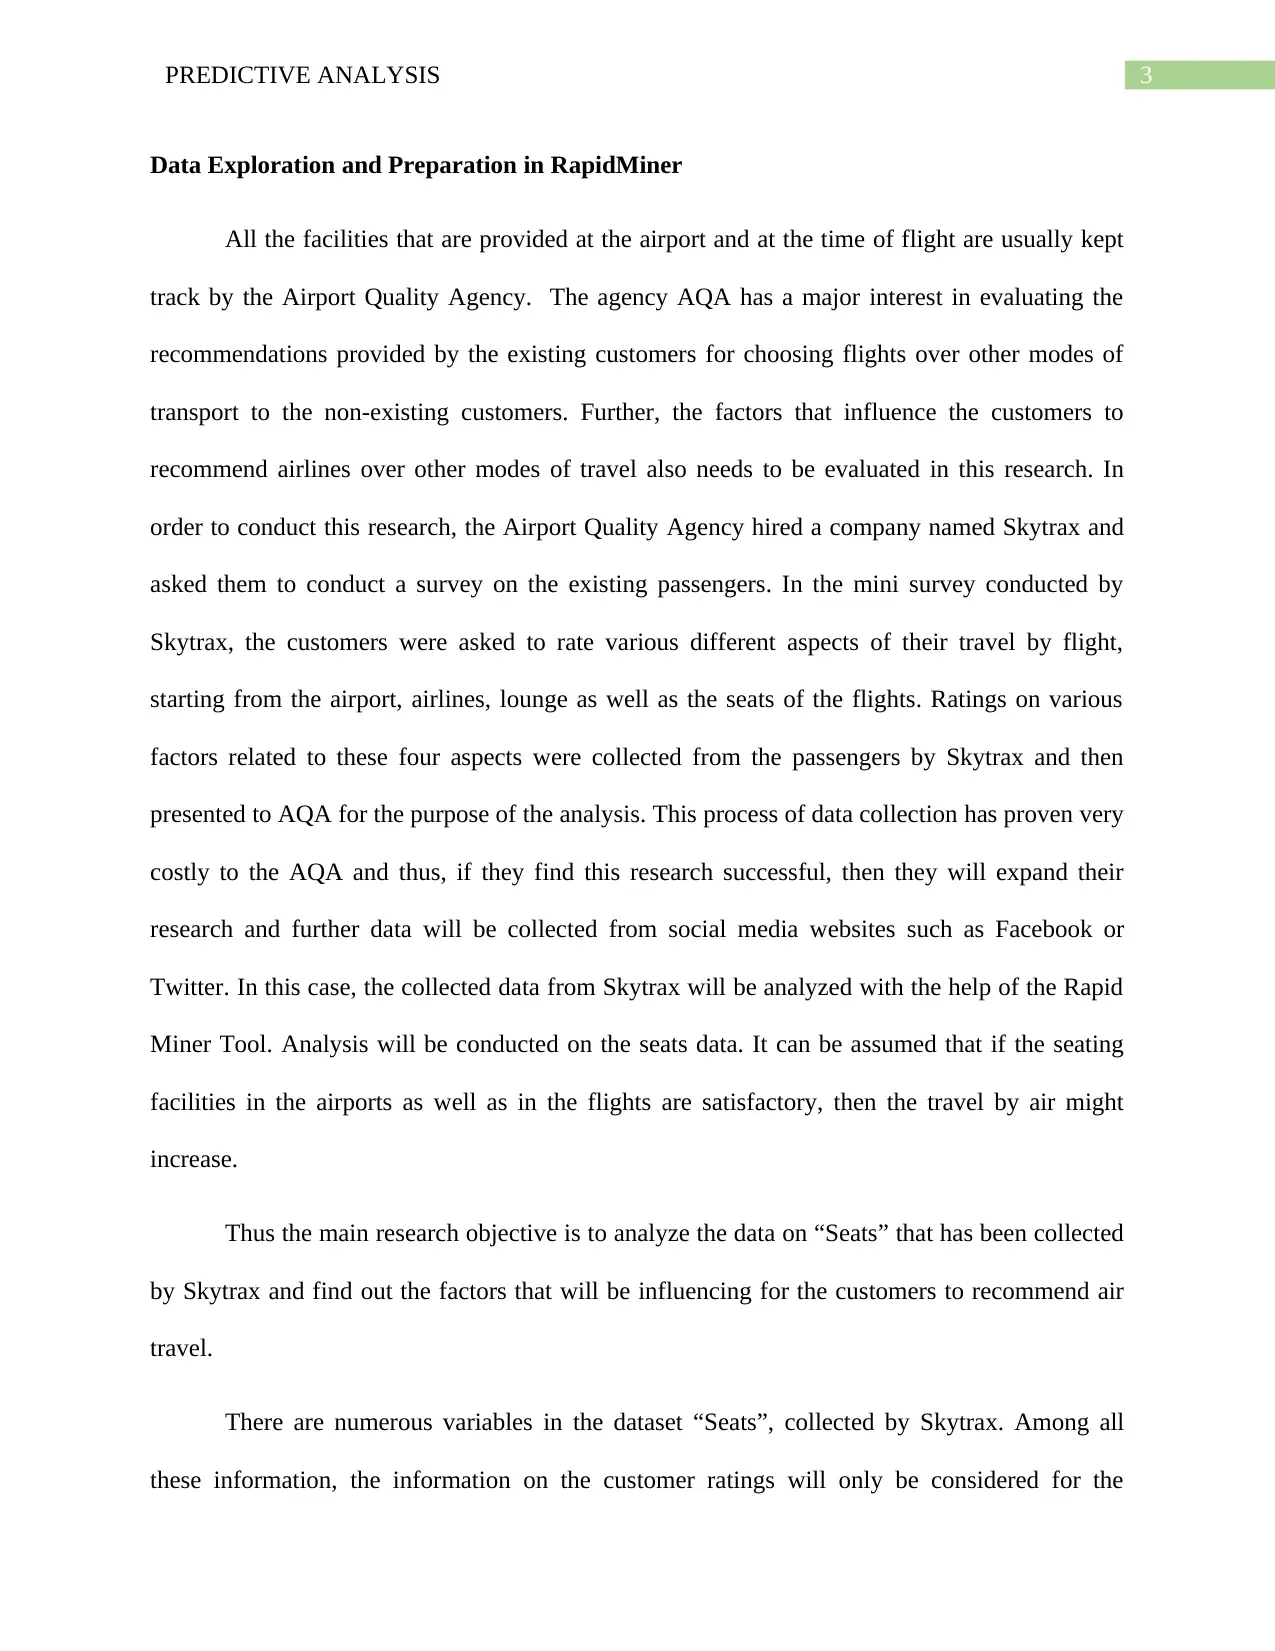
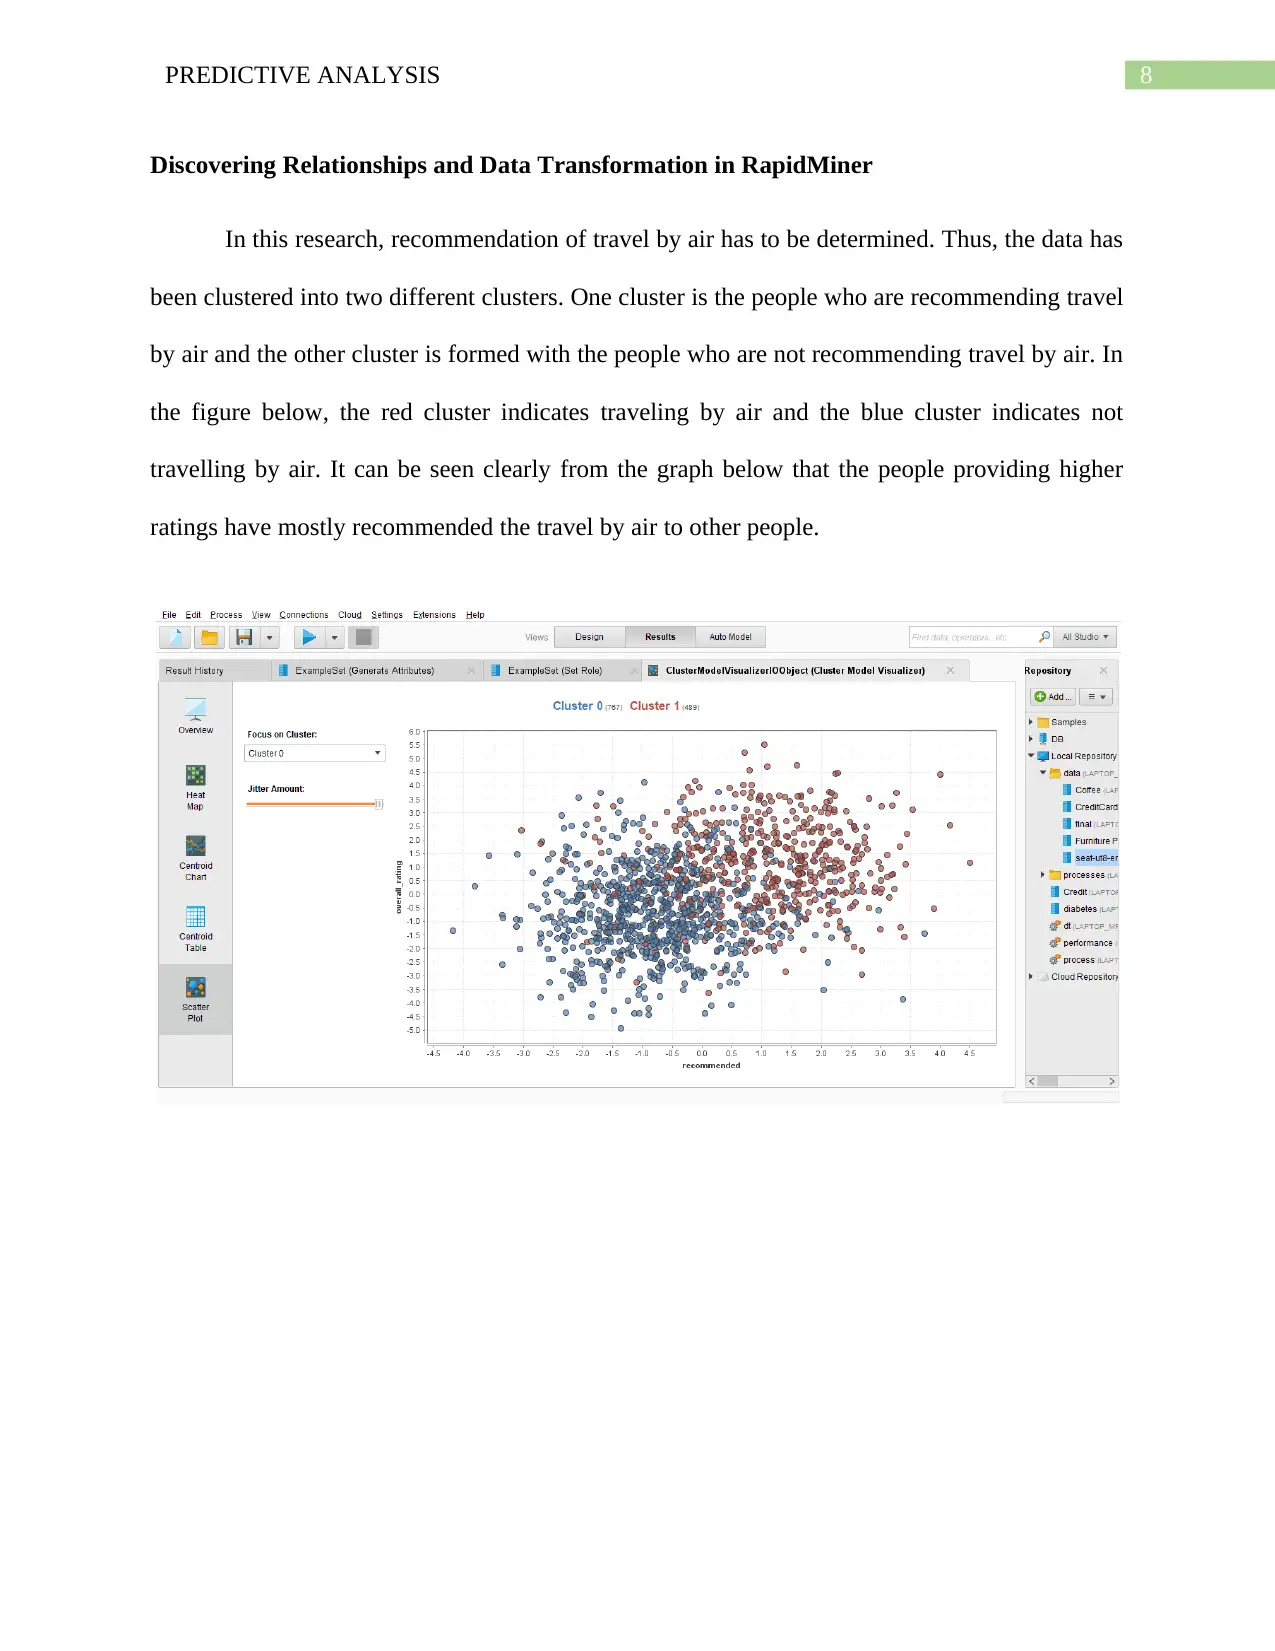
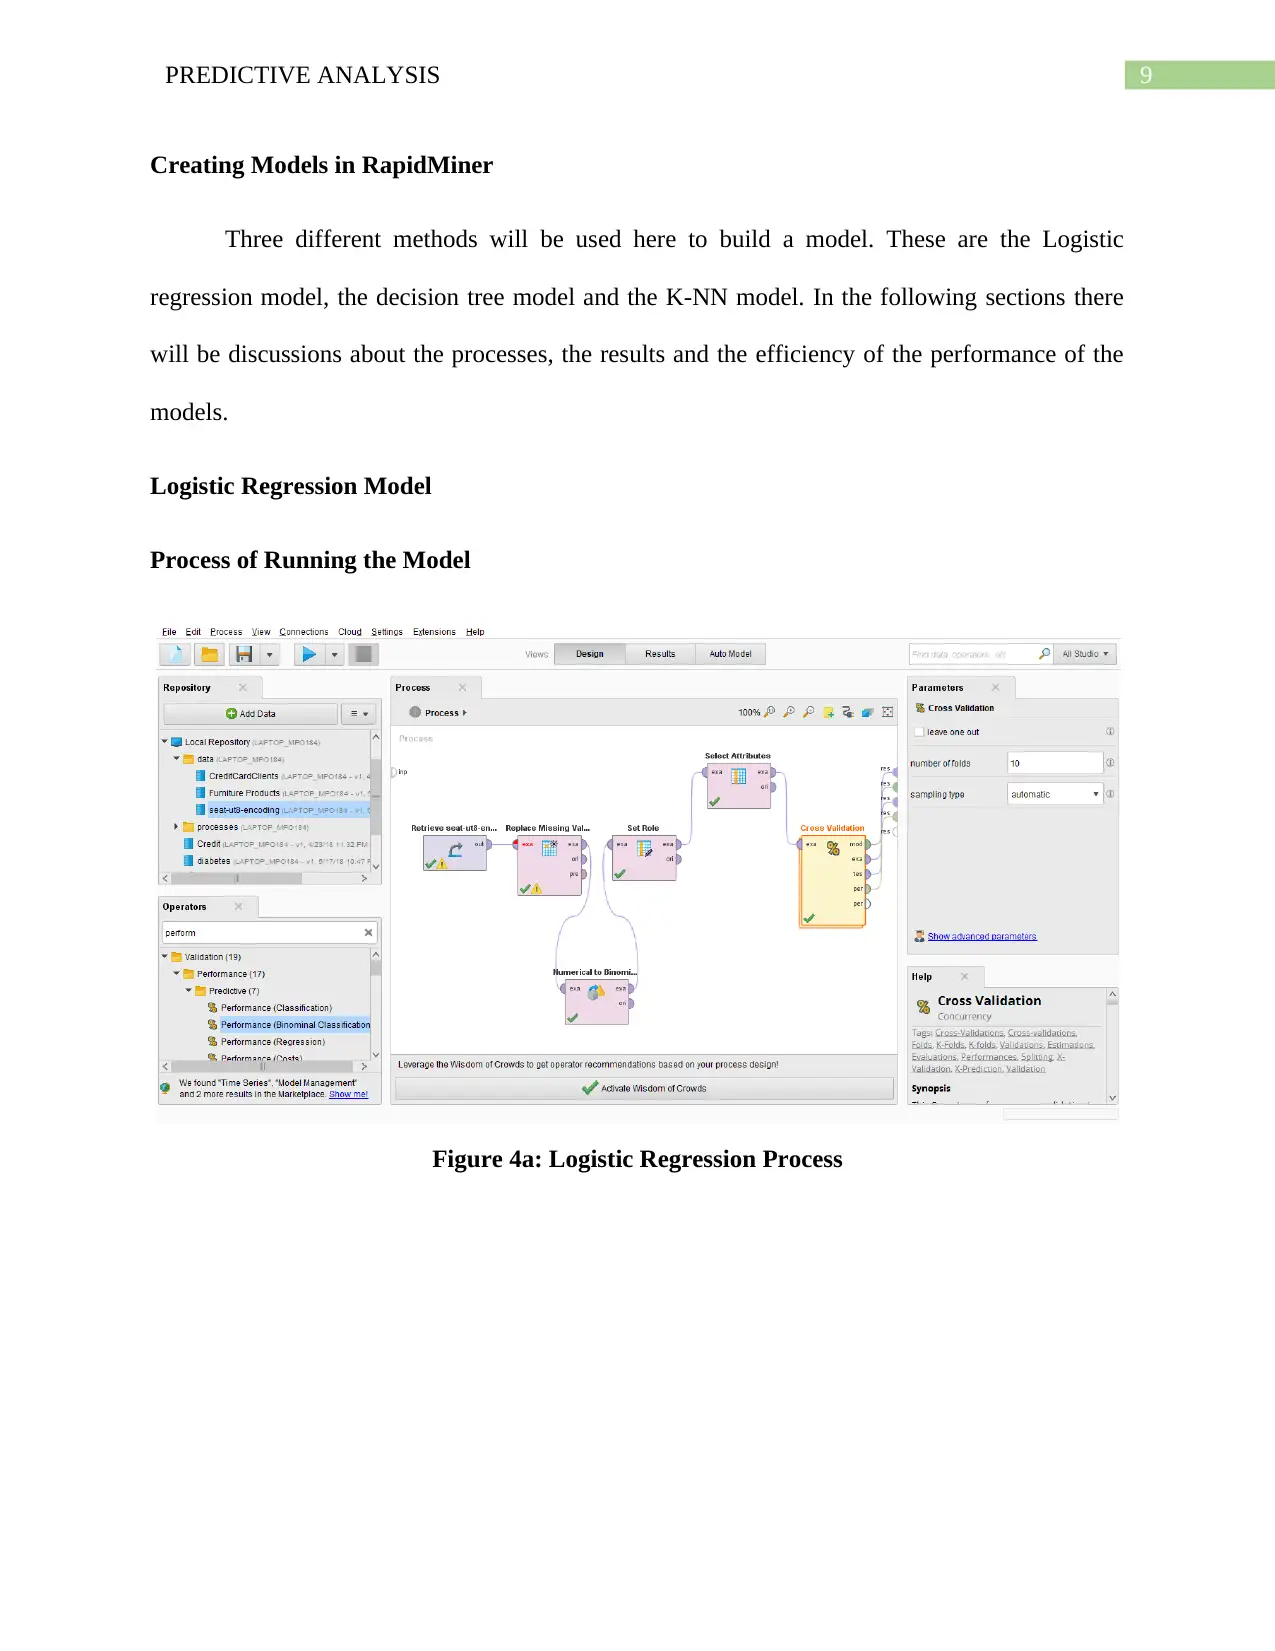
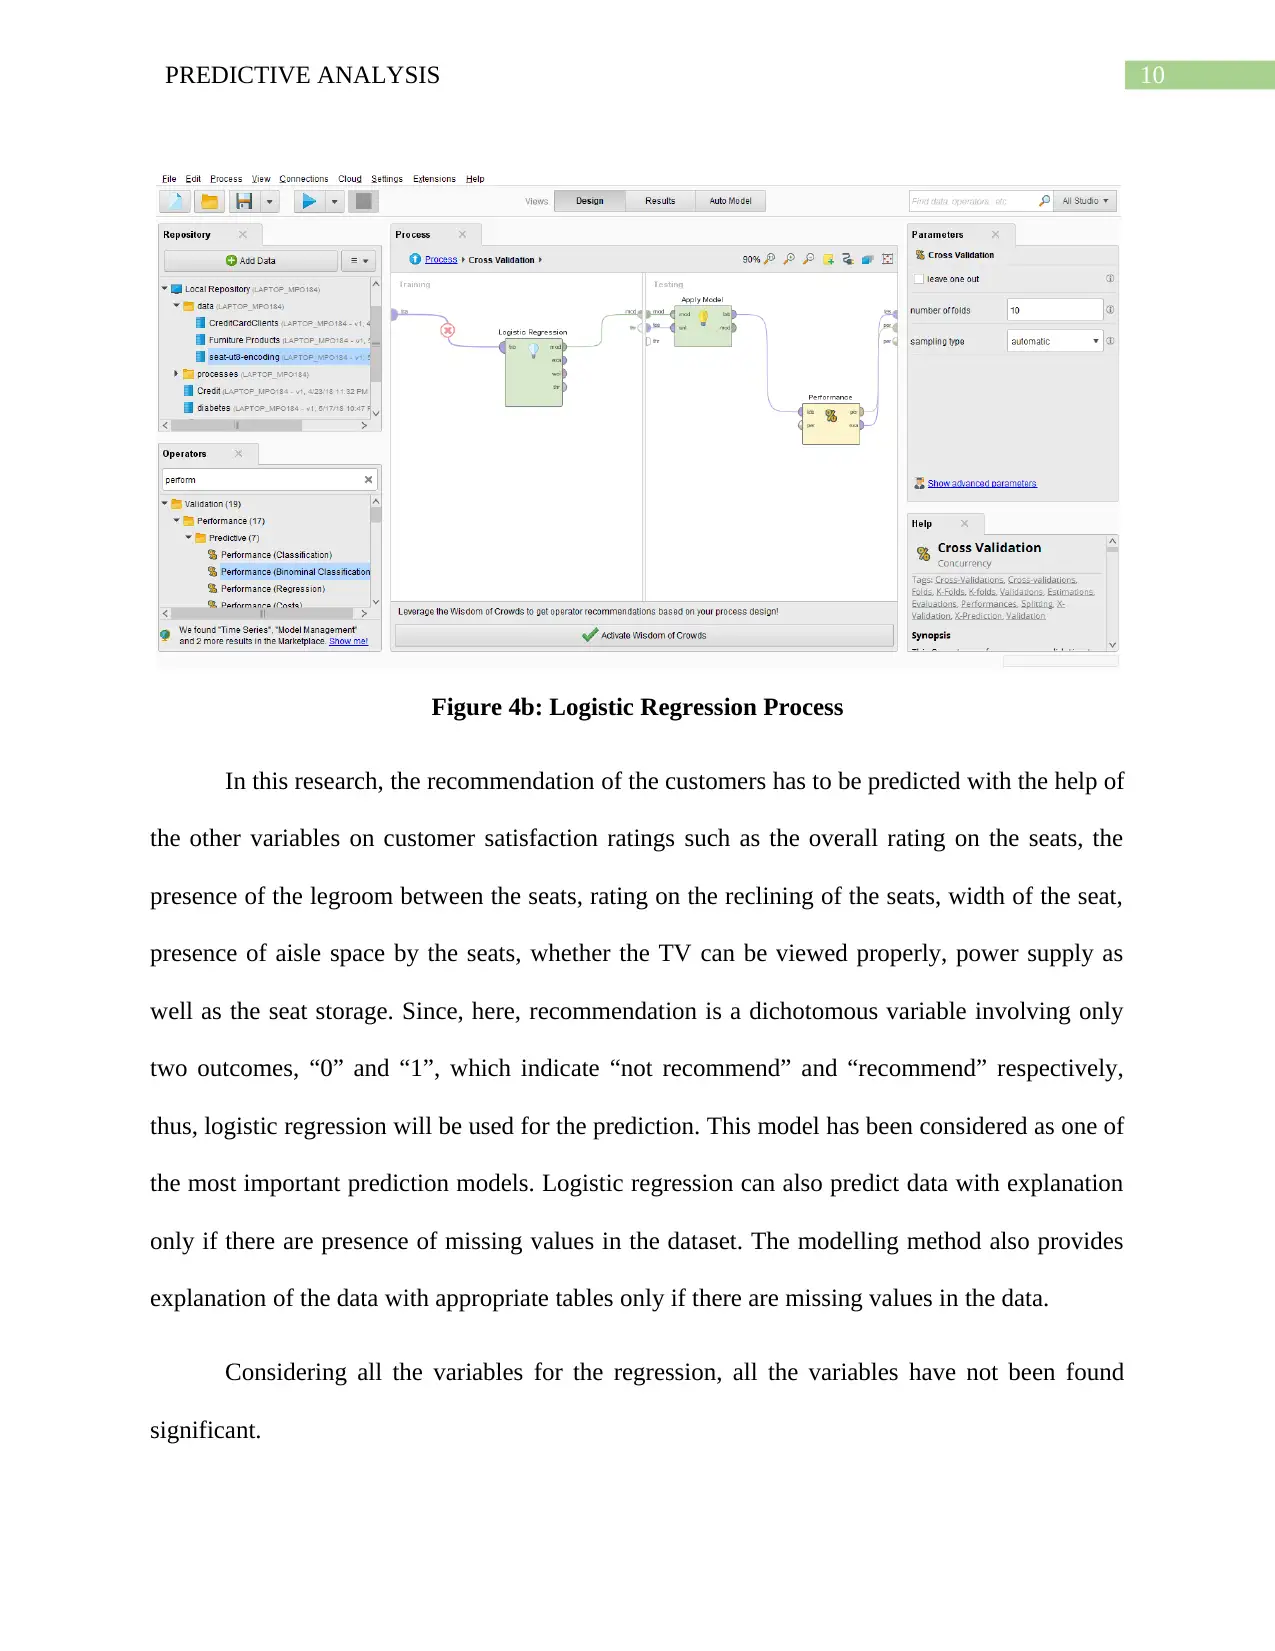
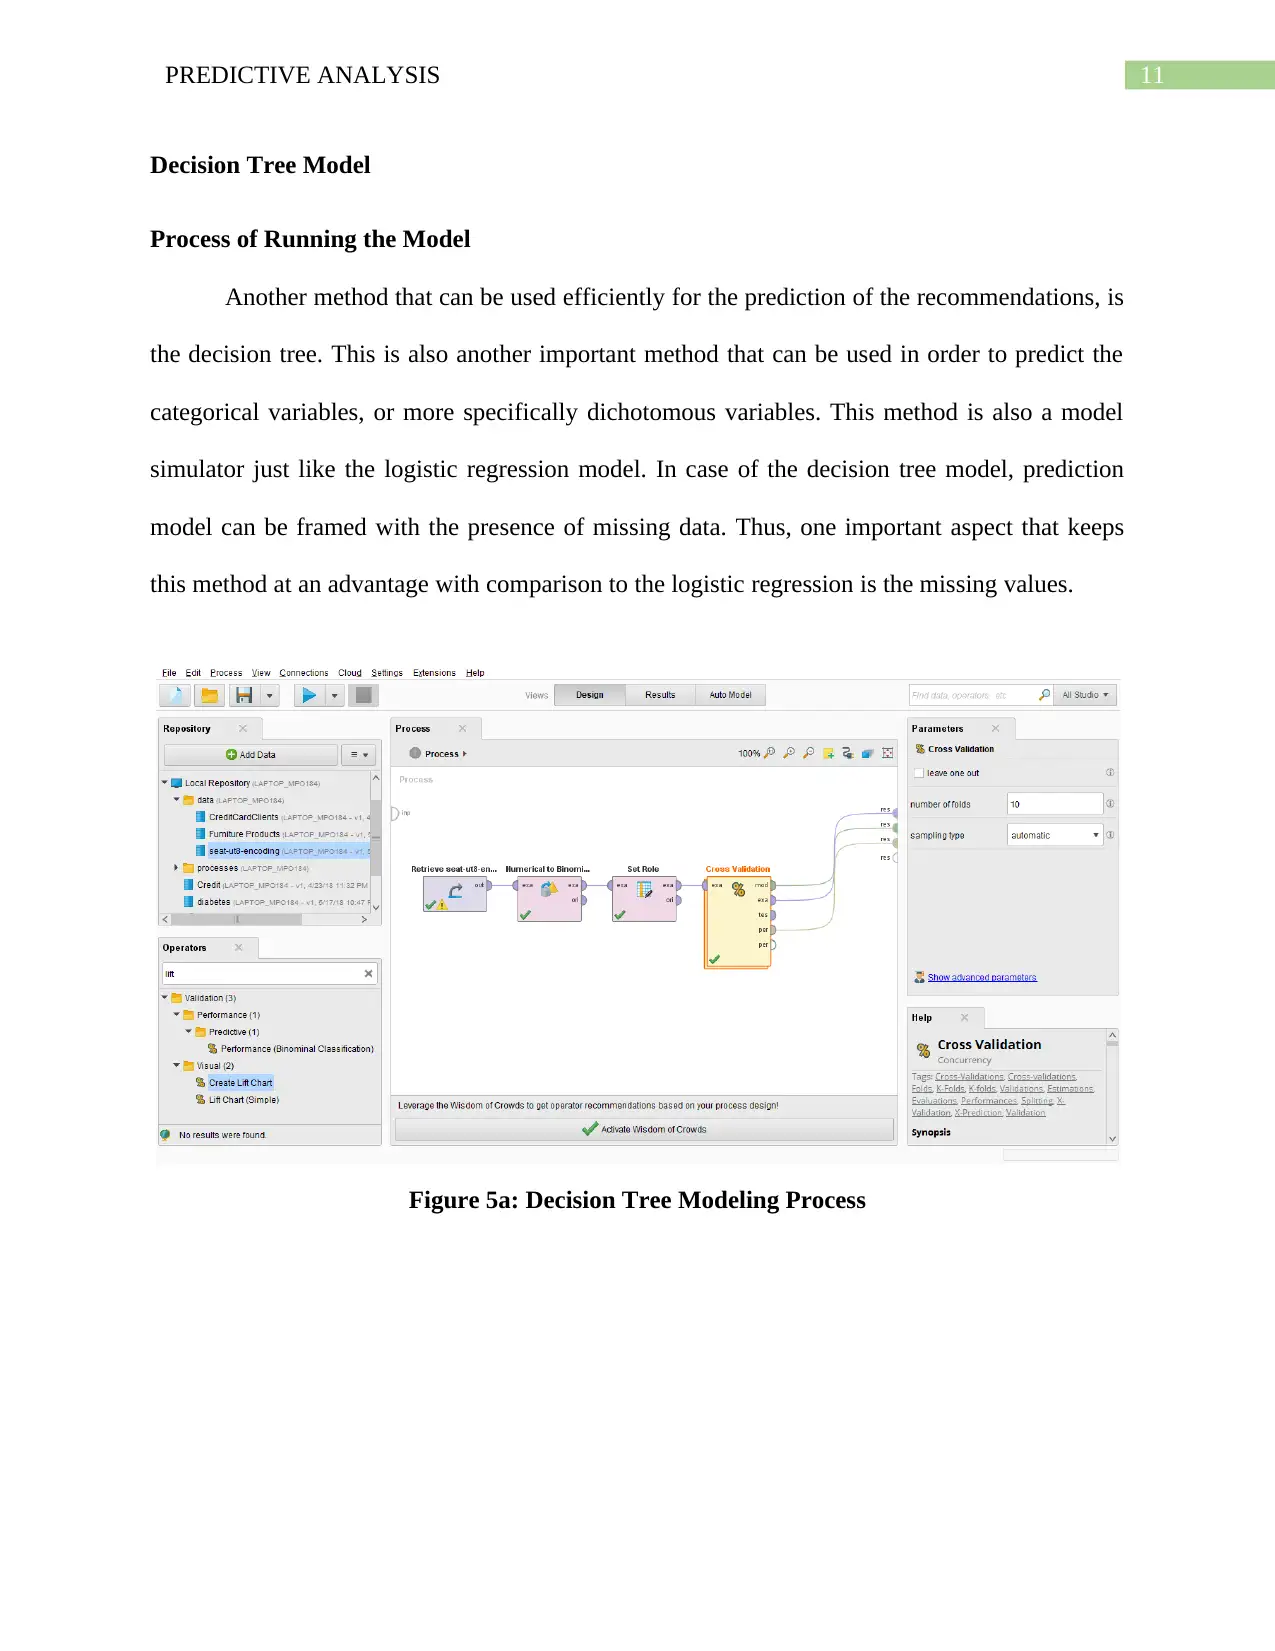
This report presents a predictive analysis of airline customer recommendations, conducted for the Airport Quality Agency (AQA). The study, based on data collected by Skytrax, aims to determine factors influencing customers to recommend air travel. The analysis focuses on customer ratings of various in-flight and airport services, including seats, legroom, and amenities. Three predictive models—logistic regression, decision tree, and K-NN—are employed to predict customer recommendations. The report includes data exploration, relationship discovery, and model creation using RapidMiner. The decision tree model is identified as the most accurate in predicting recommendations. The research suggests that improvements in customer satisfaction across various factors will likely increase the demand for air travel. Further research is recommended with a larger sample size, potentially using social media data, to expand the scope and generalizability of the findings. The report concludes with recommendations for AQA to enhance service quality and improve customer satisfaction.

Running Head: PREDICTIVE ANALYSIS
Predictive Analysis
Name of the Student
Name of the University
Author Note
Predictive Analysis
Name of the Student
Name of the University
Author Note
Paraphrase This Document
Need a fresh take? Get an instant paraphrase of this document with our AI Paraphraser

1PREDICTIVE ANALYSIS
Table of Contents
Executive Summary.........................................................................................................................2
Data Exploration and Preparation in RapidMiner...........................................................................3
Discover Relationships and Data Transformation in RapidMiner..................................................5
Discovering Relationships and Data Transformation in RapidMiner.............................................8
Creating Models in RapidMiner......................................................................................................9
Logistic Regression Model..........................................................................................................9
Process of Running the Model.................................................................................................9
Decision Tree Model.................................................................................................................11
Process of Running the Model...............................................................................................11
Output from the Decision Tree Modelling............................................................................12
K-NN Model..............................................................................................................................13
Process of Running the Model...............................................................................................13
Output from the K-NN Model...............................................................................................15
Further Research and Extension in RapidMiner............................................................................16

2PREDICTIVE ANALYSIS
Executive Summary
Airport Quality Agency deals with all the types of services that are related to airports. The most
important assessing factors by this agency are airlines, airport, lounge and seats. In this research,
the main aim will be to find out whether the existing airline customers are recommending the
facility to the other non existing customers. It is expected that various factors are responsible for
the customers to recommend the services to others. Satisfaction is one of the most important
factors. Thus, data on various different aspects was important to collect and analyze. To work on
this data collection process, Airport Quality Agency have contacted Skytrax to conduct the
survey process. The ratings given by the customers on several facilities provided by the Airport
Quality Agency have been considered as data. All these ratings on the service qualities were
analyzed using appropriate statistical techniques. Three different models were applied for the
purpose of the analysis. These are the Logistic regression model, the decision tree model and the
K-NN model. Comparison of the efficiency of these three types of models have been conducted
in this research. Prediction model for recommendation have also been developed using each of
the models and the best model has been observed from there. The accuracy of the prediction
using the decision tree model has been found the highest in predicting recommendation.
⊘ This is a preview!⊘
Do you want full access?
Subscribe today to unlock all pages.

Trusted by 1+ million students worldwide

3PREDICTIVE ANALYSIS
Data Exploration and Preparation in RapidMiner
All the facilities that are provided at the airport and at the time of flight are usually kept
track by the Airport Quality Agency. The agency AQA has a major interest in evaluating the
recommendations provided by the existing customers for choosing flights over other modes of
transport to the non-existing customers. Further, the factors that influence the customers to
recommend airlines over other modes of travel also needs to be evaluated in this research. In
order to conduct this research, the Airport Quality Agency hired a company named Skytrax and
asked them to conduct a survey on the existing passengers. In the mini survey conducted by
Skytrax, the customers were asked to rate various different aspects of their travel by flight,
starting from the airport, airlines, lounge as well as the seats of the flights. Ratings on various
factors related to these four aspects were collected from the passengers by Skytrax and then
presented to AQA for the purpose of the analysis. This process of data collection has proven very
costly to the AQA and thus, if they find this research successful, then they will expand their
research and further data will be collected from social media websites such as Facebook or
Twitter. In this case, the collected data from Skytrax will be analyzed with the help of the Rapid
Miner Tool. Analysis will be conducted on the seats data. It can be assumed that if the seating
facilities in the airports as well as in the flights are satisfactory, then the travel by air might
increase.
Thus the main research objective is to analyze the data on “Seats” that has been collected
by Skytrax and find out the factors that will be influencing for the customers to recommend air
travel.
There are numerous variables in the dataset “Seats”, collected by Skytrax. Among all
these information, the information on the customer ratings will only be considered for the
Paraphrase This Document
Need a fresh take? Get an instant paraphrase of this document with our AI Paraphraser

4PREDICTIVE ANALYSIS
analysis. It is assumed that the ratings on the satisfaction of the customers is more important for a
customer to recommend travel by air. The ratings of the customers were given on various aspects
such as the overall rating on the seats, the presence of the legroom between the seats, rating on
the reclining of the seats, width of the seat, presence of aisle space by the seats, whether the TV
can be viewed properly, power supply as well as the seat storage. All the ratings given by the
customers on these factors will be used as data to analyze and predict the recommendations for
the travel by air. As it can be seen that the data is not complete and there are various missing
values present in the data. All the missing values will be manipulated while running the analysis
process in rapid miner.

5PREDICTIVE ANALYSIS
Discover Relationships and Data Transformation in RapidMiner
The main aim of this research is to find out whether the customers are recommending the
air travel over the other modes of travel. Customer satisfaction rating has been considered as one
of the most important factors that are responsible for this recommendation despite of a lot other
factors. A histogram of the overall rating given by the customers have been designed using rapid
miner. It can be seen clearly from the histogram that most of the people have given a rating
which is very low on the seats of the flights. Thus, it is the immediate duty of the AQA to take
care of the problems people are facing on seats so that their satisfaction is increased. Further,
from the scatter diagram, it can be seen clearly that the people who have recommended the travel
by air have given considerable higher ratings on the overall satisfaction.
Figure 1: Histogram showing overall satisfaction
⊘ This is a preview!⊘
Do you want full access?
Subscribe today to unlock all pages.

Trusted by 1+ million students worldwide

6PREDICTIVE ANALYSIS
Figure 2: Scatter diagram shoeing relation between overall rating and recommendation
Figure 3: Correlation Table
From the correlation table, it can be seen clearly that there is a positive correlation
between recommendation and all the other aspects of satisfaction ratings. This indicates that with
Figure 2: Scatter diagram shoeing relation between overall rating and recommendation
Figure 3: Correlation Table
From the correlation table, it can be seen clearly that there is a positive correlation
between recommendation and all the other aspects of satisfaction ratings. This indicates that with
Paraphrase This Document
Need a fresh take? Get an instant paraphrase of this document with our AI Paraphraser

7PREDICTIVE ANALYSIS
the increase in the ratings given by the people, the more they recommend the mode of transport
and thus, the number of customers travelling by flight will increase. This will in turn influence
the profit of the AQA.
the increase in the ratings given by the people, the more they recommend the mode of transport
and thus, the number of customers travelling by flight will increase. This will in turn influence
the profit of the AQA.

8PREDICTIVE ANALYSIS
Discovering Relationships and Data Transformation in RapidMiner
In this research, recommendation of travel by air has to be determined. Thus, the data has
been clustered into two different clusters. One cluster is the people who are recommending travel
by air and the other cluster is formed with the people who are not recommending travel by air. In
the figure below, the red cluster indicates traveling by air and the blue cluster indicates not
travelling by air. It can be seen clearly from the graph below that the people providing higher
ratings have mostly recommended the travel by air to other people.
⊘ This is a preview!⊘
Do you want full access?
Subscribe today to unlock all pages.

Trusted by 1+ million students worldwide

9PREDICTIVE ANALYSIS
Creating Models in RapidMiner
Three different methods will be used here to build a model. These are the Logistic
regression model, the decision tree model and the K-NN model. In the following sections there
will be discussions about the processes, the results and the efficiency of the performance of the
models.
Logistic Regression Model
Process of Running the Model
Figure 4a: Logistic Regression Process
Paraphrase This Document
Need a fresh take? Get an instant paraphrase of this document with our AI Paraphraser

10PREDICTIVE ANALYSIS
Figure 4b: Logistic Regression Process
In this research, the recommendation of the customers has to be predicted with the help of
the other variables on customer satisfaction ratings such as the overall rating on the seats, the
presence of the legroom between the seats, rating on the reclining of the seats, width of the seat,
presence of aisle space by the seats, whether the TV can be viewed properly, power supply as
well as the seat storage. Since, here, recommendation is a dichotomous variable involving only
two outcomes, “0” and “1”, which indicate “not recommend” and “recommend” respectively,
thus, logistic regression will be used for the prediction. This model has been considered as one of
the most important prediction models. Logistic regression can also predict data with explanation
only if there are presence of missing values in the dataset. The modelling method also provides
explanation of the data with appropriate tables only if there are missing values in the data.
Considering all the variables for the regression, all the variables have not been found
significant.

11PREDICTIVE ANALYSIS
Decision Tree Model
Process of Running the Model
Another method that can be used efficiently for the prediction of the recommendations, is
the decision tree. This is also another important method that can be used in order to predict the
categorical variables, or more specifically dichotomous variables. This method is also a model
simulator just like the logistic regression model. In case of the decision tree model, prediction
model can be framed with the presence of missing data. Thus, one important aspect that keeps
this method at an advantage with comparison to the logistic regression is the missing values.
Figure 5a: Decision Tree Modeling Process
⊘ This is a preview!⊘
Do you want full access?
Subscribe today to unlock all pages.

Trusted by 1+ million students worldwide
1 out of 17
Related Documents
Your All-in-One AI-Powered Toolkit for Academic Success.
+13062052269
info@desklib.com
Available 24*7 on WhatsApp / Email
Unlock your academic potential
Copyright © 2020–2025 A2Z Services. All Rights Reserved. Developed and managed by ZUCOL.


