Airline Analysis: Comparing Performance in the Aviation Industry
VerifiedAdded on 2023/04/21
|8
|1185
|306
Report
AI Summary
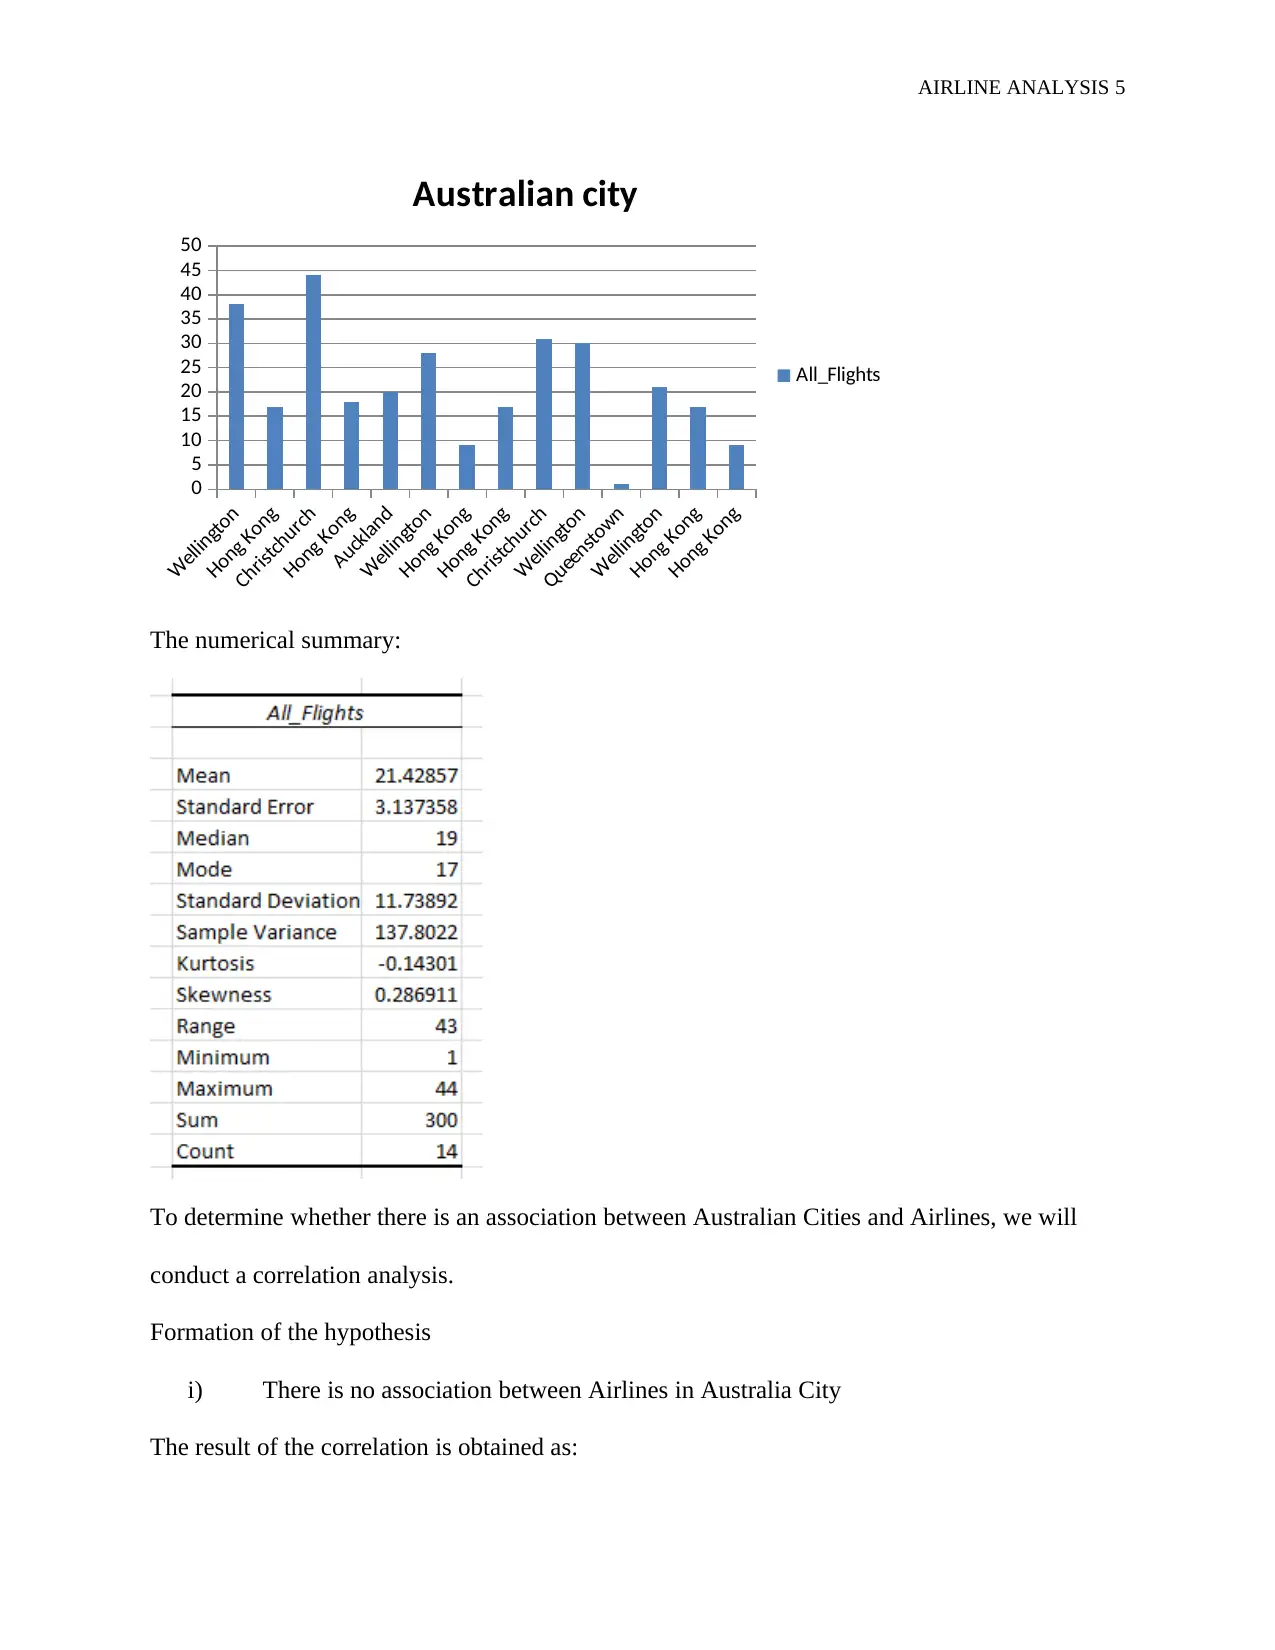
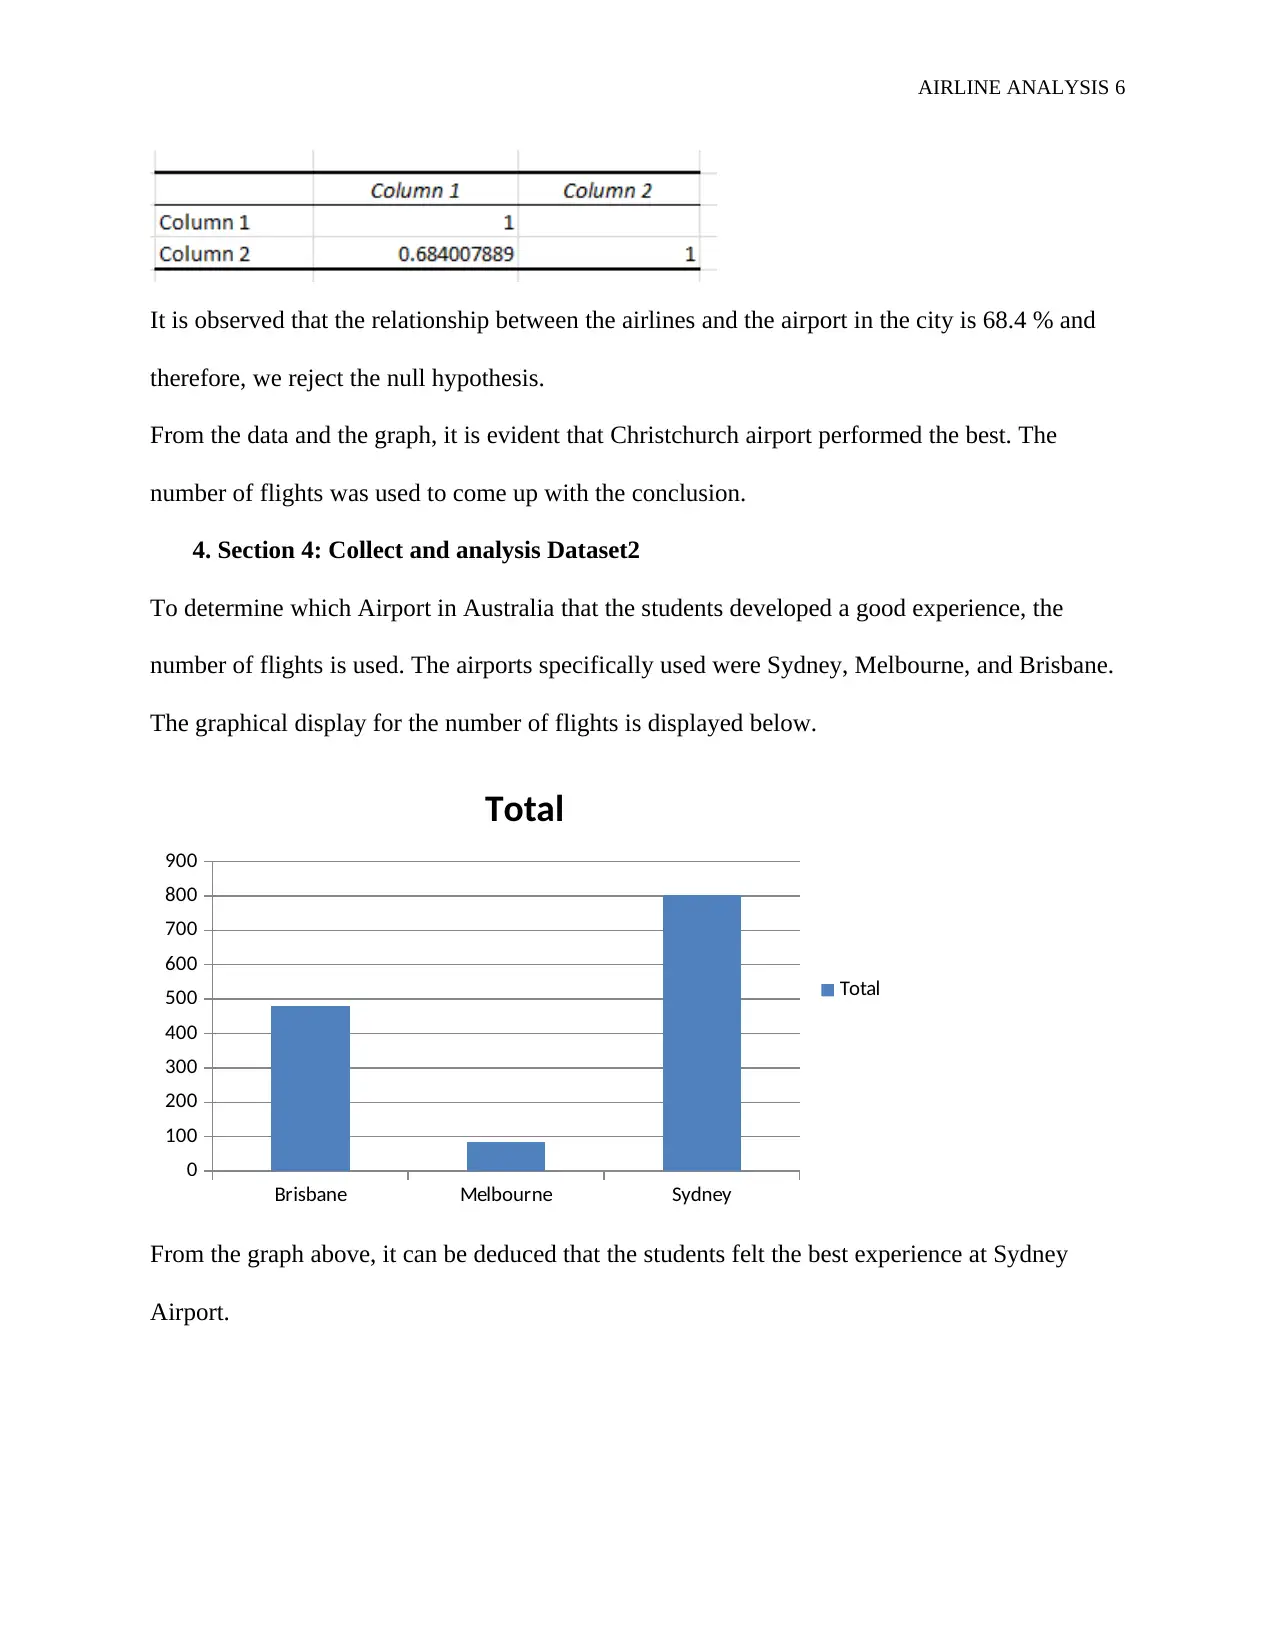
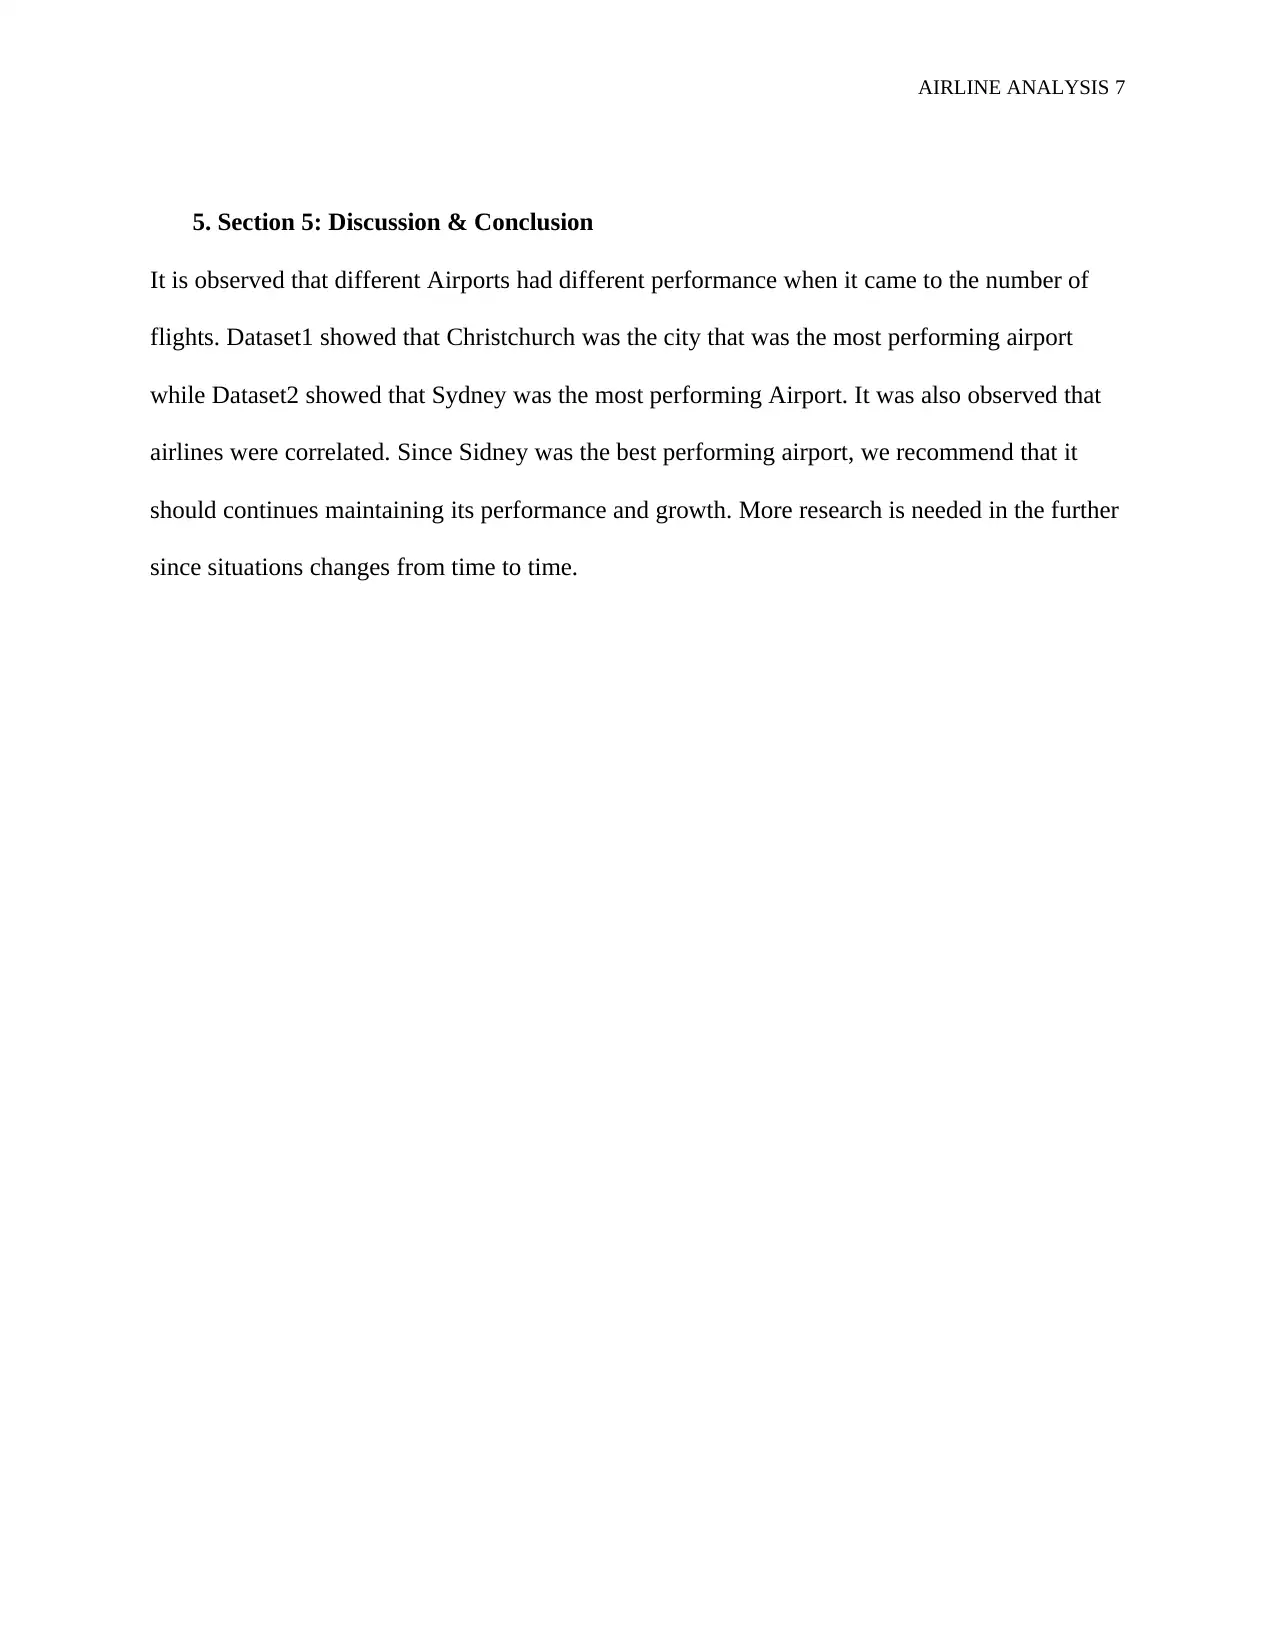
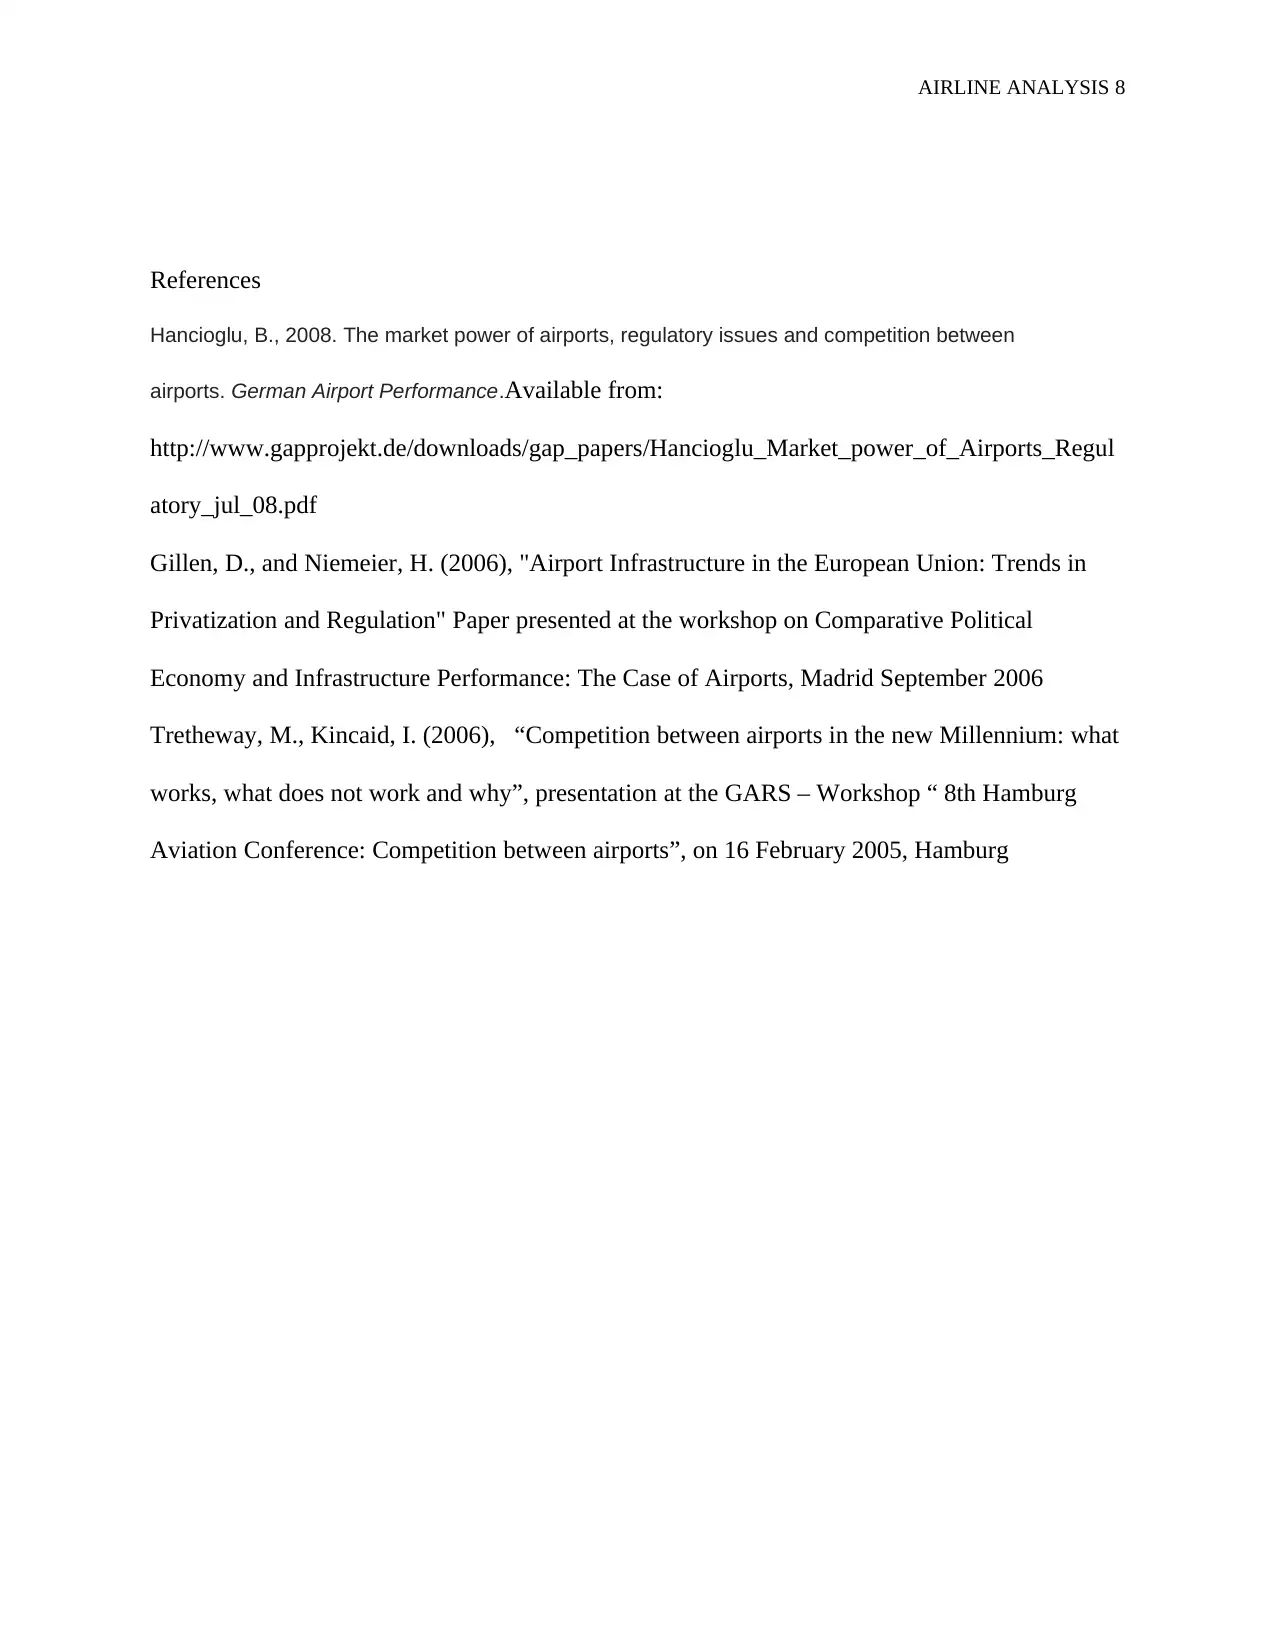
This report presents an analysis comparing the performance of airlines and airports, primarily focusing on the Australian aviation industry. It utilizes two datasets, one secondary and one collected from public domain surveys, to assess various factors influencing airline and airport performance. The analysis includes a statistical evaluation of flight data, examining distributions, averages, and correlations between cities and airlines. The report identifies Christchurch as a top-performing airport in one dataset and Sydney in another, based on flight numbers and student experience. It concludes with recommendations for maintaining performance and suggests further research, acknowledging the dynamic nature of the aviation industry. This report is available on Desklib, a platform offering study tools and resources for students.

AIRLINE ANALYSIS 1
Analyzing Different Airline to Compare Their Performances Through Competition In Aviation
Industry
Name
Institution
Course
Analyzing Different Airline to Compare Their Performances Through Competition In Aviation
Industry
Name
Institution
Course
Paraphrase This Document
Need a fresh take? Get an instant paraphrase of this document with our AI Paraphraser

AIRLINE ANALYSIS 2
Analyzing Different Airline to Compare Their Performances Through Competition In Aviation
Industry
Introduction
This assignment aims at comparing the airline and airports of Australia according to their
performances. Two datasets are tackled with the consent of answering the assignment’s
objective. Different airlines and airports have been designed to carry different capacities of
passengers. Airports have a significant value in the aviation industry (Hancioglu, 2008). An airport
does the activity of transporting passengers and freight from one region to another. By doing
this, they create employment for their citizens, and in return, it grows their country's economy.
The UK, Canada, Australia, and New Zealand are the pioneers in this industry (Gillen and
Niemeier, 2006). Passengers using airport had been complaining about the high amount they
charge and the discrimination of the prices. New regulation laws were formed to succumb to this
issue. Higher prices affected industries related to airports such as tourism. Airports had been
facing different kinds of competition such as:| Competition for serving a shared local market,
Competition for connecting traffic, Competition for cargo traffic, Destination competition and
Competition from the outside suppliers (Tretheway and Kincaid, 2006),
Dataset1 is a secondary data which contains 1000 observations and 16 variables. The data
contains information about Australian City, International City, Airline, Route, Port Country, Port
Region, Service Country, Service Regions, Stops, and Maximum seats, the total number of
flights, the year, traveling In and Out and the month.
Dataset2 was collected by surveying the data available in the public domain. The secondary data
obtained might be biased since it contains samples which may differ from the actual data. The
dataset contains 150 observations and 16 columns.

AIRLINE ANALYSIS 3
Section 2: Analysis of a single variable in Dataset 1
Below is the summary of the total number of flights:
The graphical display of the total number of flights
1
10.67741935
20.35483871
30.03225806
39.70967742
49.38709677
59.06451613
68.74193548
78.41935484
88.09677419
97.77419355
107.4516129
117.1290323
126.8064516
136.483871
146.1612903
0
20
40
60
80
100
120
140
160
180
Histogram of All flights
Frequency
The data is positively skewed to the right. This is deduced using the mean value which is 24.56.
Majority of the data are skewed to the right.
⊘ This is a preview!⊘
Do you want full access?
Subscribe today to unlock all pages.

Trusted by 1+ million students worldwide

AIRLINE ANALYSIS 4
To determine whether the average number of flights that came in and flew out of Australia
between September 2003 and September 2018 was more than 30, we need to conduct a one
sample t-test. The hypothesis designed was:
i) The average number of flights that came in and flew out of Australia between
September 2003 and September 2018 is significantly less than 30
The result obtained from the test is:
Since the p-value is less than 0.05, we reject the null hypothesis and conclude that the average
number of flights that came in and flew out of Australia between September 2003 and September
2018 is significantly greater than 30.
Section 3: Analysis of two variables in Dataset 1
To analyze this part, subsetting is carried on the primary data. Below is the graphical and table
summary of the results
Paraphrase This Document
Need a fresh take? Get an instant paraphrase of this document with our AI Paraphraser

AIRLINE ANALYSIS 5
Wellington
Hong Kong
Christchurch
Hong Kong
Auckland
Wellington
Hong Kong
Hong Kong
Christchurch
Wellington
Queenstown
Wellington
Hong Kong
Hong Kong
0
5
10
15
20
25
30
35
40
45
50
Australian city
All_Flights
The numerical summary:
To determine whether there is an association between Australian Cities and Airlines, we will
conduct a correlation analysis.
Formation of the hypothesis
i) There is no association between Airlines in Australia City
The result of the correlation is obtained as:
Wellington
Hong Kong
Christchurch
Hong Kong
Auckland
Wellington
Hong Kong
Hong Kong
Christchurch
Wellington
Queenstown
Wellington
Hong Kong
Hong Kong
0
5
10
15
20
25
30
35
40
45
50
Australian city
All_Flights
The numerical summary:
To determine whether there is an association between Australian Cities and Airlines, we will
conduct a correlation analysis.
Formation of the hypothesis
i) There is no association between Airlines in Australia City
The result of the correlation is obtained as:

AIRLINE ANALYSIS 6
It is observed that the relationship between the airlines and the airport in the city is 68.4 % and
therefore, we reject the null hypothesis.
From the data and the graph, it is evident that Christchurch airport performed the best. The
number of flights was used to come up with the conclusion.
4. Section 4: Collect and analysis Dataset2
To determine which Airport in Australia that the students developed a good experience, the
number of flights is used. The airports specifically used were Sydney, Melbourne, and Brisbane.
The graphical display for the number of flights is displayed below.
Brisbane Melbourne Sydney
0
100
200
300
400
500
600
700
800
900
Total
Total
From the graph above, it can be deduced that the students felt the best experience at Sydney
Airport.
⊘ This is a preview!⊘
Do you want full access?
Subscribe today to unlock all pages.

Trusted by 1+ million students worldwide

AIRLINE ANALYSIS 7
5. Section 5: Discussion & Conclusion
It is observed that different Airports had different performance when it came to the number of
flights. Dataset1 showed that Christchurch was the city that was the most performing airport
while Dataset2 showed that Sydney was the most performing Airport. It was also observed that
airlines were correlated. Since Sidney was the best performing airport, we recommend that it
should continues maintaining its performance and growth. More research is needed in the further
since situations changes from time to time.
Paraphrase This Document
Need a fresh take? Get an instant paraphrase of this document with our AI Paraphraser

AIRLINE ANALYSIS 8
References
Hancioglu, B., 2008. The market power of airports, regulatory issues and competition between
airports. German Airport Performance.Available from:
http://www.gapprojekt.de/downloads/gap_papers/Hancioglu_Market_power_of_Airports_Regul
atory_jul_08.pdf
Gillen, D., and Niemeier, H. (2006), "Airport Infrastructure in the European Union: Trends in
Privatization and Regulation" Paper presented at the workshop on Comparative Political
Economy and Infrastructure Performance: The Case of Airports, Madrid September 2006
Tretheway, M., Kincaid, I. (2006), “Competition between airports in the new Millennium: what
works, what does not work and why”, presentation at the GARS – Workshop “ 8th Hamburg
Aviation Conference: Competition between airports”, on 16 February 2005, Hamburg
1 out of 8
Related Documents

Your All-in-One AI-Powered Toolkit for Academic Success.
+13062052269
info@desklib.com
Available 24*7 on WhatsApp / Email
Unlock your academic potential
Copyright © 2020–2025 A2Z Services. All Rights Reserved. Developed and managed by ZUCOL.