Al Anwar Ceramic Company: Financial Analysis and Investment Rationale
VerifiedAdded on 2021/02/21
|12
|1942
|52
Report
AI Summary
This report presents a comprehensive financial analysis of Al Anwar Ceramic, a ceramic tile manufacturer based in Oman. It begins with an overview of the company, including its establishment in 1998 and current production capacity. The report then provides an investment summary, highlighting the company's position in the Omani market and its cost management strategies. Key catalysts, such as production capacity expansion, are discussed, followed by an investment rationale based on the growing demand in the construction sector. The core of the report is a detailed ratio analysis, covering profitability, liquidity, efficiency, and valuation ratios. The analysis includes tables for financial projections and discounted cash flow valuation, concluding that the company's shares are undervalued. A price comparison with competitors is also provided. The report concludes that Al Anwar Ceramic is performing well and has expansion plans, supported by the analysis of its financial statements.

FINANCE
Paraphrase This Document
Need a fresh take? Get an instant paraphrase of this document with our AI Paraphraser
TABLE OF CONTENTS
INTRODUCTION...........................................................................................................................3
Overview of company..................................................................................................................3
Investment summary....................................................................................................................3
Key catalysts................................................................................................................................3
Investment rationale.....................................................................................................................4
Ratio analysis...............................................................................................................................4
CONCLUSION .............................................................................................................................11
REFERENCES .............................................................................................................................12
INTRODUCTION
Finance is term that refers to a process of implementing proper management of monitory
resources of the company. The major motive of implementing finance is to maintain sufficient
amount of financial resources within the company and formulate effective strategies in such a
way so that company's financial position could be improved. Al Anwar ceramic is a company
that manufactures ceramic tiles in the Oman. The present stud includes a brief description of
overall business of Al Anwar ceramic company. Further it also includes a detailed analysis of
financial performance of the company.
Overview of company
Al Anwar ceramic is company which is specialised in manufacturing and distribution of
finest ceramic tiles. It was establish in the year 1998. The company uses different raw materials,
galzes, pigments, frits, etc. available in the local market. Currently its production capacity is 3.5
million square meter per annum. It is formulating its new plans and procedures in order to
increase its capacity to 17 million square meter per annum.
Investment summary
Al Anwar ceramic is an Oman based company. Thus, majority of its business depends
upon the demand of ceramic tiles and other products produced by it in the market of Oman
(Alian, Shinen and Ali, 2018). With the help of growing demand of ceramic tiles in Oman, the
company has become able to become one among the top three companies of the ceramic tiles
industry.Further, with the help of effective cost management, the company's profitability has also
been improved.
In addition, with the help of strong balance sheet and lower value of leverage, the
company is maintaining consistency in payment of dividend and develop more effective future
investment plans as well. By analysing financial statements of last few years, it can be states that
Al Anwar ceramic’s capability of paying dividend.
Key catalysts
Recently the company has become able to increase its capacity of production upto 3.5
million square meter per annum .Al Anwar ceramic is one the most leading tiles manufacturer
company of Oman.The latest objective of the company is to expand its business in Nizwa and
⊘ This is a preview!⊘
Do you want full access?
Subscribe today to unlock all pages.
Trusted by 1+ million students worldwide
expand its capacity to 17 million square meter per annum. The managers of company also have
formulated their plans and policies through which it would be able to minimise its cost and
improve the profitability as well.
Investment rationale
Increase in demand of Oman's building and construction sector results in driving the
demand of ceramic tiles of Al Anwar ceramic (Millan Cárdenas and et.al., 2017). As per annual
reports of Al Anwar ceramic, net income of the company rose to 69%. to OMR623K. Growth in
the ceramic tiles industry is more faster than the growth of GDP. Cement.
Further, the study also shows that the overall operating cash flow of the company
increased by 22.04 % recently. Thus, it can be analysed that Al Anwar ceramic is currently
performing efficiently in context to its financial performance.
Ratio analysis
Profitability ratios
Profitability ratio is one of the category of financial metrics which are applied for the
purpose of assessing the ability of company of generating earnings in relation to operating costs,
revenue, assets and equity by using a particular time period. In other words, it displays how
effectively the company has used its resources for generating its profits. It includes gross profit,
net profit ratios. The gross profit ratio entails the relationship between sales and gross profit of a
business. The GP ratio of Al Anwar ceramic company for the la32st few years have declined as it
was 51.70% in 2014 which has declined to 32.44% in the year 2019(1). While net profit ratio is
also depicting a declining trend over the last years. This means that company's effciciny has
decreased significantly.
Paraphrase This Document
Need a fresh take? Get an instant paraphrase of this document with our AI Paraphraser
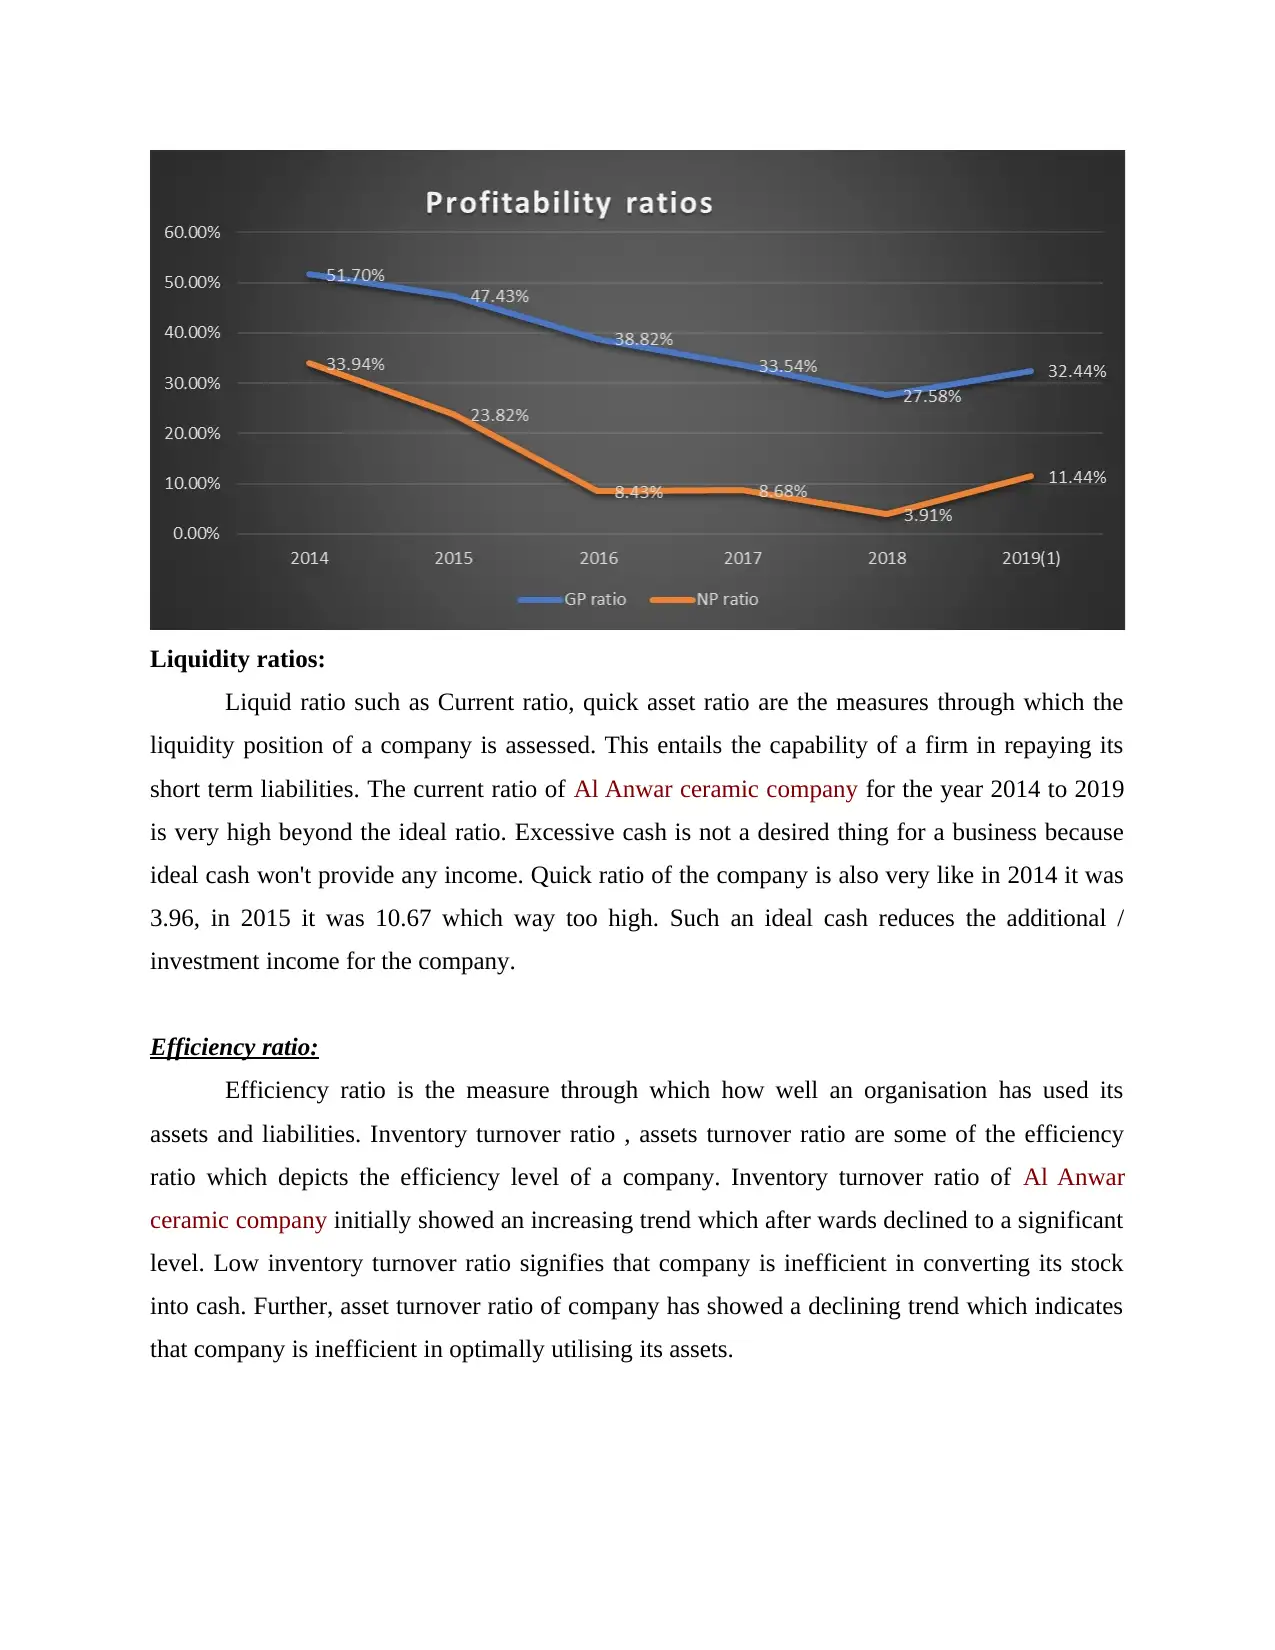
Liquidity ratios:
Liquid ratio such as Current ratio, quick asset ratio are the measures through which the
liquidity position of a company is assessed. This entails the capability of a firm in repaying its
short term liabilities. The current ratio of Al Anwar ceramic company for the year 2014 to 2019
is very high beyond the ideal ratio. Excessive cash is not a desired thing for a business because
ideal cash won't provide any income. Quick ratio of the company is also very like in 2014 it was
3.96, in 2015 it was 10.67 which way too high. Such an ideal cash reduces the additional /
investment income for the company.
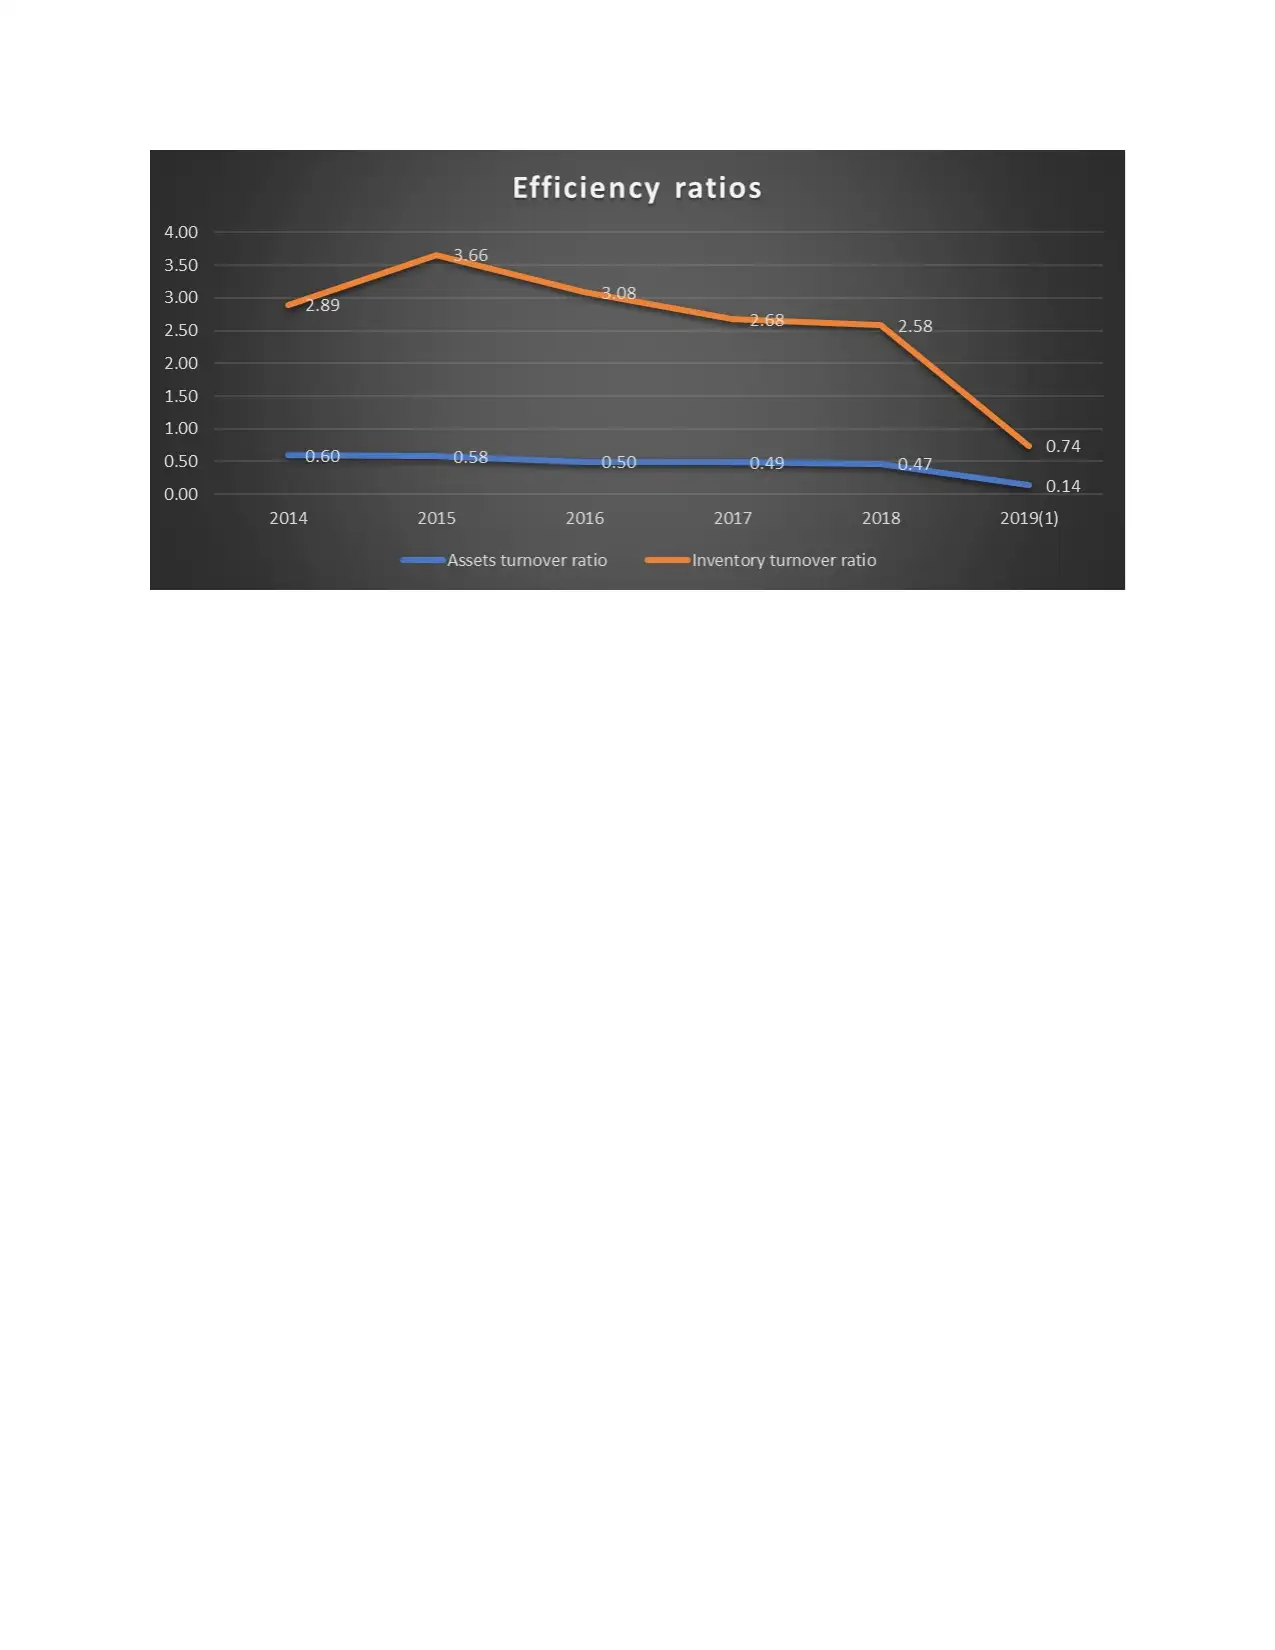
Efficiency ratio:
Efficiency ratio is the measure through which how well an organisation has used its
assets and liabilities. Inventory turnover ratio , assets turnover ratio are some of the efficiency
ratio which depicts the efficiency level of a company. Inventory turnover ratio of Al Anwar
ceramic company initially showed an increasing trend which after wards declined to a significant
level. Low inventory turnover ratio signifies that company is inefficient in converting its stock
into cash. Further, asset turnover ratio of company has showed a declining trend which indicates
that company is inefficient in optimally utilising its assets.
Liquid ratio such as Current ratio, quick asset ratio are the measures through which the
liquidity position of a company is assessed. This entails the capability of a firm in repaying its
short term liabilities. The current ratio of Al Anwar ceramic company for the year 2014 to 2019
is very high beyond the ideal ratio. Excessive cash is not a desired thing for a business because
ideal cash won't provide any income. Quick ratio of the company is also very like in 2014 it was
3.96, in 2015 it was 10.67 which way too high. Such an ideal cash reduces the additional /
investment income for the company.
Efficiency ratio:
Efficiency ratio is the measure through which how well an organisation has used its
assets and liabilities. Inventory turnover ratio , assets turnover ratio are some of the efficiency
ratio which depicts the efficiency level of a company. Inventory turnover ratio of Al Anwar
ceramic company initially showed an increasing trend which after wards declined to a significant
level. Low inventory turnover ratio signifies that company is inefficient in converting its stock
into cash. Further, asset turnover ratio of company has showed a declining trend which indicates
that company is inefficient in optimally utilising its assets.
⊘ This is a preview!⊘
Do you want full access?
Subscribe today to unlock all pages.
Trusted by 1+ million students worldwide
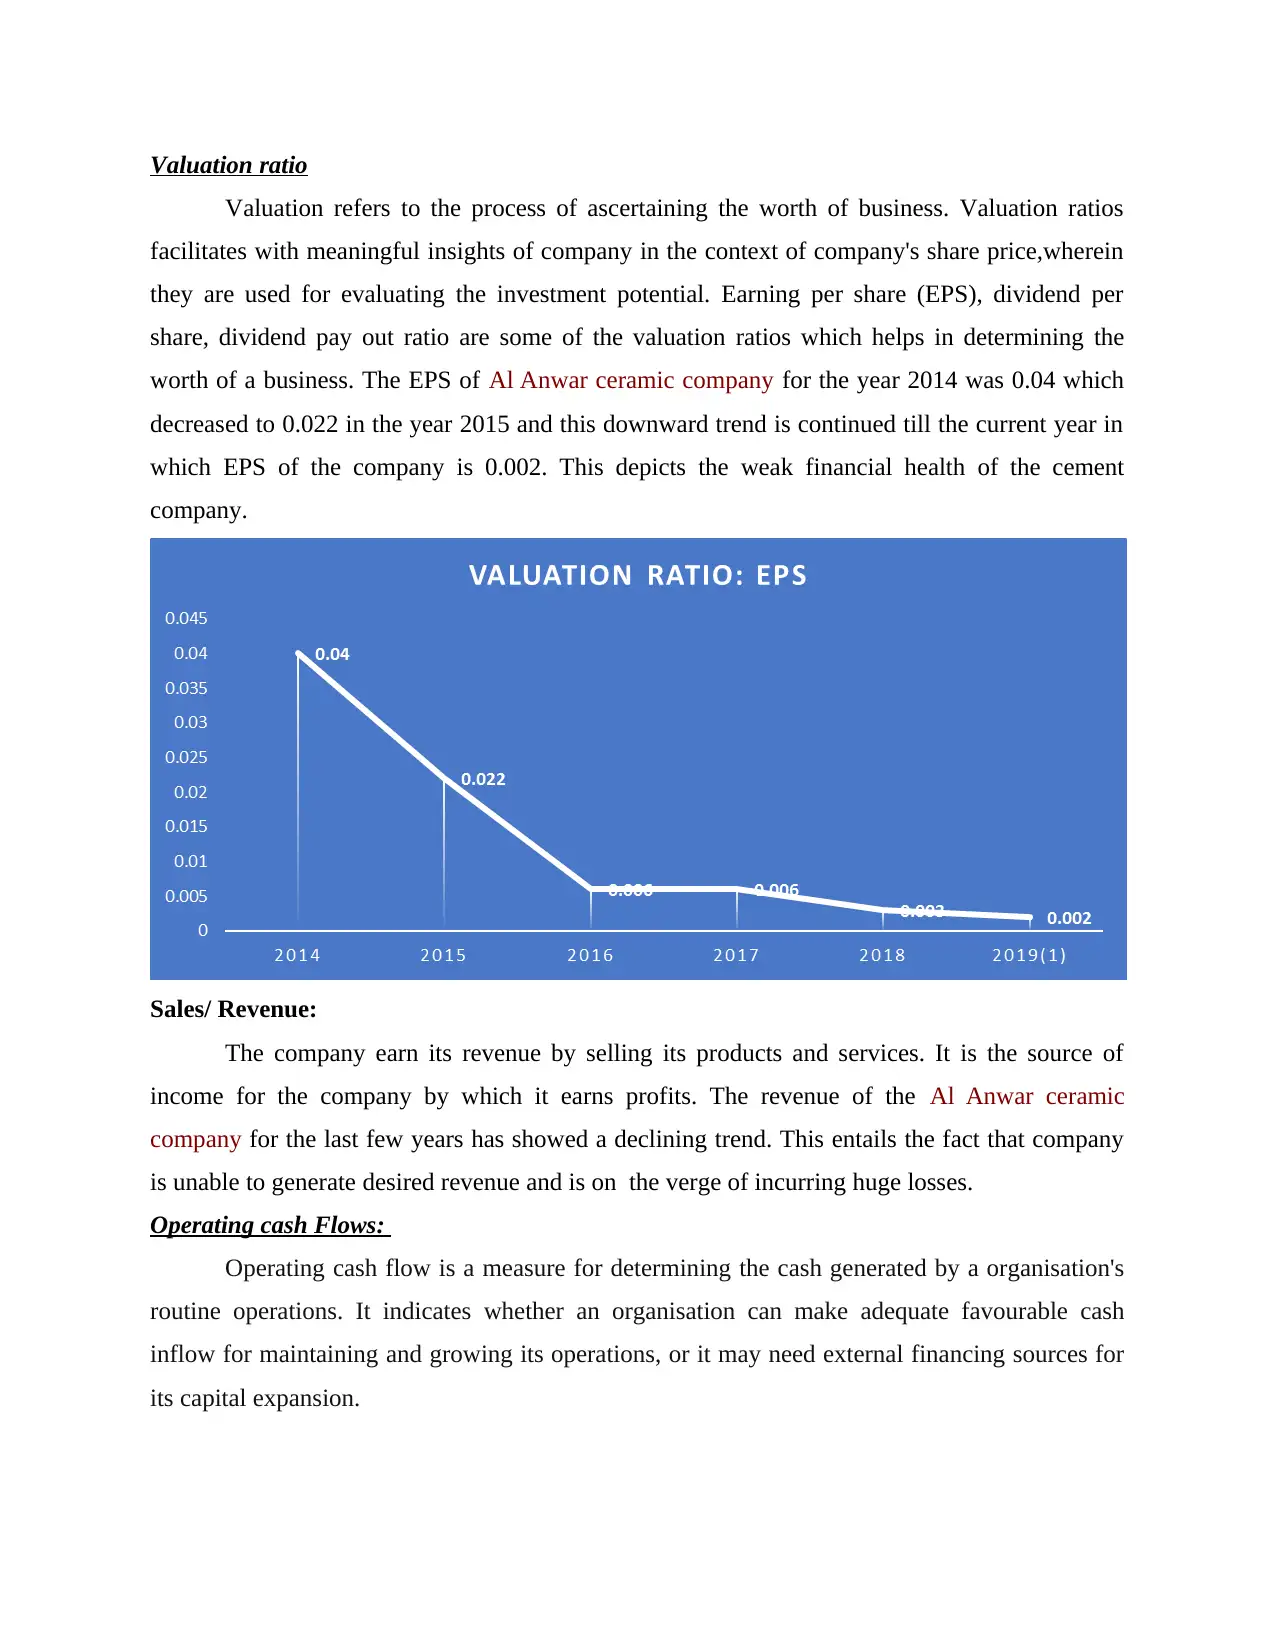
Valuation ratio
Valuation refers to the process of ascertaining the worth of business. Valuation ratios
facilitates with meaningful insights of company in the context of company's share price,wherein
they are used for evaluating the investment potential. Earning per share (EPS), dividend per
share, dividend pay out ratio are some of the valuation ratios which helps in determining the
worth of a business. The EPS of Al Anwar ceramic company for the year 2014 was 0.04 which
decreased to 0.022 in the year 2015 and this downward trend is continued till the current year in
which EPS of the company is 0.002. This depicts the weak financial health of the cement
company.
Sales/ Revenue:
The company earn its revenue by selling its products and services. It is the source of
income for the company by which it earns profits. The revenue of the Al Anwar ceramic
company for the last few years has showed a declining trend. This entails the fact that company
is unable to generate desired revenue and is on the verge of incurring huge losses.
Operating cash Flows:
Operating cash flow is a measure for determining the cash generated by a organisation's
routine operations. It indicates whether an organisation can make adequate favourable cash
inflow for maintaining and growing its operations, or it may need external financing sources for
its capital expansion.
Paraphrase This Document
Need a fresh take? Get an instant paraphrase of this document with our AI Paraphraser
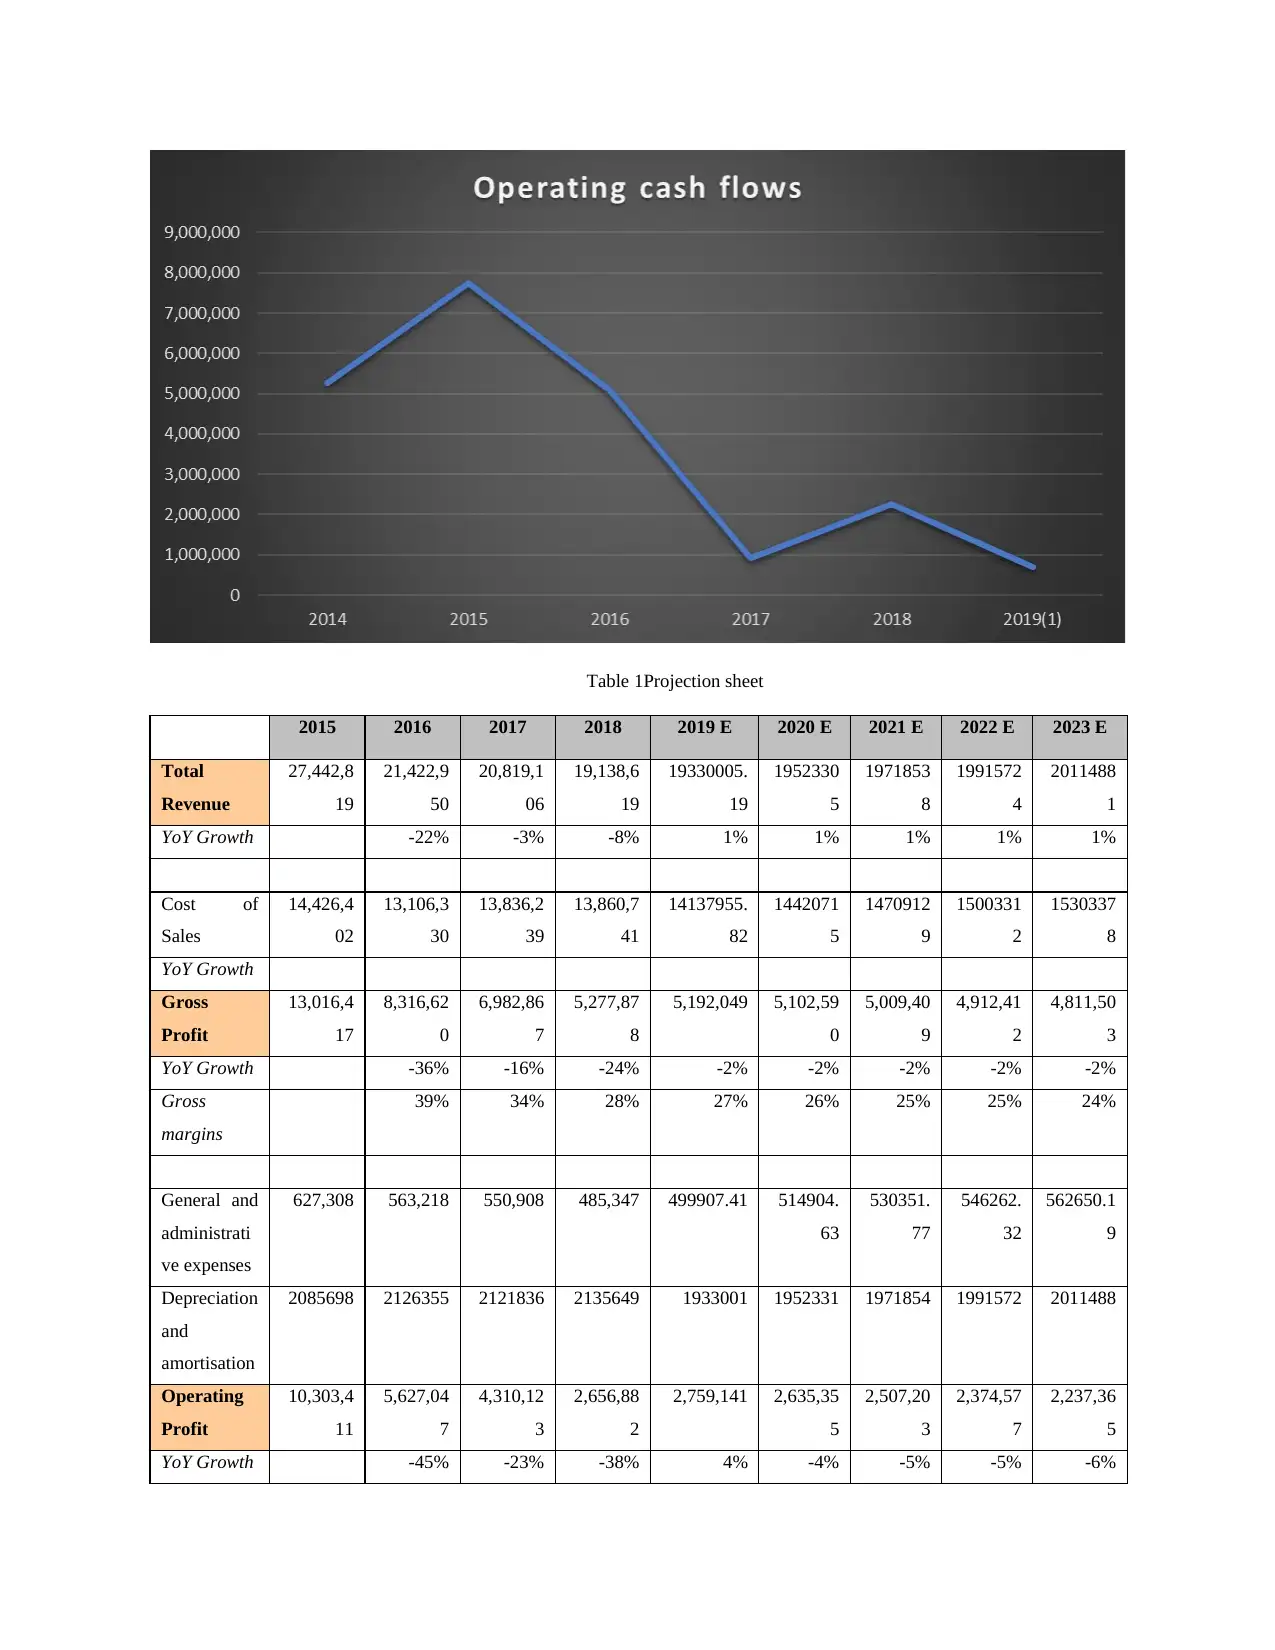
Table 1Projection sheet
2015 2016 2017 2018 2019 E 2020 E 2021 E 2022 E 2023 E
Total
Revenue
27,442,8
19
21,422,9
50
20,819,1
06
19,138,6
19
19330005.
19
1952330
5
1971853
8
1991572
4
2011488
1
YoY Growth -22% -3% -8% 1% 1% 1% 1% 1%
Cost of
Sales
14,426,4
02
13,106,3
30
13,836,2
39
13,860,7
41
14137955.
82
1442071
5
1470912
9
1500331
2
1530337
8
YoY Growth
Gross
Profit
13,016,4
17
8,316,62
0
6,982,86
7
5,277,87
8
5,192,049 5,102,59
0
5,009,40
9
4,912,41
2
4,811,50
3
YoY Growth -36% -16% -24% -2% -2% -2% -2% -2%
Gross
margins
39% 34% 28% 27% 26% 25% 25% 24%
General and
administrati
ve expenses
627,308 563,218 550,908 485,347 499907.41 514904.
63
530351.
77
546262.
32
562650.1
9
Depreciation
and
amortisation
2085698 2126355 2121836 2135649 1933001 1952331 1971854 1991572 2011488
Operating
Profit
10,303,4
11
5,627,04
7
4,310,12
3
2,656,88
2
2,759,141 2,635,35
5
2,507,20
3
2,374,57
7
2,237,36
5
YoY Growth -45% -23% -38% 4% -4% -5% -5% -6%
Operating
margins
EBITDA 8,217,71
3
3,500,69
2
2,188,28
7
521,233 826,141 683,025 535,350 383,005 225,876
YoY Growth -57% -37% -76% 58% -17% -22% -28% -41%
EBITDA
Margins
30% 16% 11% 3% 4% 3% 3% 2% 1%
Other
income
108,353 42,755 32,322 99,941 193300.05
19
195233.
05
197185.
38
199157.
24
201148.8
1
YoY Growth -61% -24% 209% 93% 1% 1% 1% 1%
Net
Investment
Income
0 0 0 0 0 0 0 0 0
Finance
income
331,118 370,255 9210149 8297403 5799002 5856992 5915561 5974717 6034464
Finance
costs
11,054 11,167 16,258 12225 11598 11714 11831 11949 12069
Finance
income /
(costs) – net
320,064 359,088 9,193,89
1
8,285,17
8
5,787,404 5,845,27
8
5,903,73
0
5,962,76
8
6,022,39
5
Profit
before
taxation
428,417 401,843 9,226,21
3
8,385,11
9
5,980,704 6,040,51
1
6,100,91
6
6,161,92
5
6,223,54
4
Tax expense 881,404 272,895 409,459 131,691 193300 195233 197185 199157 201149
Tax rate (in
%)
206% 68% 4% 2% 3% 3% 3% 3% 3%
Profit for
the year
-452,987 128,948 8,816,75
4
8,253,42
8
5,787,404 5,845,27
8
5,903,73
0
5,962,76
8
6,022,39
5
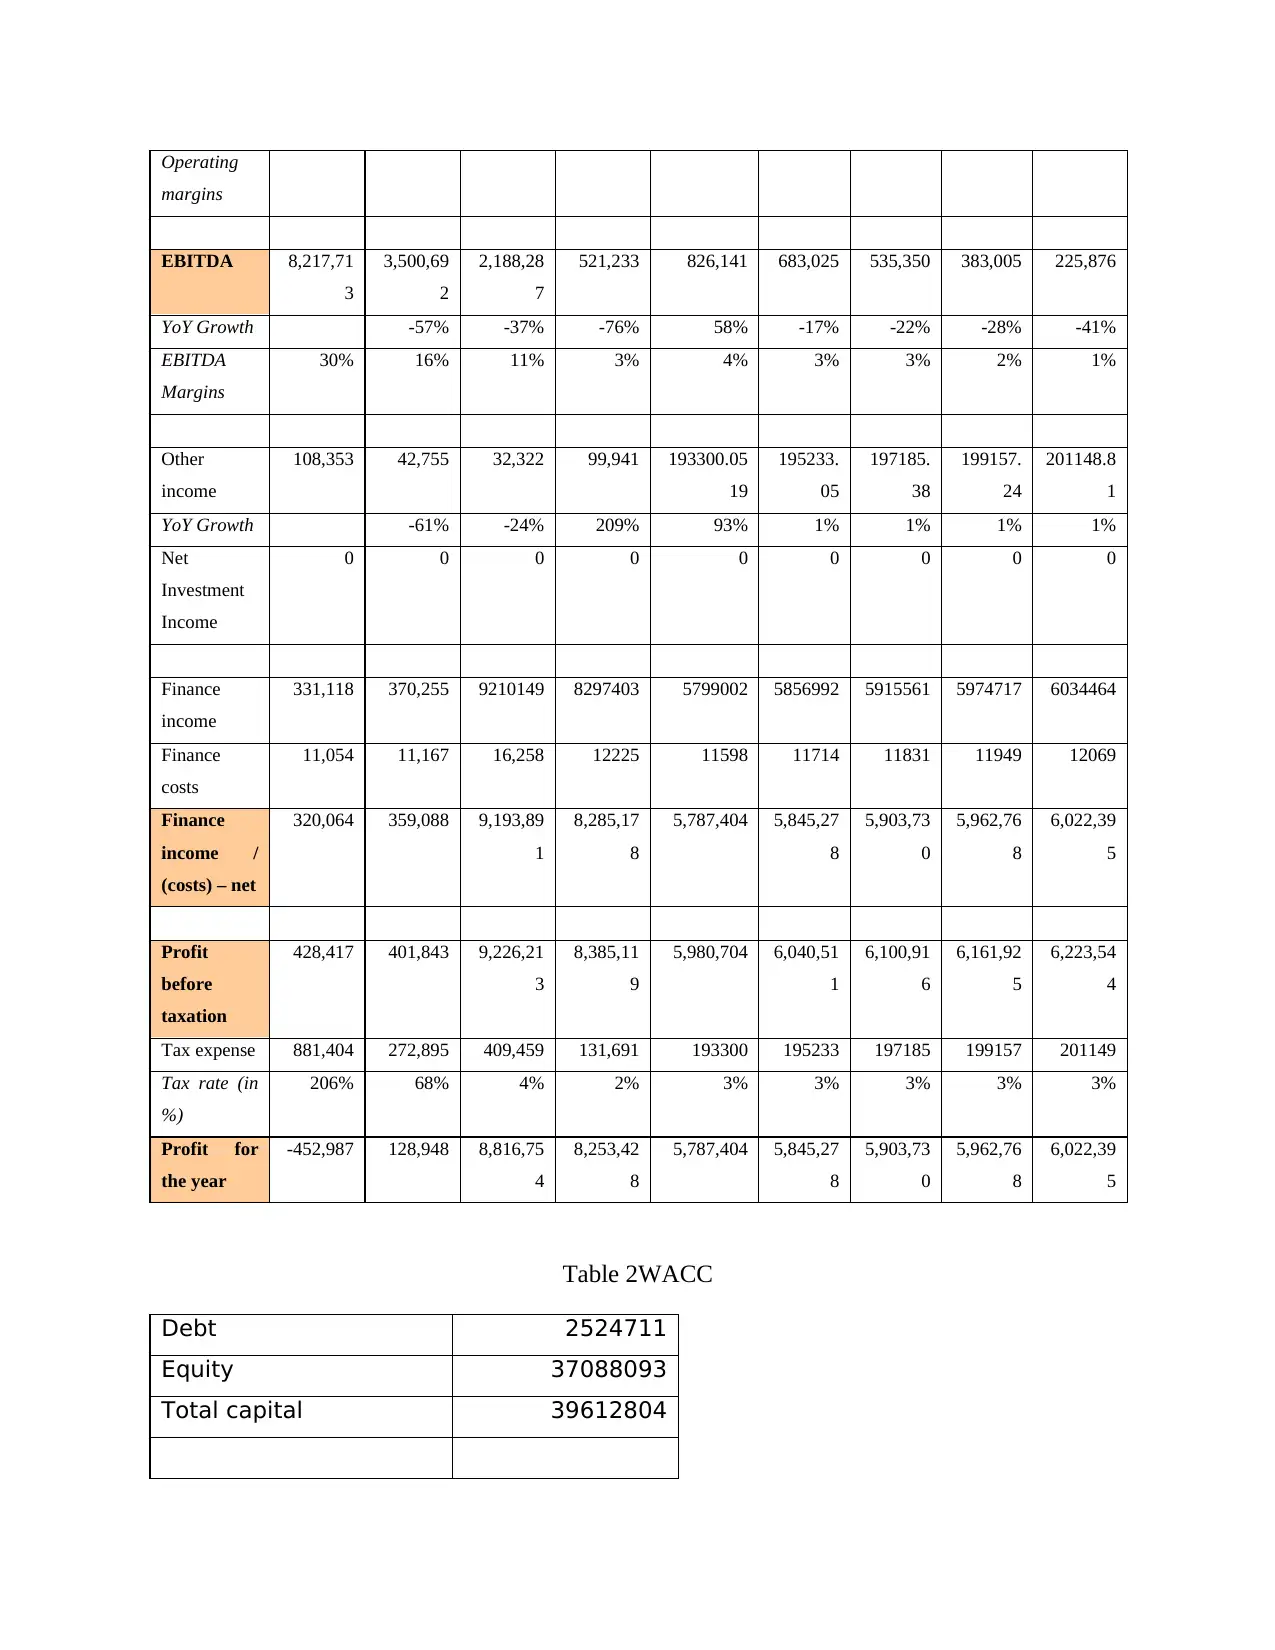
Table 2WACC
Debt 2524711
Equity 37088093
Total capital 39612804
margins
EBITDA 8,217,71
3
3,500,69
2
2,188,28
7
521,233 826,141 683,025 535,350 383,005 225,876
YoY Growth -57% -37% -76% 58% -17% -22% -28% -41%
EBITDA
Margins
30% 16% 11% 3% 4% 3% 3% 2% 1%
Other
income
108,353 42,755 32,322 99,941 193300.05
19
195233.
05
197185.
38
199157.
24
201148.8
1
YoY Growth -61% -24% 209% 93% 1% 1% 1% 1%
Net
Investment
Income
0 0 0 0 0 0 0 0 0
Finance
income
331,118 370,255 9210149 8297403 5799002 5856992 5915561 5974717 6034464
Finance
costs
11,054 11,167 16,258 12225 11598 11714 11831 11949 12069
Finance
income /
(costs) – net
320,064 359,088 9,193,89
1
8,285,17
8
5,787,404 5,845,27
8
5,903,73
0
5,962,76
8
6,022,39
5
Profit
before
taxation
428,417 401,843 9,226,21
3
8,385,11
9
5,980,704 6,040,51
1
6,100,91
6
6,161,92
5
6,223,54
4
Tax expense 881,404 272,895 409,459 131,691 193300 195233 197185 199157 201149
Tax rate (in
%)
206% 68% 4% 2% 3% 3% 3% 3% 3%
Profit for
the year
-452,987 128,948 8,816,75
4
8,253,42
8
5,787,404 5,845,27
8
5,903,73
0
5,962,76
8
6,022,39
5
Table 2WACC
Debt 2524711
Equity 37088093
Total capital 39612804
⊘ This is a preview!⊘
Do you want full access?
Subscribe today to unlock all pages.
Trusted by 1+ million students worldwide
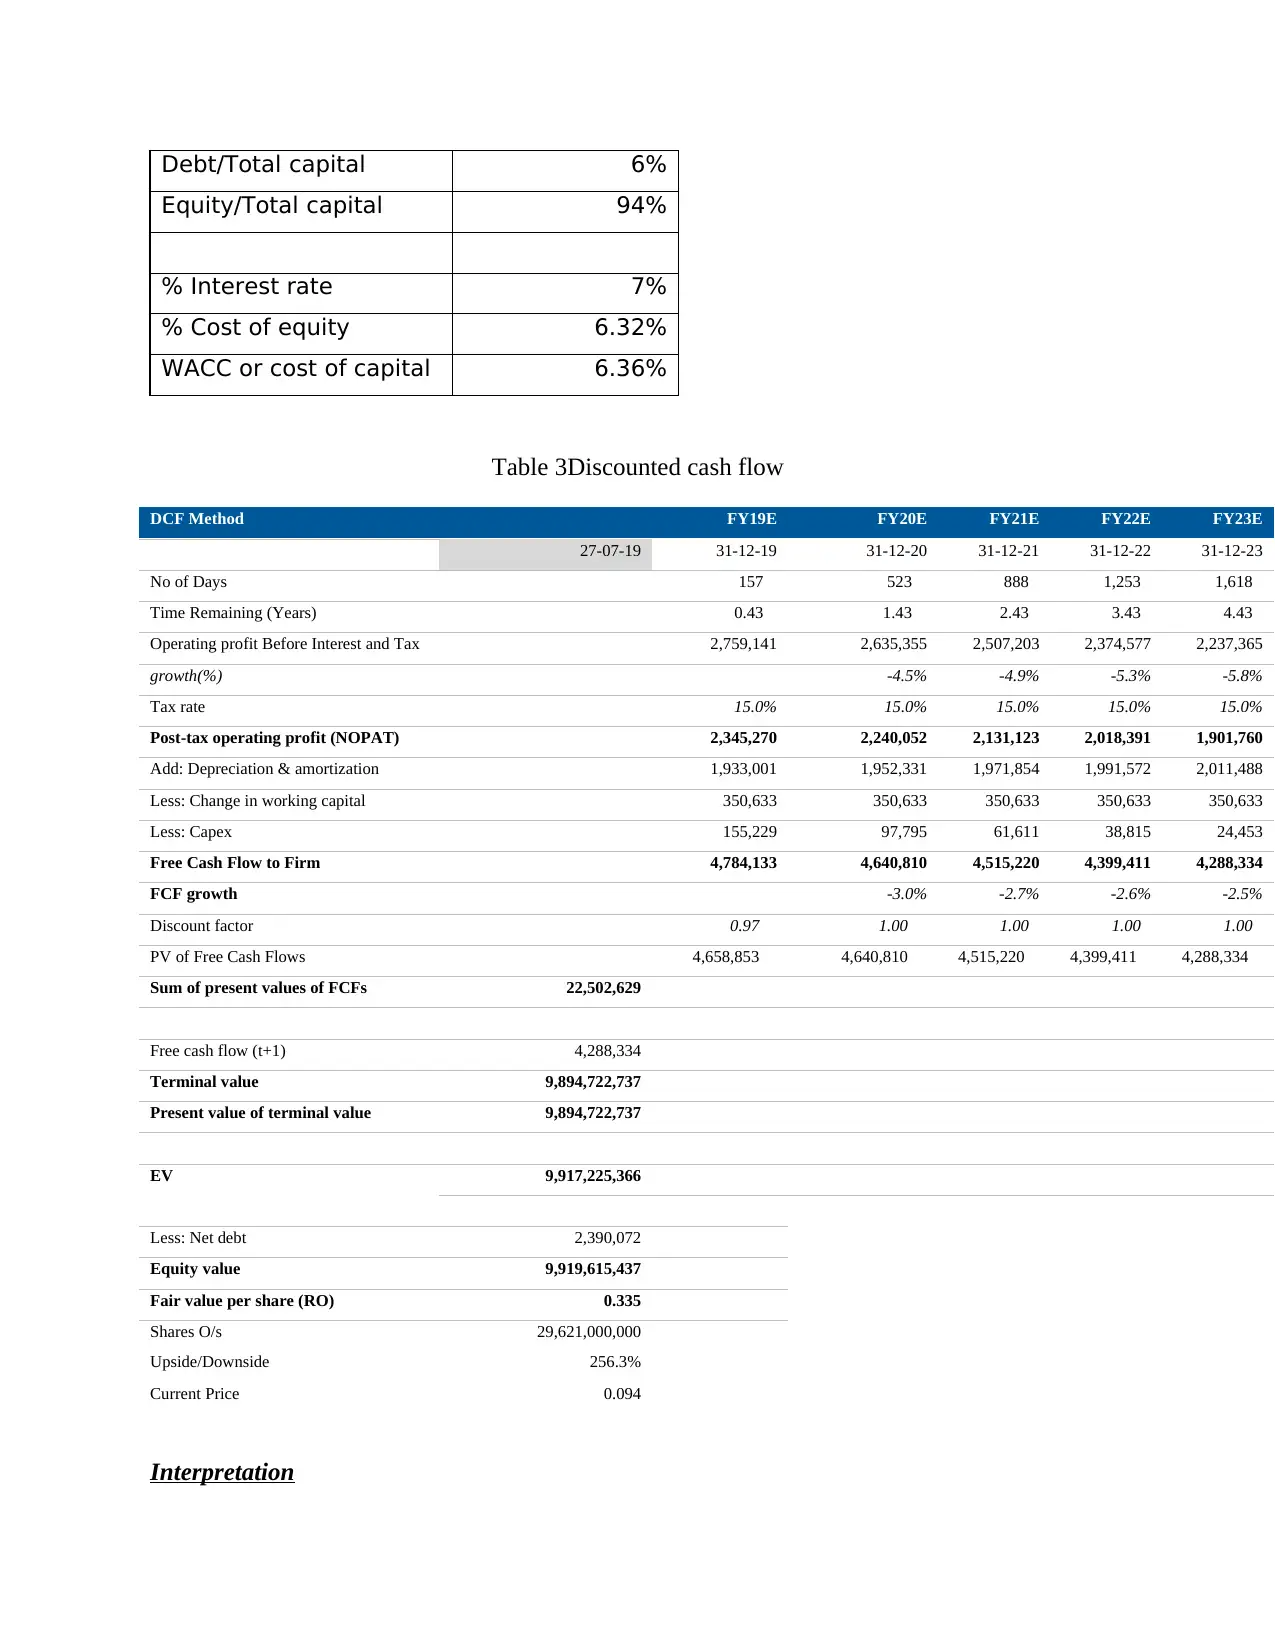
Debt/Total capital 6%
Equity/Total capital 94%
% Interest rate 7%
% Cost of equity 6.32%
WACC or cost of capital 6.36%
Table 3Discounted cash flow
DCF Method FY19E FY20E FY21E FY22E FY23E
27-07-19 31-12-19 31-12-20 31-12-21 31-12-22 31-12-23
No of Days 157 523 888 1,253 1,618
Time Remaining (Years) 0.43 1.43 2.43 3.43 4.43
Operating profit Before Interest and Tax 2,759,141 2,635,355 2,507,203 2,374,577 2,237,365
growth(%) -4.5% -4.9% -5.3% -5.8%
Tax rate 15.0% 15.0% 15.0% 15.0% 15.0%
Post-tax operating profit (NOPAT) 2,345,270 2,240,052 2,131,123 2,018,391 1,901,760
Add: Depreciation & amortization 1,933,001 1,952,331 1,971,854 1,991,572 2,011,488
Less: Change in working capital 350,633 350,633 350,633 350,633 350,633
Less: Capex 155,229 97,795 61,611 38,815 24,453
Free Cash Flow to Firm 4,784,133 4,640,810 4,515,220 4,399,411 4,288,334
FCF growth -3.0% -2.7% -2.6% -2.5%
Discount factor 0.97 1.00 1.00 1.00 1.00
PV of Free Cash Flows 4,658,853 4,640,810 4,515,220 4,399,411 4,288,334
Sum of present values of FCFs 22,502,629
Free cash flow (t+1) 4,288,334
Terminal value 9,894,722,737
Present value of terminal value 9,894,722,737
EV 9,917,225,366
Less: Net debt 2,390,072
Equity value 9,919,615,437
Fair value per share (RO) 0.335
Shares O/s 29,621,000,000
Upside/Downside 256.3%
Current Price 0.094
Interpretation
Paraphrase This Document
Need a fresh take? Get an instant paraphrase of this document with our AI Paraphraser
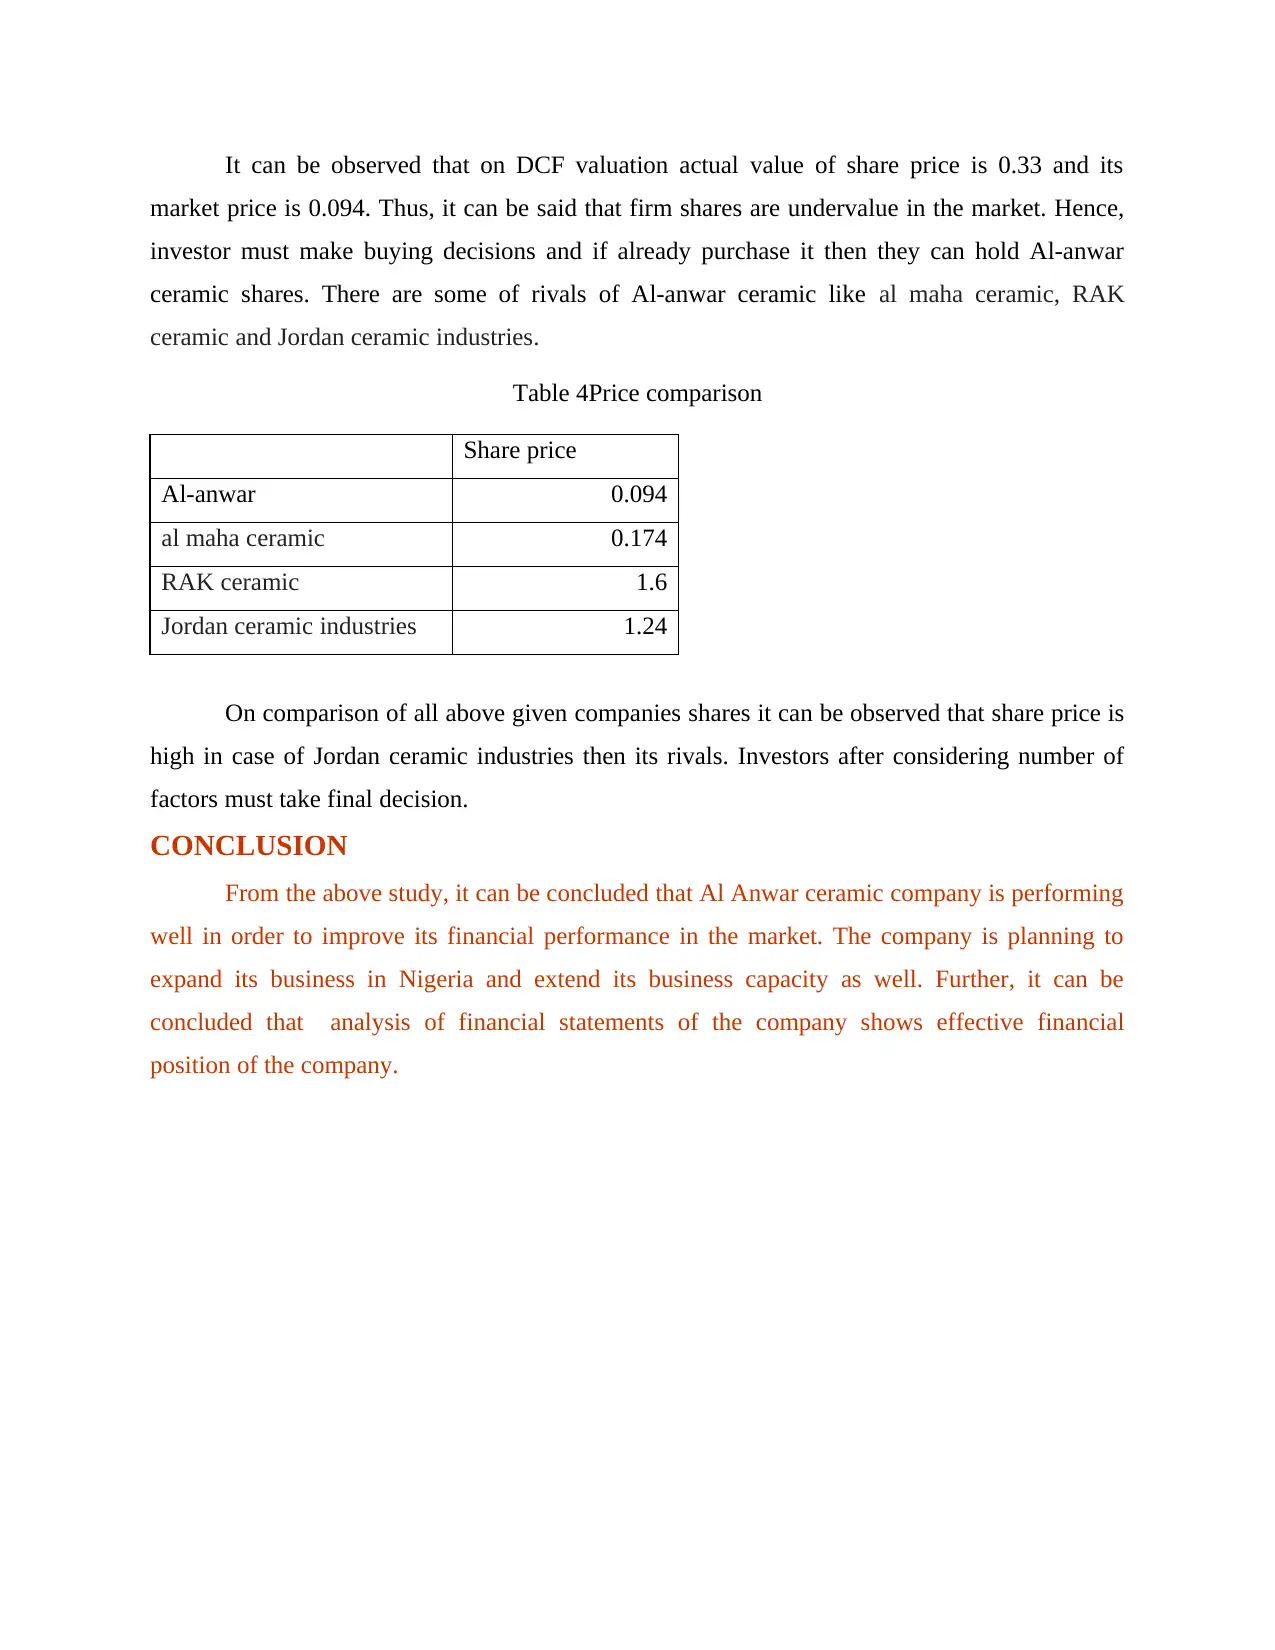
It can be observed that on DCF valuation actual value of share price is 0.33 and its
market price is 0.094. Thus, it can be said that firm shares are undervalue in the market. Hence,
investor must make buying decisions and if already purchase it then they can hold Al-anwar
ceramic shares. There are some of rivals of Al-anwar ceramic like al maha ceramic, RAK
ceramic and Jordan ceramic industries.
Table 4Price comparison
Share price
Al-anwar 0.094
al maha ceramic 0.174
RAK ceramic 1.6
Jordan ceramic industries 1.24
On comparison of all above given companies shares it can be observed that share price is
high in case of Jordan ceramic industries then its rivals. Investors after considering number of
factors must take final decision.
CONCLUSION
From the above study, it can be concluded that Al Anwar ceramic company is performing
well in order to improve its financial performance in the market. The company is planning to
expand its business in Nigeria and extend its business capacity as well. Further, it can be
concluded that analysis of financial statements of the company shows effective financial
position of the company.
REFERENCES
Books and Journals
Alian, N. K., Shinen, M. H. and Ali, A. H., 2018. Modification of Dielectric Strength of Iraqi
Kaolin by the Addition of Micro and Nano Zirconia. Journal of University of Babylon for
Pure and Applied Sciences, 26(7), pp.284-268.
Millan Cárdenas, A. and et.al., 2017. Effect of MDP-containing silane and adhesive used alone
or in combination on the long-term bond strength and chemical interaction with Lithium
Disilicate Ceramics.
⊘ This is a preview!⊘
Do you want full access?
Subscribe today to unlock all pages.
Trusted by 1+ million students worldwide
1 out of 12


Your All-in-One AI-Powered Toolkit for Academic Success.
+13062052269
info@desklib.com
Available 24*7 on WhatsApp / Email
![[object Object]](/_next/static/media/star-bottom.7253800d.svg)
Unlock your academic potential
Copyright © 2020–2026 A2Z Services. All Rights Reserved. Developed and managed by ZUCOL.