Analyzing Alchimist Ltd's Financial Statements and Performance
VerifiedAdded on 2020/01/23
|12
|2622
|220
Report
AI Summary
This report presents a comprehensive financial analysis of Alchimist Ltd, a small private limited company specializing in perfumes, lotions, and candles. The analysis examines the company's Statements of Comprehensive Income (SOCI), Statements of Financial Position (SOFP), and Statements of Cash Flow (SOCF) for the year 2015, focusing on revenue trends, profitability, and cash flow management. The report delves into the impact of new online stores and hotel chain contracts on revenue, the interpretation of key financial ratios like gross profit and net profit, and the implications of non-current assets and Redstone's proposed investment. Furthermore, it discusses the impact of out-of-fashion products on financial statements, the reasons behind negative cash flow from operating activities, and the calculation of relevant ratios. The report concludes with a professional assessment for Redstone's board of directors, recommending an investment based on Alchimist's sound financial performance.
UNDERSTANDING
FINANCIAL
STATEMENTS
FINANCIAL
STATEMENTS
Paraphrase This Document
Need a fresh take? Get an instant paraphrase of this document with our AI Paraphraser
Table of Contents
INTRODUCTION......................................................................................................................1
QUESTION 1 Features of Alchmists's financial statements......................................................1
a) Secure long term debt and hired administrator to oversee and co-ordinate the contract...1
b) Linkage between three primary financial statements........................................................1
c) Fashionable and out of fashion products...........................................................................2
QUESTION 2 Interpretation of SOCI........................................................................................2
a) Revenue.............................................................................................................................2
b) Gross profit (GP)...............................................................................................................5
c) Other SOCI's costs.............................................................................................................5
d) Net profit (NP)..................................................................................................................6
QUESTION 3 Interpretation of Alchimist's SOFP....................................................................7
a) Non-current assets.............................................................................................................7
b) Redstone proposed investment..........................................................................................8
QUESTION 4 Interpretation of SOCF.......................................................................................8
a) Three reasons for negative cash flow from operating activities........................................8
b) Two ratios from SOCF......................................................................................................8
QUESTION 5 Professional report..............................................................................................9
CONCLUSION..........................................................................................................................9
REFERENCES.........................................................................................................................10
Illustration Index
Illustration 1: Movement in total revenues.................................................................................3
Illustration 2: Revenue movement of retail operations .............................................................4
Illustration 3: Segmental revenues in the year 2015..................................................................4
Illustration 4: Trend line for distribution and transportation costs.............................................6
Illustration 5: Trend line for Royalties.......................................................................................6
INTRODUCTION
Alchimist Ltd, is a small sized private limited company that manufactures and sell its
own branded perfumes, lotions and candles to the public and to other large retail companies.
In the year 2015, it developed on-line stores and hotel chain contracts to enlarge its revenues
and profitability as well. The present report will helps us to determine the financial
performance of the firm through evaluation and examination of its financial statements.
QUESTION 1 FEATURES OF ALCHMISTS'S FINANCIAL
STATEMENTS
a) Secure long term debt and hired administrator to oversee and co-ordinate the contract
(1). Relationship of the description with SOCI and SOFP
1st description is related to SOFP because in this, it has been said that Alchimist is
able to secure long term bank funding. While, other description is linked with SOCI because
administrator has been hired to oversee and co-ordinate the contract with the company's
management.
(2). Allocation of both the transactions
1st Statement can be related to the long term borrowings of £412 which tells that firm
is able to take additional borrowings through bank. While, 2nd description is related to the
administration expenses in SOCI. It comprises employee expenses that are providing services
within and outside UK.
b) Linkage between three primary financial statements
Alchimist's SOCI feeds into the SOFP
From the SOCI, Alchimist's net profit of £405 and £227 has been transferred into
SOFP as retained earnings. With this, total invested share capital has been affected.
Alchimist's SOFP feeds into the SOCF
From the SOFP, difference between current assets such as receivables, inventories
and difference in current liabilities such as payables has been recorded in Alchimist's SOCF
under operating activities (Khan and Bradbury, 2014). Moreover, purchase and sales of fixed
assets such as PPE and investment in new product development has been reported a investing
activities. However, purchase and sales of debt and equity has been recorded into financing
activities.
Alchimist's SOCI feeds into the SOCF
⊘ This is a preview!⊘
Do you want full access?
Subscribe today to unlock all pages.
Trusted by 1+ million students worldwide
From the SOCI, payment in terms of income tax, interest and dividend has been
recorded into SOCF under operating activities. Moreover, non cash affecting transactions
also have been adjusted in operating activities of SOCF such as depreciation worth £52 and
£40 in 2014 and 2015.
c) Fashionable and out of fashion products
IAS 2 for inventory valuation
According to IAS 2, inventory should be recognized at costs or net realisable value,
which ever is lower (Brochet, Jagolinzer and Riedl, 2013.).
Recognition criteria in the regulatory framework
As per this, inventory costs accumulates purchasing cost, conversion cost and other
expenses incurred in bringing goods to their selling conditions. However, net realisable value
refers to expected revenues that can be earned through selling the inventory.
Impact of out of fashion products on SOCI and SOFP
Products that had gone out of fashion will be recognised at net realisable value.
Hence, it will reduce Alchimist's profit in SOCI and closing inventory in SOFP results in
lowering current assets.
QUESTION 2 INTERPRETATION OF SOCI
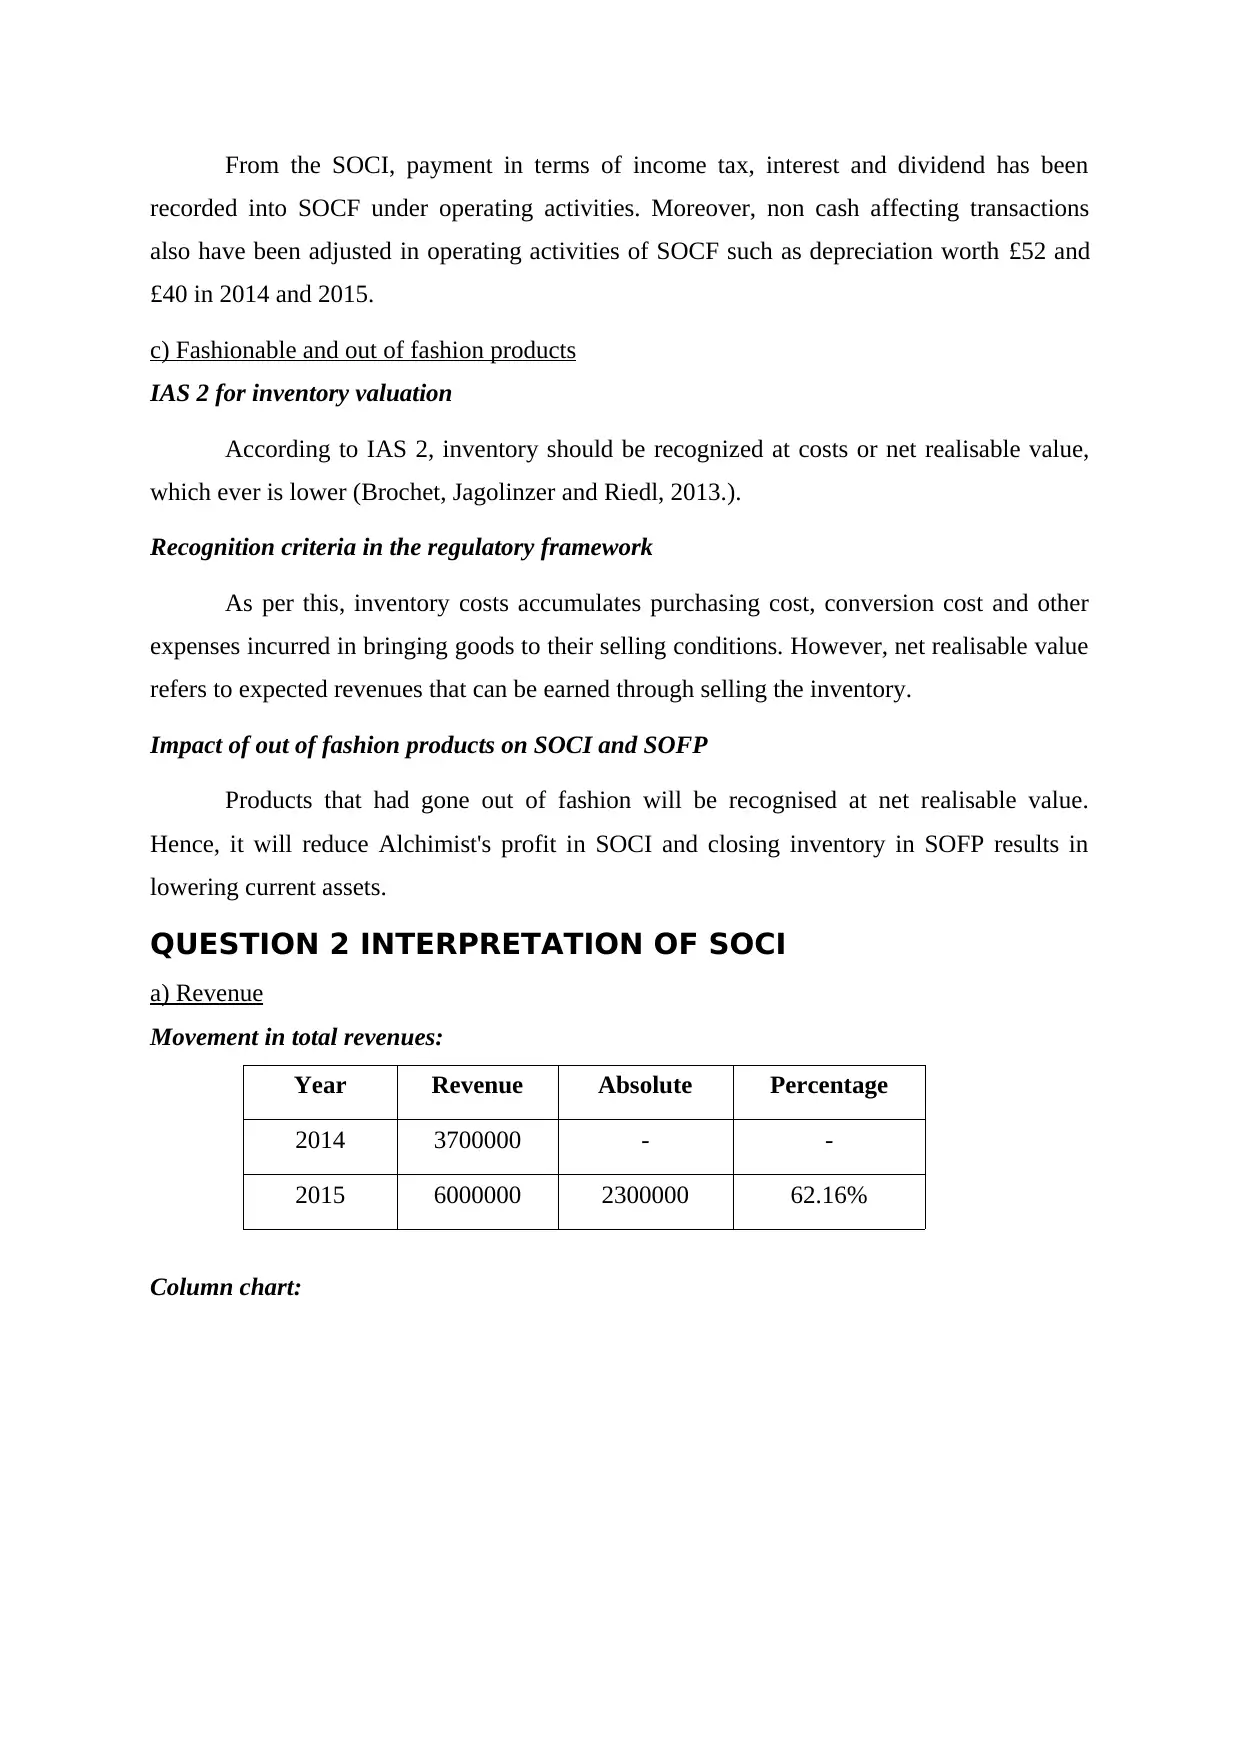
a) Revenue
Movement in total revenues:
Year Revenue Absolute Percentage
2014 3700000 - -
2015 6000000 2300000 62.16%
Column chart:
recorded into SOCF under operating activities. Moreover, non cash affecting transactions
also have been adjusted in operating activities of SOCF such as depreciation worth £52 and
£40 in 2014 and 2015.
c) Fashionable and out of fashion products
IAS 2 for inventory valuation
According to IAS 2, inventory should be recognized at costs or net realisable value,
which ever is lower (Brochet, Jagolinzer and Riedl, 2013.).
Recognition criteria in the regulatory framework
As per this, inventory costs accumulates purchasing cost, conversion cost and other
expenses incurred in bringing goods to their selling conditions. However, net realisable value
refers to expected revenues that can be earned through selling the inventory.
Impact of out of fashion products on SOCI and SOFP
Products that had gone out of fashion will be recognised at net realisable value.
Hence, it will reduce Alchimist's profit in SOCI and closing inventory in SOFP results in
lowering current assets.
QUESTION 2 INTERPRETATION OF SOCI
a) Revenue
Movement in total revenues:
Year Revenue Absolute Percentage
2014 3700000 - -
2015 6000000 2300000 62.16%
Column chart:
Paraphrase This Document
Need a fresh take? Get an instant paraphrase of this document with our AI Paraphraser
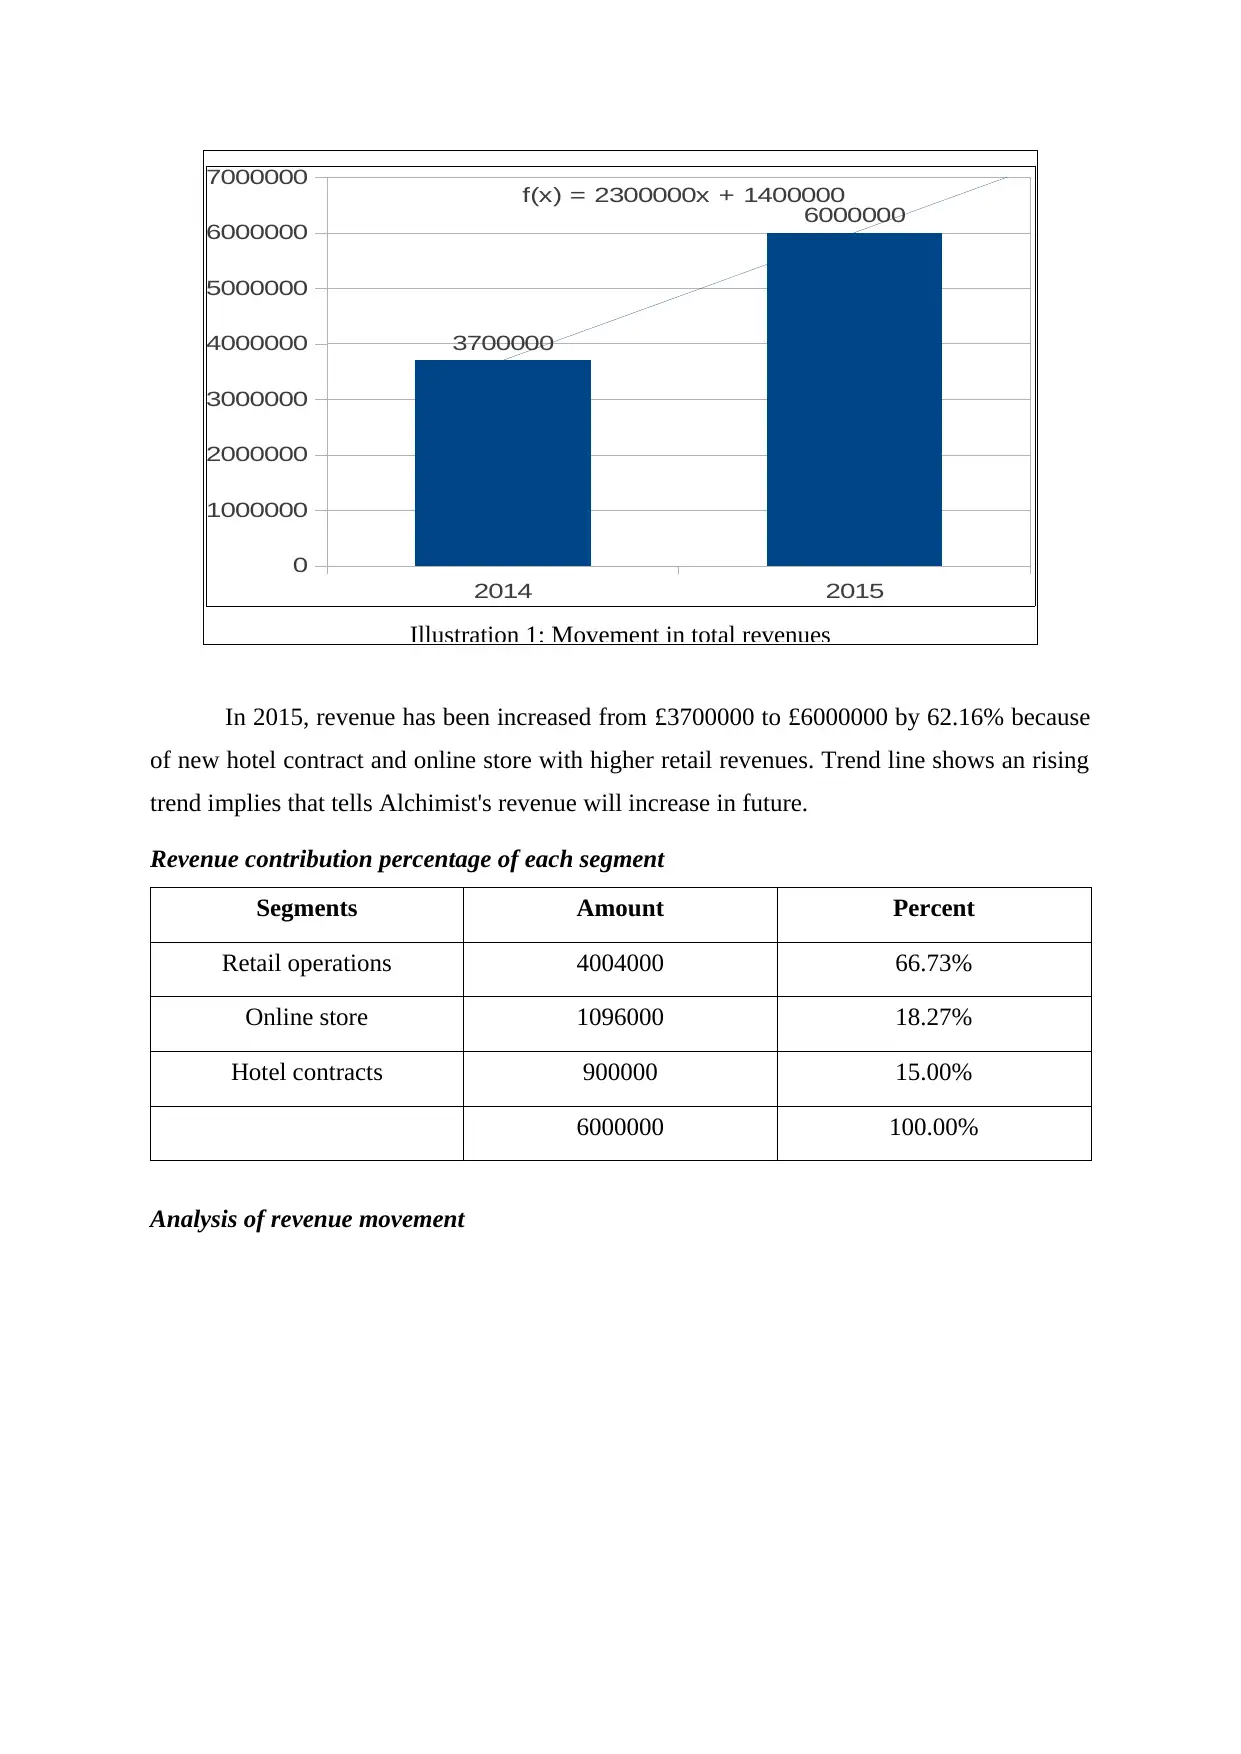
In 2015, revenue has been increased from £3700000 to £6000000 by 62.16% because
of new hotel contract and online store with higher retail revenues. Trend line shows an rising
trend implies that tells Alchimist's revenue will increase in future.
Revenue contribution percentage of each segment
Segments Amount Percent
Retail operations 4004000 66.73%
Online store 1096000 18.27%
Hotel contracts 900000 15.00%
6000000 100.00%
Analysis of revenue movement
2014 2015
0
1000000
2000000
3000000
4000000
5000000
6000000
7000000
3700000
6000000
f(x) = 2300000x + 1400000
Illustration 1: Movement in total revenues
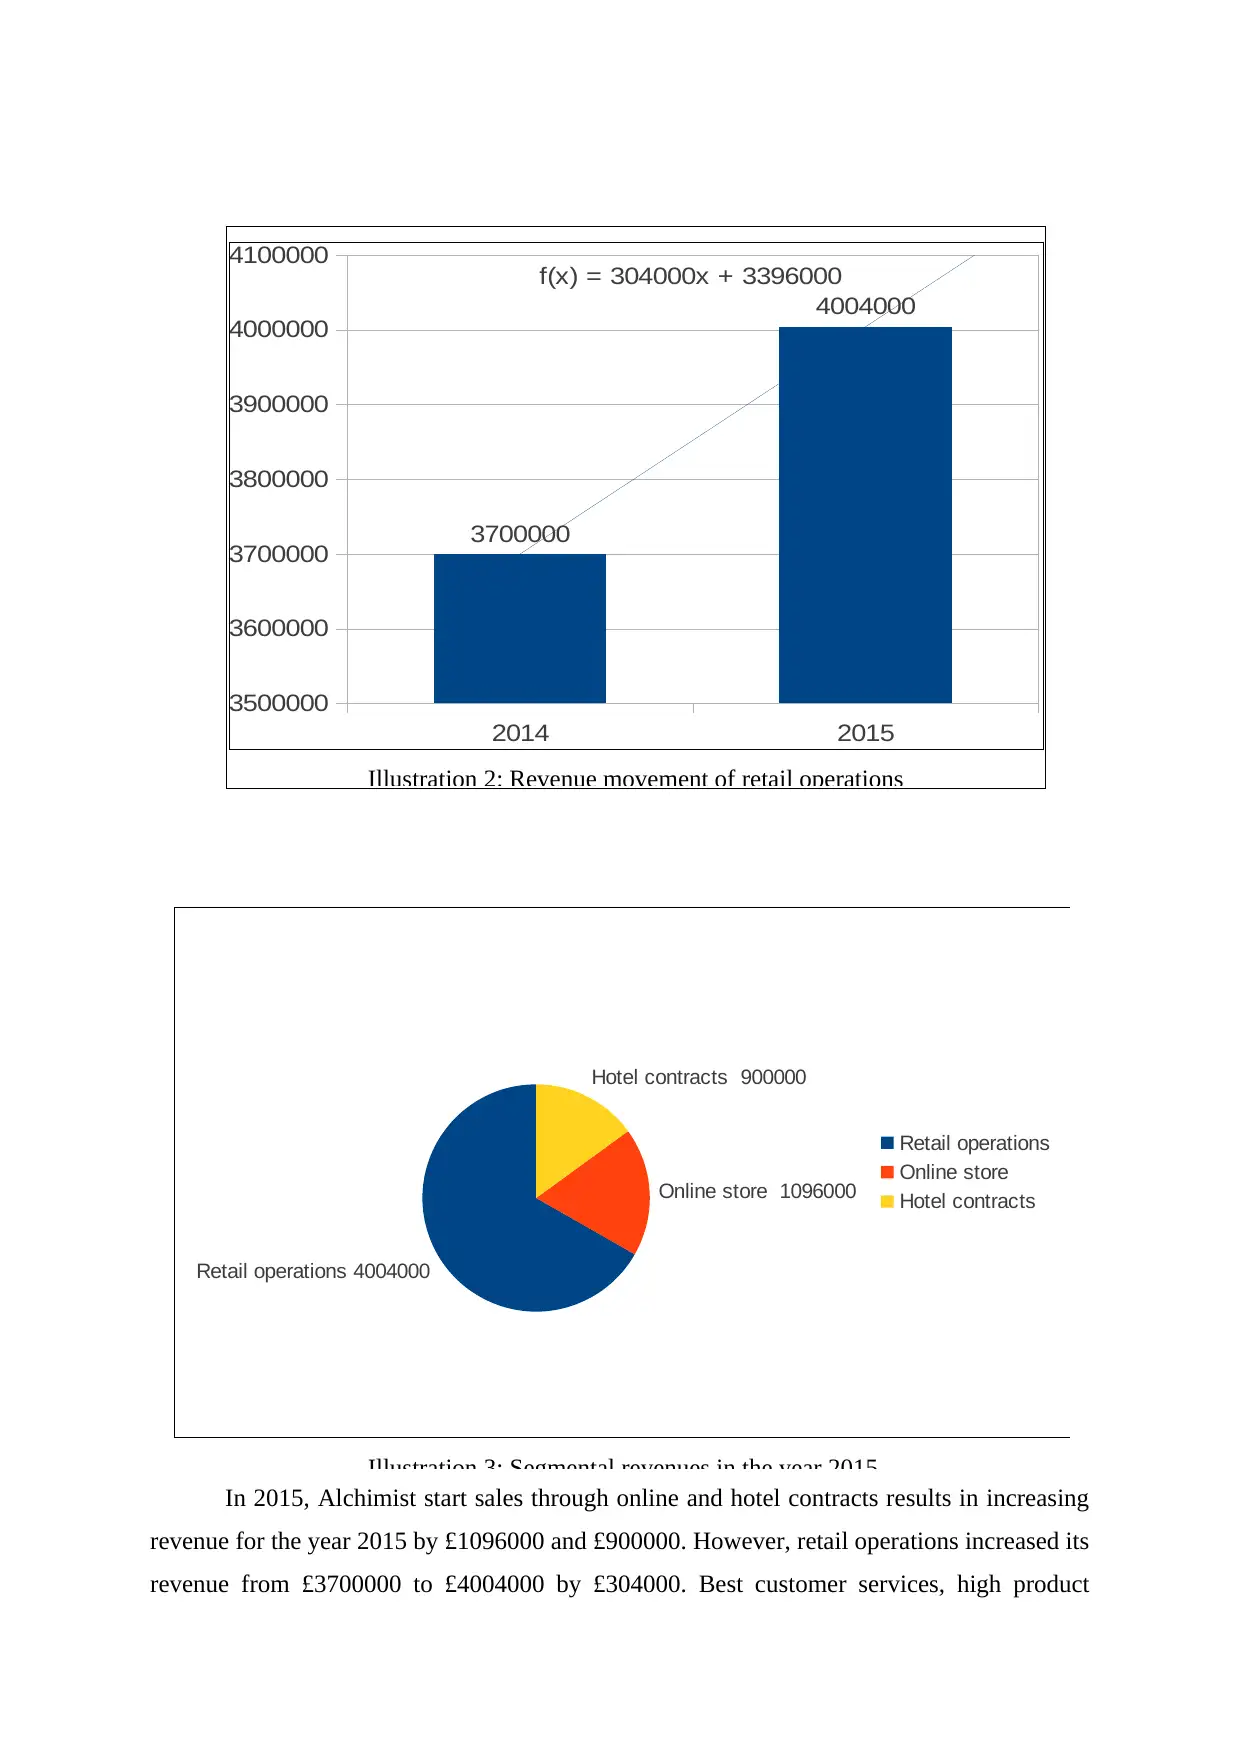
In 2015, Alchimist start sales through online and hotel contracts results in increasing
revenue for the year 2015 by £1096000 and £900000. However, retail operations increased its
revenue from £3700000 to £4004000 by £304000. Best customer services, high product
2014 2015
3500000
3600000
3700000
3800000
3900000
4000000
4100000
3700000
4004000
f(x) = 304000x + 3396000
Illustration 2: Revenue movement of retail operations
Retail operations 4004000
Online store 1096000
Hotel contracts 900000
Retail operations
Online store
Hotel contracts
Illustration 3: Segmental revenues in the year 2015
⊘ This is a preview!⊘
Do you want full access?
Subscribe today to unlock all pages.
Trusted by 1+ million students worldwide
price, high customer demand and higher units sales may be the reason behind inclined
revenues (Petersen and Plenborg, 2010).
Additional information
Additional information such as gearing ratio and interest coverage ratio will also be
useful to determine the level of risk associated with Redstone's potential investment.
Moreover, ROCE and dividend rate also helps to determine Alchimist's ability to earn return
on invested capital. It helps to determine the expected earnings on Redstone's investment.
b) Gross profit (GP)
Meaning
It tells that how much amount Alchimist has earned on its total revenue through its
mark-up (Delen, Kuzey and Uyar, 2013). Further, it tells the percentage difference between
cost of sales and sales on Alchimist's total revenue.
Segmental GP ratio
Gross profit ratio = Gross profit/Total revenues*100
Hotel contract's GP
It is too much higher than other segments because of product branding which enable
sales directors to sell the product at premium prices. One example is Tincture product that
cost is £35 and normally sold at £50 but due to Badngolo logo, it has been sold at £62.
c) Other SOCI's costs
Cost of sales and overheads
Cost of sales combines all the expenses that directly can be allocated to product such
as purchase, carriage inward, octroi, import duty etc (Schoenebeck and Holtzman, 2013).
While, overhead comprises all the indirect expenses that are not directly related to the
products such as office expense and distribution costs.
Distribution and transportation costs and royalty costs
Paraphrase This Document
Need a fresh take? Get an instant paraphrase of this document with our AI Paraphraser
Trend line for distribution and transportation costs
Trend line for Royalties
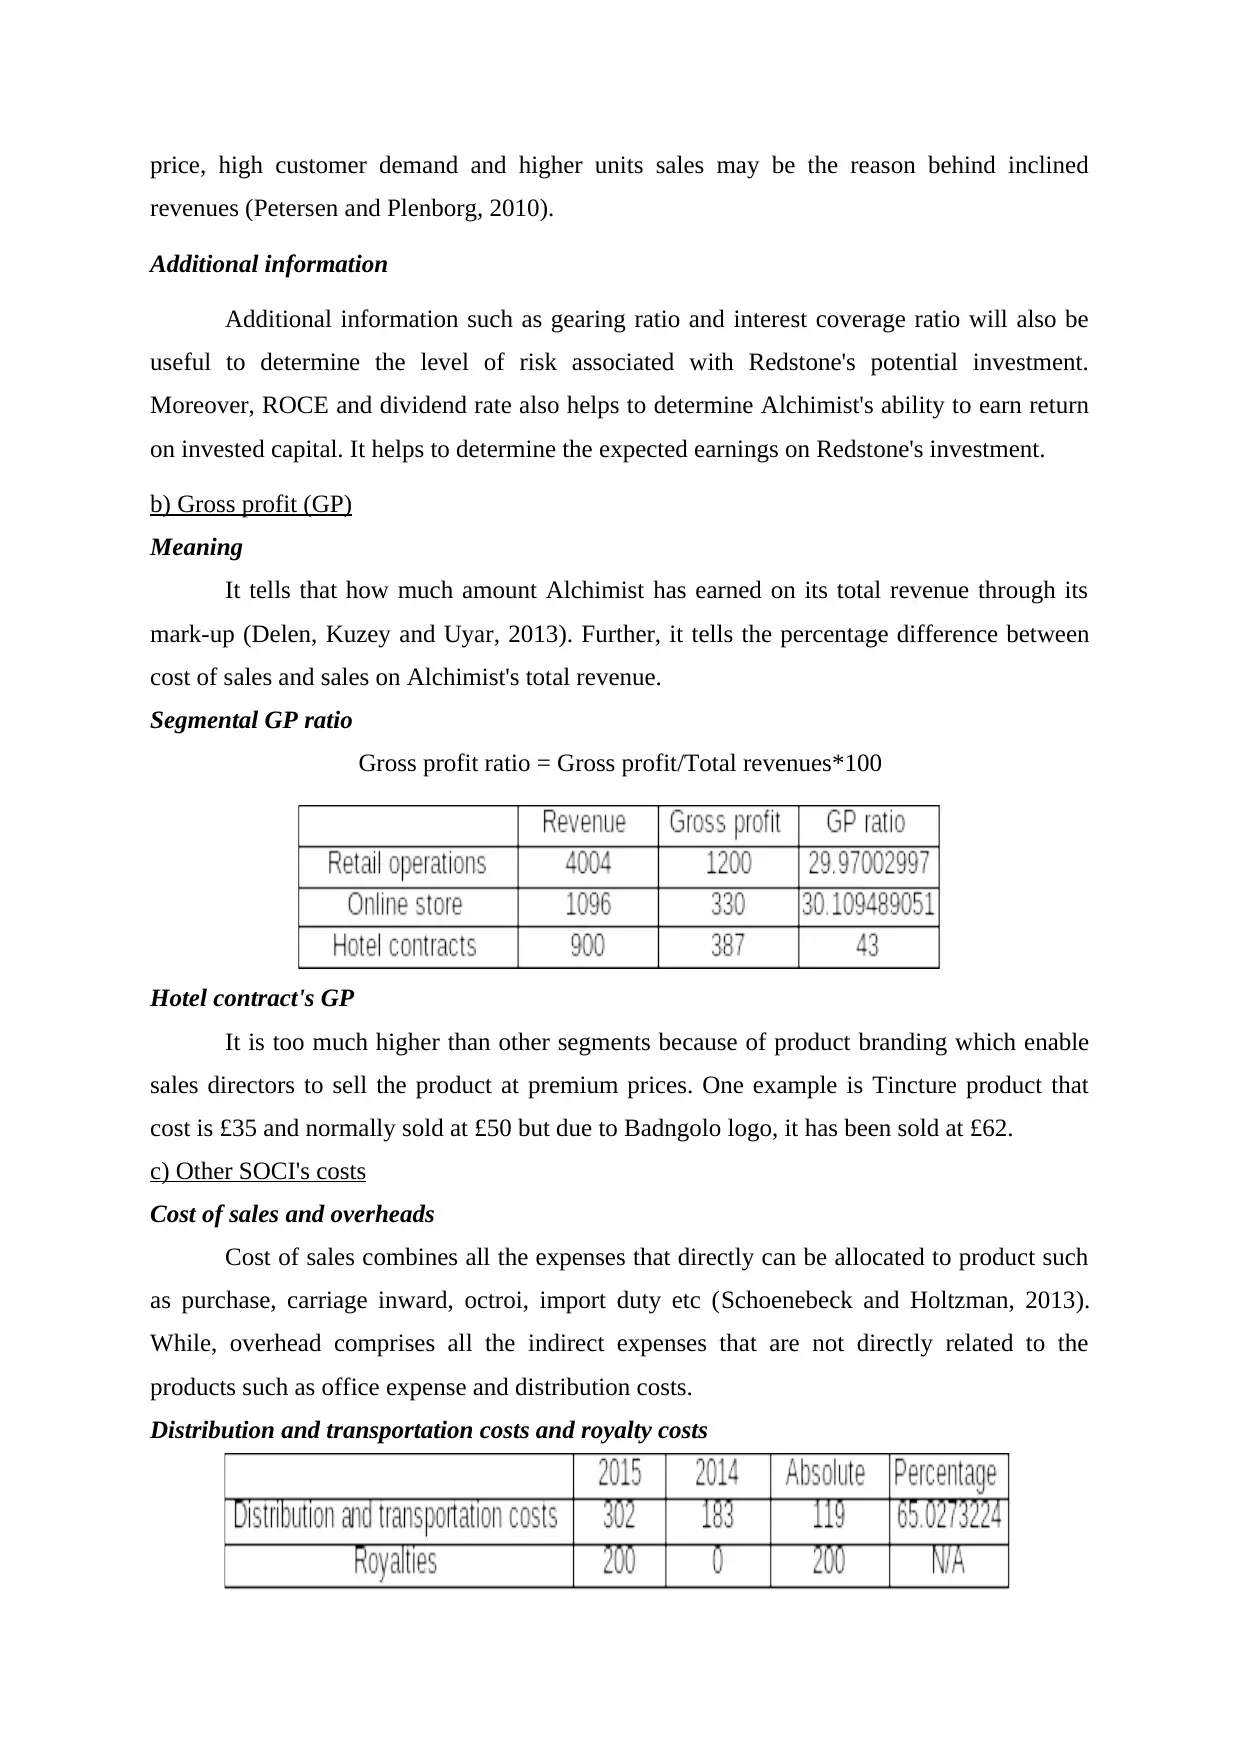
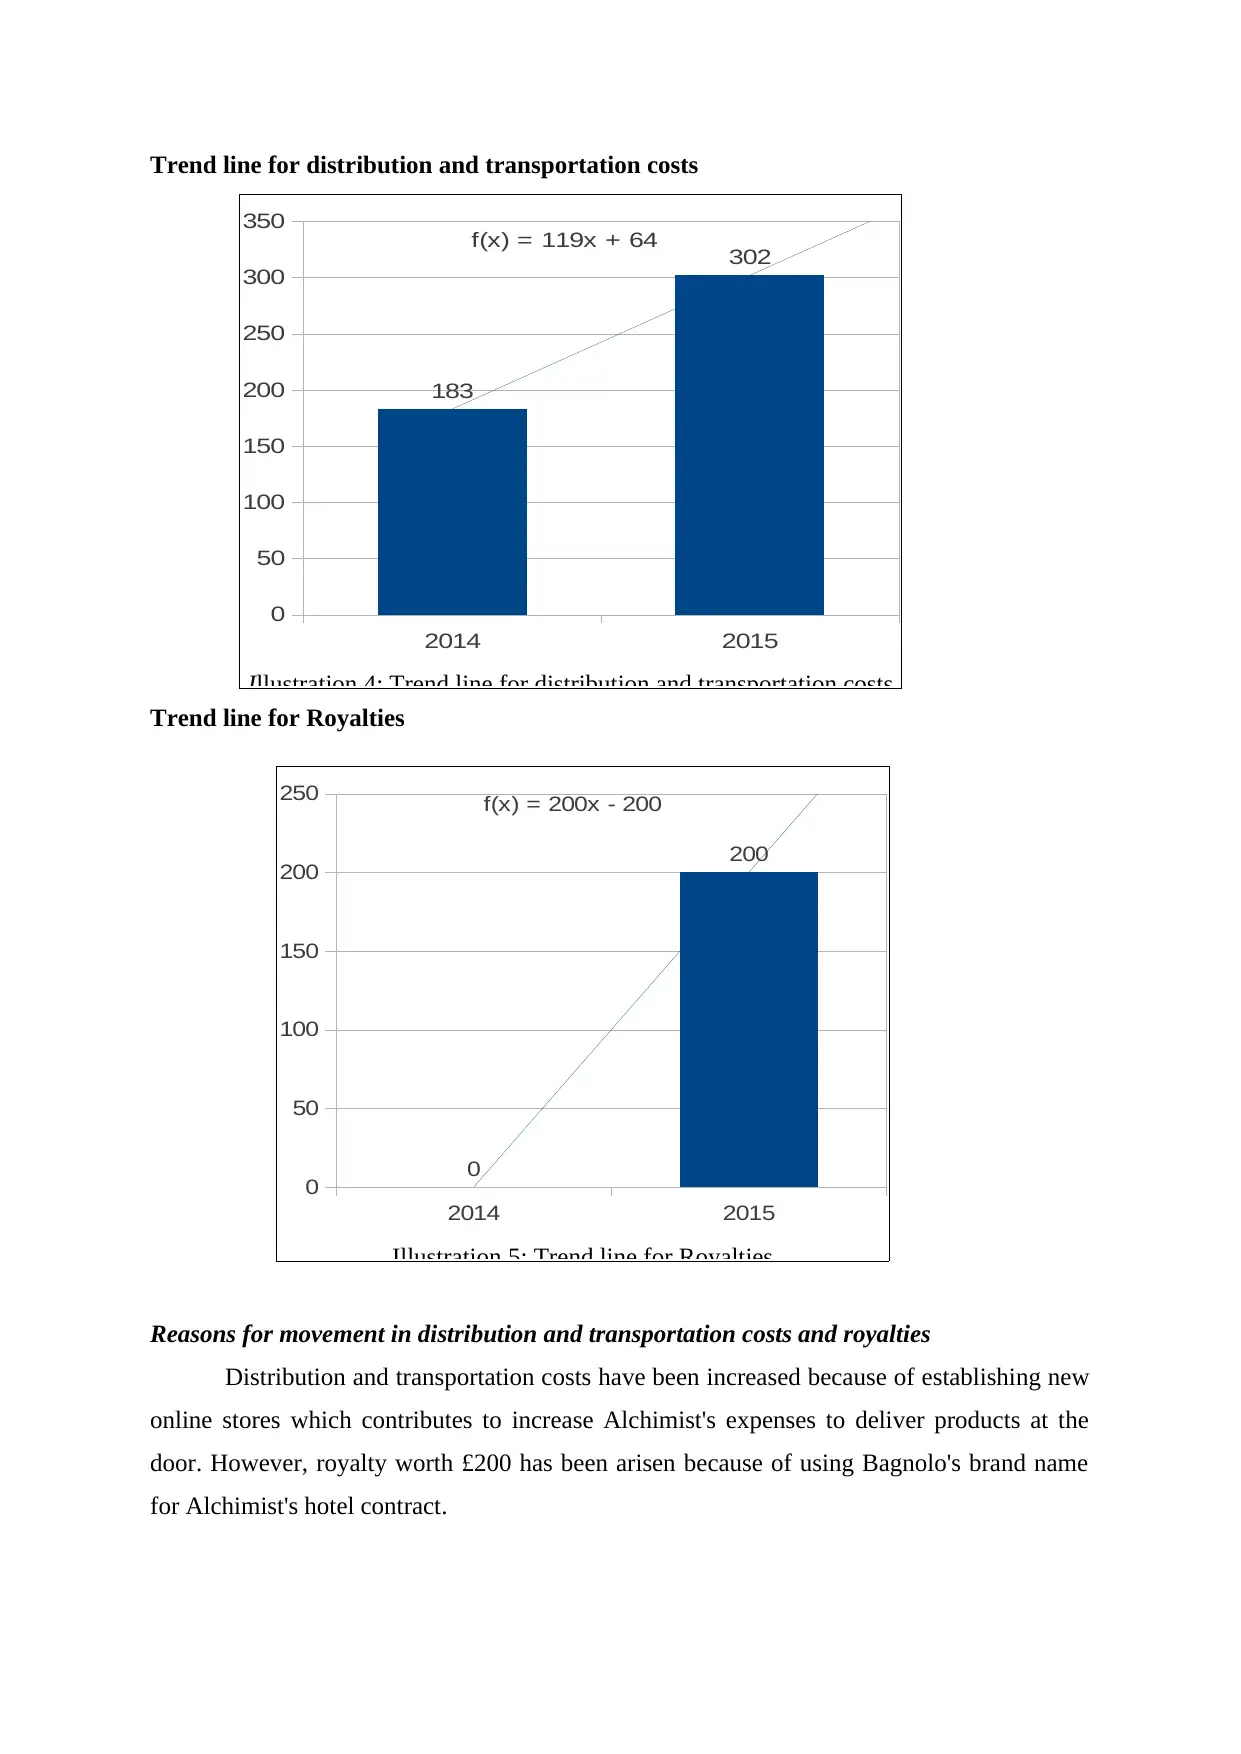
Reasons for movement in distribution and transportation costs and royalties
Distribution and transportation costs have been increased because of establishing new
online stores which contributes to increase Alchimist's expenses to deliver products at the
door. However, royalty worth £200 has been arisen because of using Bagnolo's brand name
for Alchimist's hotel contract.
2014 2015
0
50
100
150
200
250
300
350
183
302
f(x) = 119x + 64
Illustration 4: Trend line for distribution and transportation costs
2014 2015
0
50
100
150
200
250
0
200
f(x) = 200x - 200
Illustration 5: Trend line for Royalties
Trend line for Royalties
Reasons for movement in distribution and transportation costs and royalties
Distribution and transportation costs have been increased because of establishing new
online stores which contributes to increase Alchimist's expenses to deliver products at the
door. However, royalty worth £200 has been arisen because of using Bagnolo's brand name
for Alchimist's hotel contract.
2014 2015
0
50
100
150
200
250
300
350
183
302
f(x) = 119x + 64
Illustration 4: Trend line for distribution and transportation costs
2014 2015
0
50
100
150
200
250
0
200
f(x) = 200x - 200
Illustration 5: Trend line for Royalties
d) Net profit (NP)
Meaning
It tells the net profit percentage on total revenues and indicate that how Alchimist is
performing in the market through its operations (Deng, De Zoysa and Bhati, 2013).
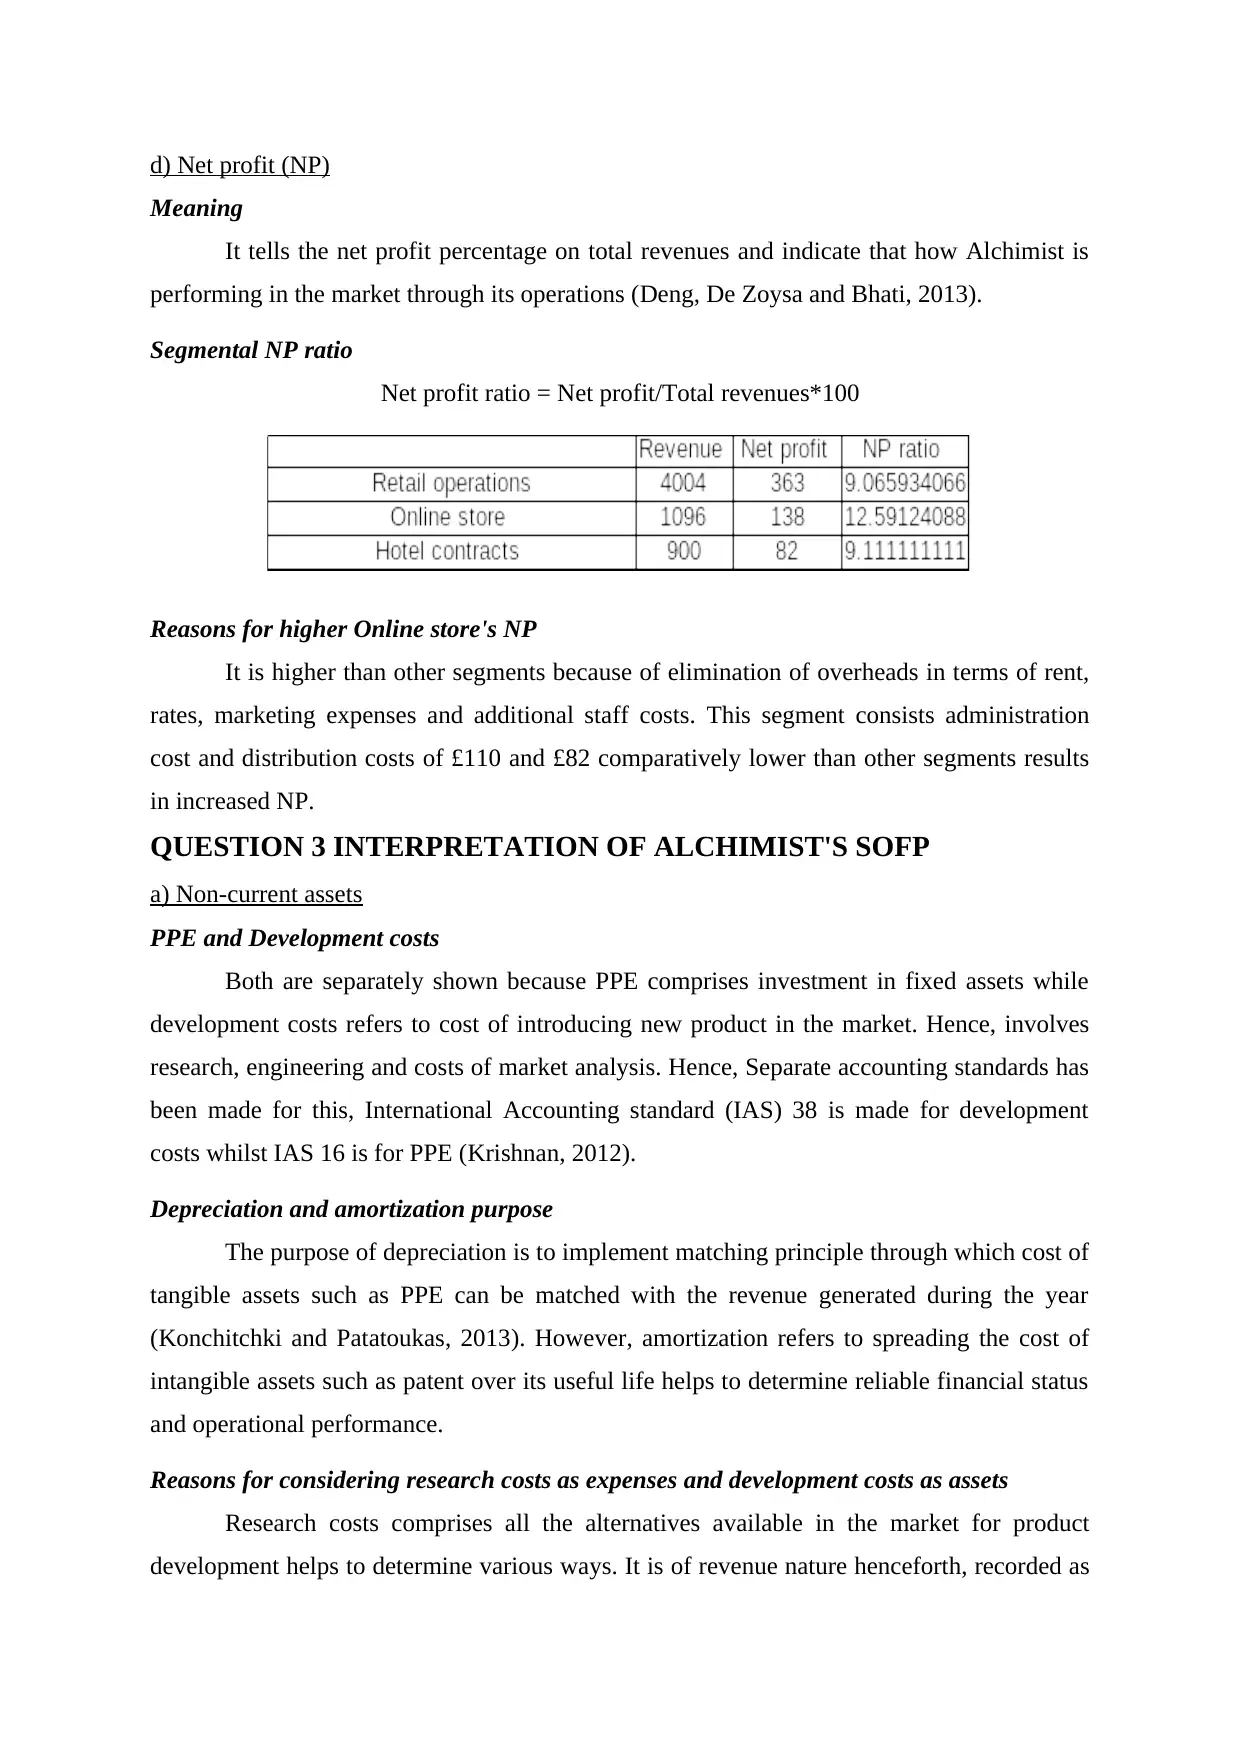
Segmental NP ratio
Net profit ratio = Net profit/Total revenues*100
Reasons for higher Online store's NP
It is higher than other segments because of elimination of overheads in terms of rent,
rates, marketing expenses and additional staff costs. This segment consists administration
cost and distribution costs of £110 and £82 comparatively lower than other segments results
in increased NP.
QUESTION 3 INTERPRETATION OF ALCHIMIST'S SOFP
a) Non-current assets
PPE and Development costs
Both are separately shown because PPE comprises investment in fixed assets while
development costs refers to cost of introducing new product in the market. Hence, involves
research, engineering and costs of market analysis. Hence, Separate accounting standards has
been made for this, International Accounting standard (IAS) 38 is made for development
costs whilst IAS 16 is for PPE (Krishnan, 2012).
Depreciation and amortization purpose
The purpose of depreciation is to implement matching principle through which cost of
tangible assets such as PPE can be matched with the revenue generated during the year
(Konchitchki and Patatoukas, 2013). However, amortization refers to spreading the cost of
intangible assets such as patent over its useful life helps to determine reliable financial status
and operational performance.
Reasons for considering research costs as expenses and development costs as assets
Research costs comprises all the alternatives available in the market for product
development helps to determine various ways. It is of revenue nature henceforth, recorded as
Meaning
It tells the net profit percentage on total revenues and indicate that how Alchimist is
performing in the market through its operations (Deng, De Zoysa and Bhati, 2013).
Segmental NP ratio
Net profit ratio = Net profit/Total revenues*100
Reasons for higher Online store's NP
It is higher than other segments because of elimination of overheads in terms of rent,
rates, marketing expenses and additional staff costs. This segment consists administration
cost and distribution costs of £110 and £82 comparatively lower than other segments results
in increased NP.
QUESTION 3 INTERPRETATION OF ALCHIMIST'S SOFP
a) Non-current assets
PPE and Development costs
Both are separately shown because PPE comprises investment in fixed assets while
development costs refers to cost of introducing new product in the market. Hence, involves
research, engineering and costs of market analysis. Hence, Separate accounting standards has
been made for this, International Accounting standard (IAS) 38 is made for development
costs whilst IAS 16 is for PPE (Krishnan, 2012).
Depreciation and amortization purpose
The purpose of depreciation is to implement matching principle through which cost of
tangible assets such as PPE can be matched with the revenue generated during the year
(Konchitchki and Patatoukas, 2013). However, amortization refers to spreading the cost of
intangible assets such as patent over its useful life helps to determine reliable financial status
and operational performance.
Reasons for considering research costs as expenses and development costs as assets
Research costs comprises all the alternatives available in the market for product
development helps to determine various ways. It is of revenue nature henceforth, recorded as
⊘ This is a preview!⊘
Do you want full access?
Subscribe today to unlock all pages.
Trusted by 1+ million students worldwide
expenses in SOCI (Hodder, Hopkins and Wood, 2008). However, development costs includes
expenditure for developing new product henceforth, it is of capital nature and recorded as
assets.
b) Redstone proposed investment
Impact on SOFP due to wholly cash investment and used to pay overdraft
It will increase share capital by £500000 and will reach to £1050000.
It will increase cash balance by net amount of £432 (£500-£68) and will reach at
£432. It will reduce bank overdraft by £68 and will reach at Zero.
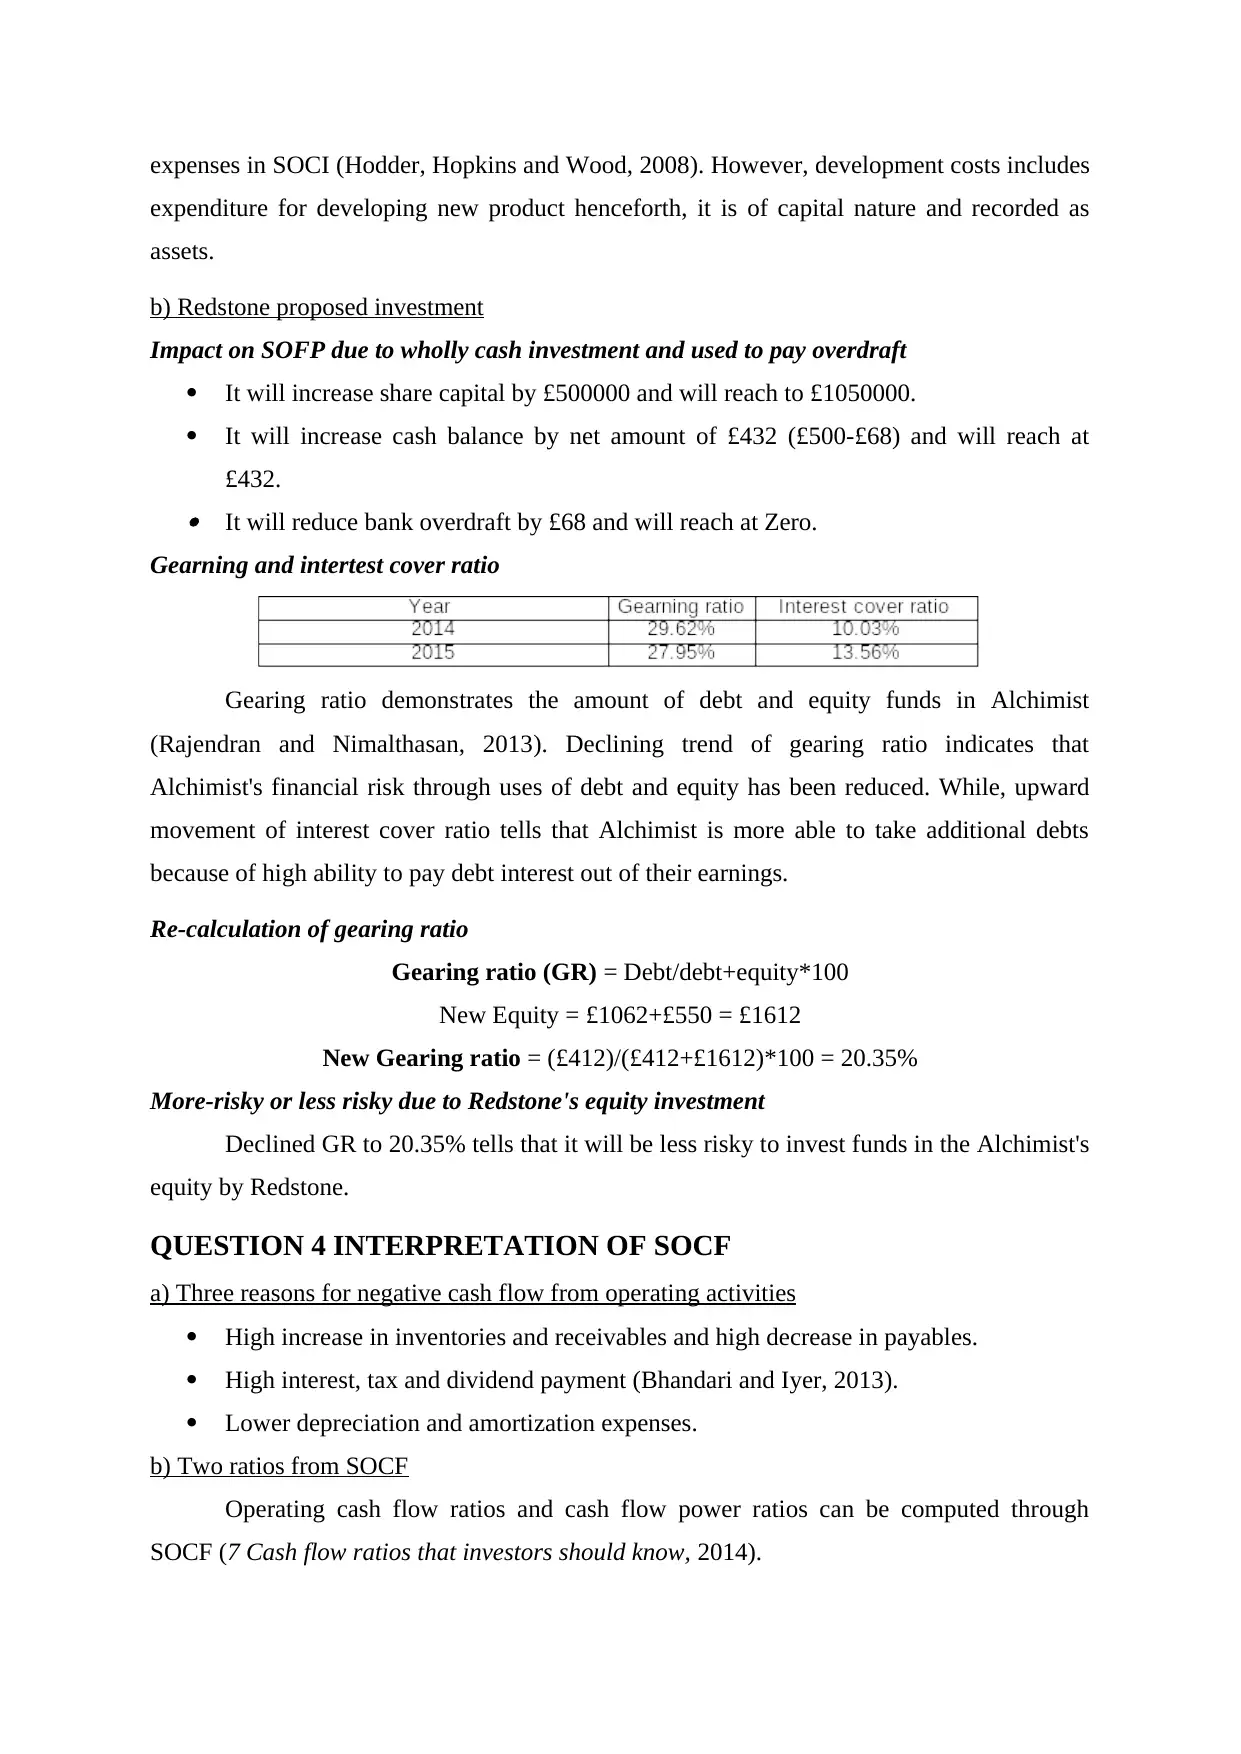
Gearning and intertest cover ratio
Gearing ratio demonstrates the amount of debt and equity funds in Alchimist
(Rajendran and Nimalthasan, 2013). Declining trend of gearing ratio indicates that
Alchimist's financial risk through uses of debt and equity has been reduced. While, upward
movement of interest cover ratio tells that Alchimist is more able to take additional debts
because of high ability to pay debt interest out of their earnings.
Re-calculation of gearing ratio
Gearing ratio (GR) = Debt/debt+equity*100
New Equity = £1062+£550 = £1612
New Gearing ratio = (£412)/(£412+£1612)*100 = 20.35%
More-risky or less risky due to Redstone's equity investment
Declined GR to 20.35% tells that it will be less risky to invest funds in the Alchimist's
equity by Redstone.
QUESTION 4 INTERPRETATION OF SOCF
a) Three reasons for negative cash flow from operating activities
High increase in inventories and receivables and high decrease in payables.
High interest, tax and dividend payment (Bhandari and Iyer, 2013).
Lower depreciation and amortization expenses.
b) Two ratios from SOCF
Operating cash flow ratios and cash flow power ratios can be computed through
SOCF (7 Cash flow ratios that investors should know, 2014).
expenditure for developing new product henceforth, it is of capital nature and recorded as
assets.
b) Redstone proposed investment
Impact on SOFP due to wholly cash investment and used to pay overdraft
It will increase share capital by £500000 and will reach to £1050000.
It will increase cash balance by net amount of £432 (£500-£68) and will reach at
£432. It will reduce bank overdraft by £68 and will reach at Zero.
Gearning and intertest cover ratio
Gearing ratio demonstrates the amount of debt and equity funds in Alchimist
(Rajendran and Nimalthasan, 2013). Declining trend of gearing ratio indicates that
Alchimist's financial risk through uses of debt and equity has been reduced. While, upward
movement of interest cover ratio tells that Alchimist is more able to take additional debts
because of high ability to pay debt interest out of their earnings.
Re-calculation of gearing ratio
Gearing ratio (GR) = Debt/debt+equity*100
New Equity = £1062+£550 = £1612
New Gearing ratio = (£412)/(£412+£1612)*100 = 20.35%
More-risky or less risky due to Redstone's equity investment
Declined GR to 20.35% tells that it will be less risky to invest funds in the Alchimist's
equity by Redstone.
QUESTION 4 INTERPRETATION OF SOCF
a) Three reasons for negative cash flow from operating activities
High increase in inventories and receivables and high decrease in payables.
High interest, tax and dividend payment (Bhandari and Iyer, 2013).
Lower depreciation and amortization expenses.
b) Two ratios from SOCF
Operating cash flow ratios and cash flow power ratios can be computed through
SOCF (7 Cash flow ratios that investors should know, 2014).
Paraphrase This Document
Need a fresh take? Get an instant paraphrase of this document with our AI Paraphraser
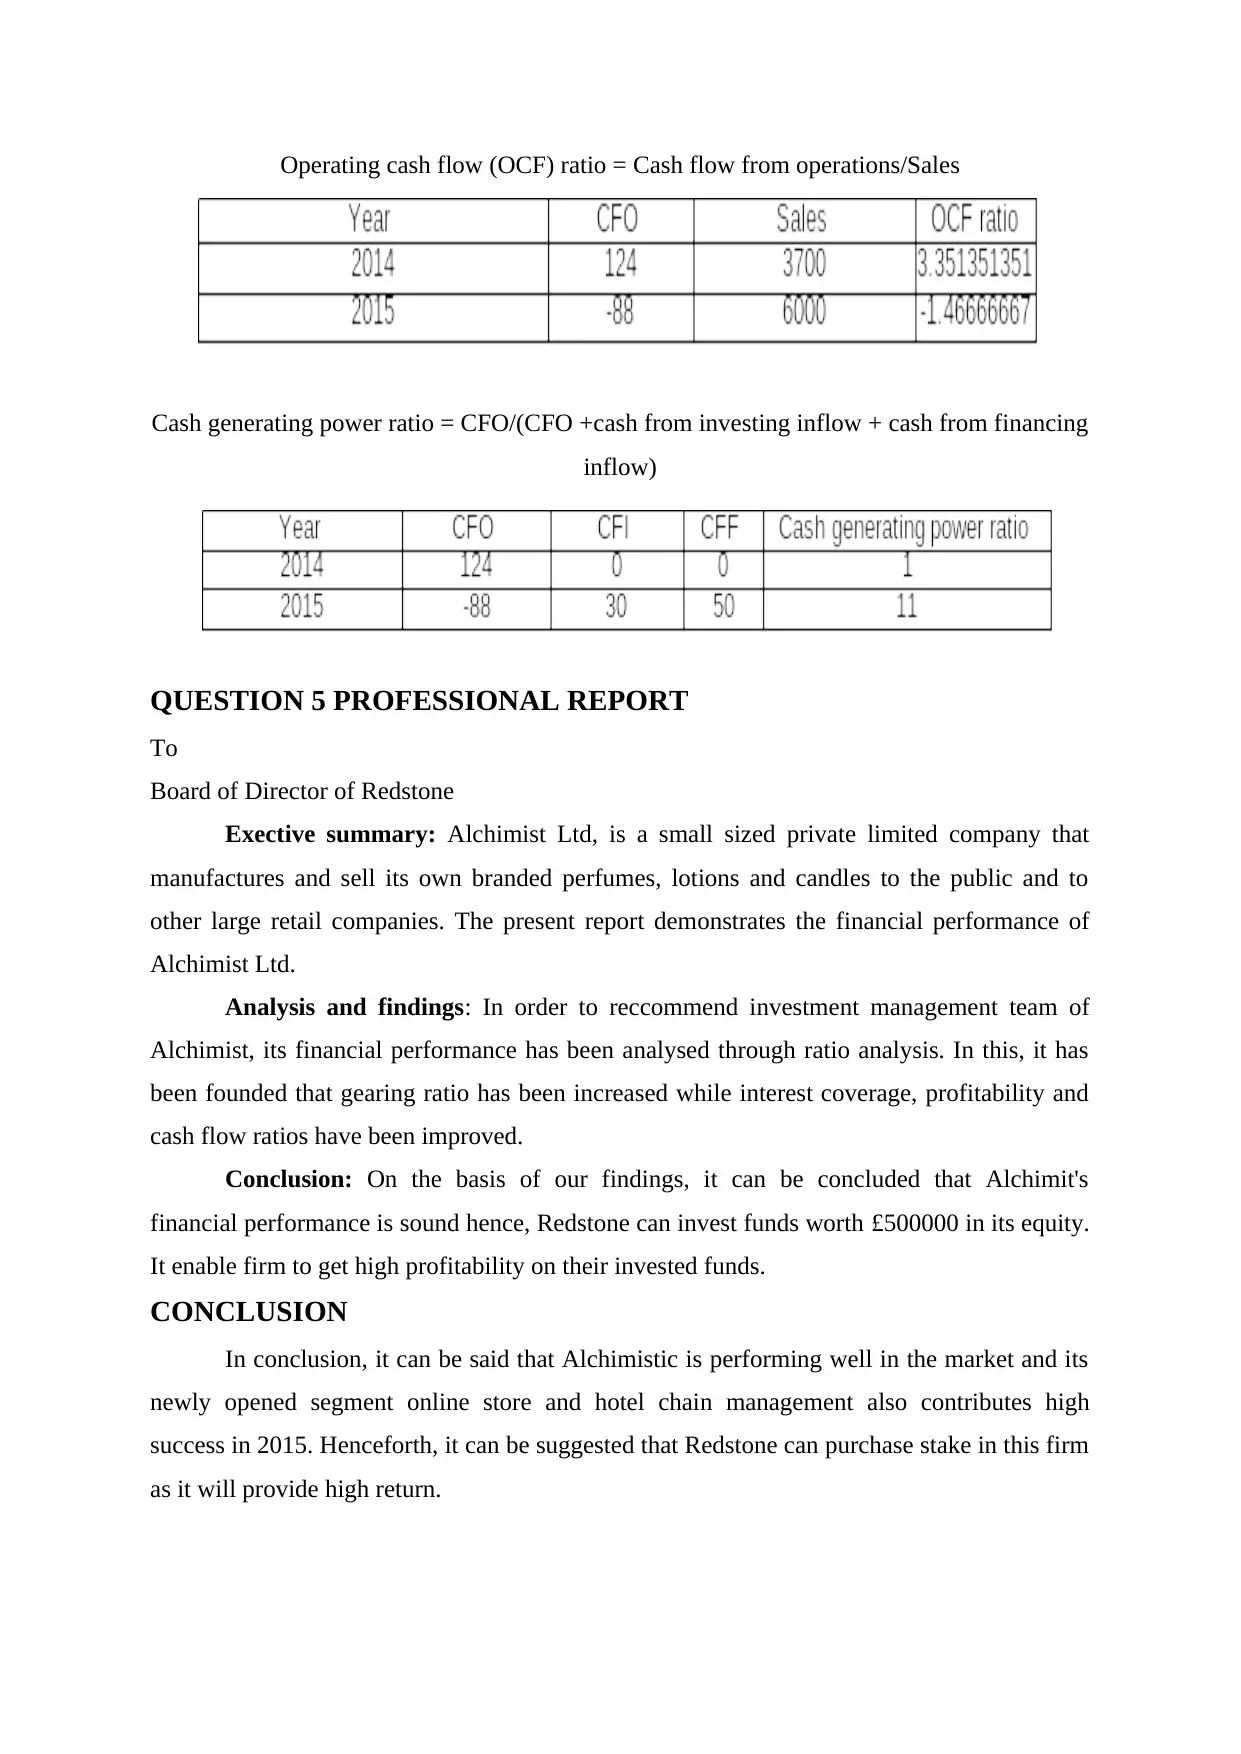
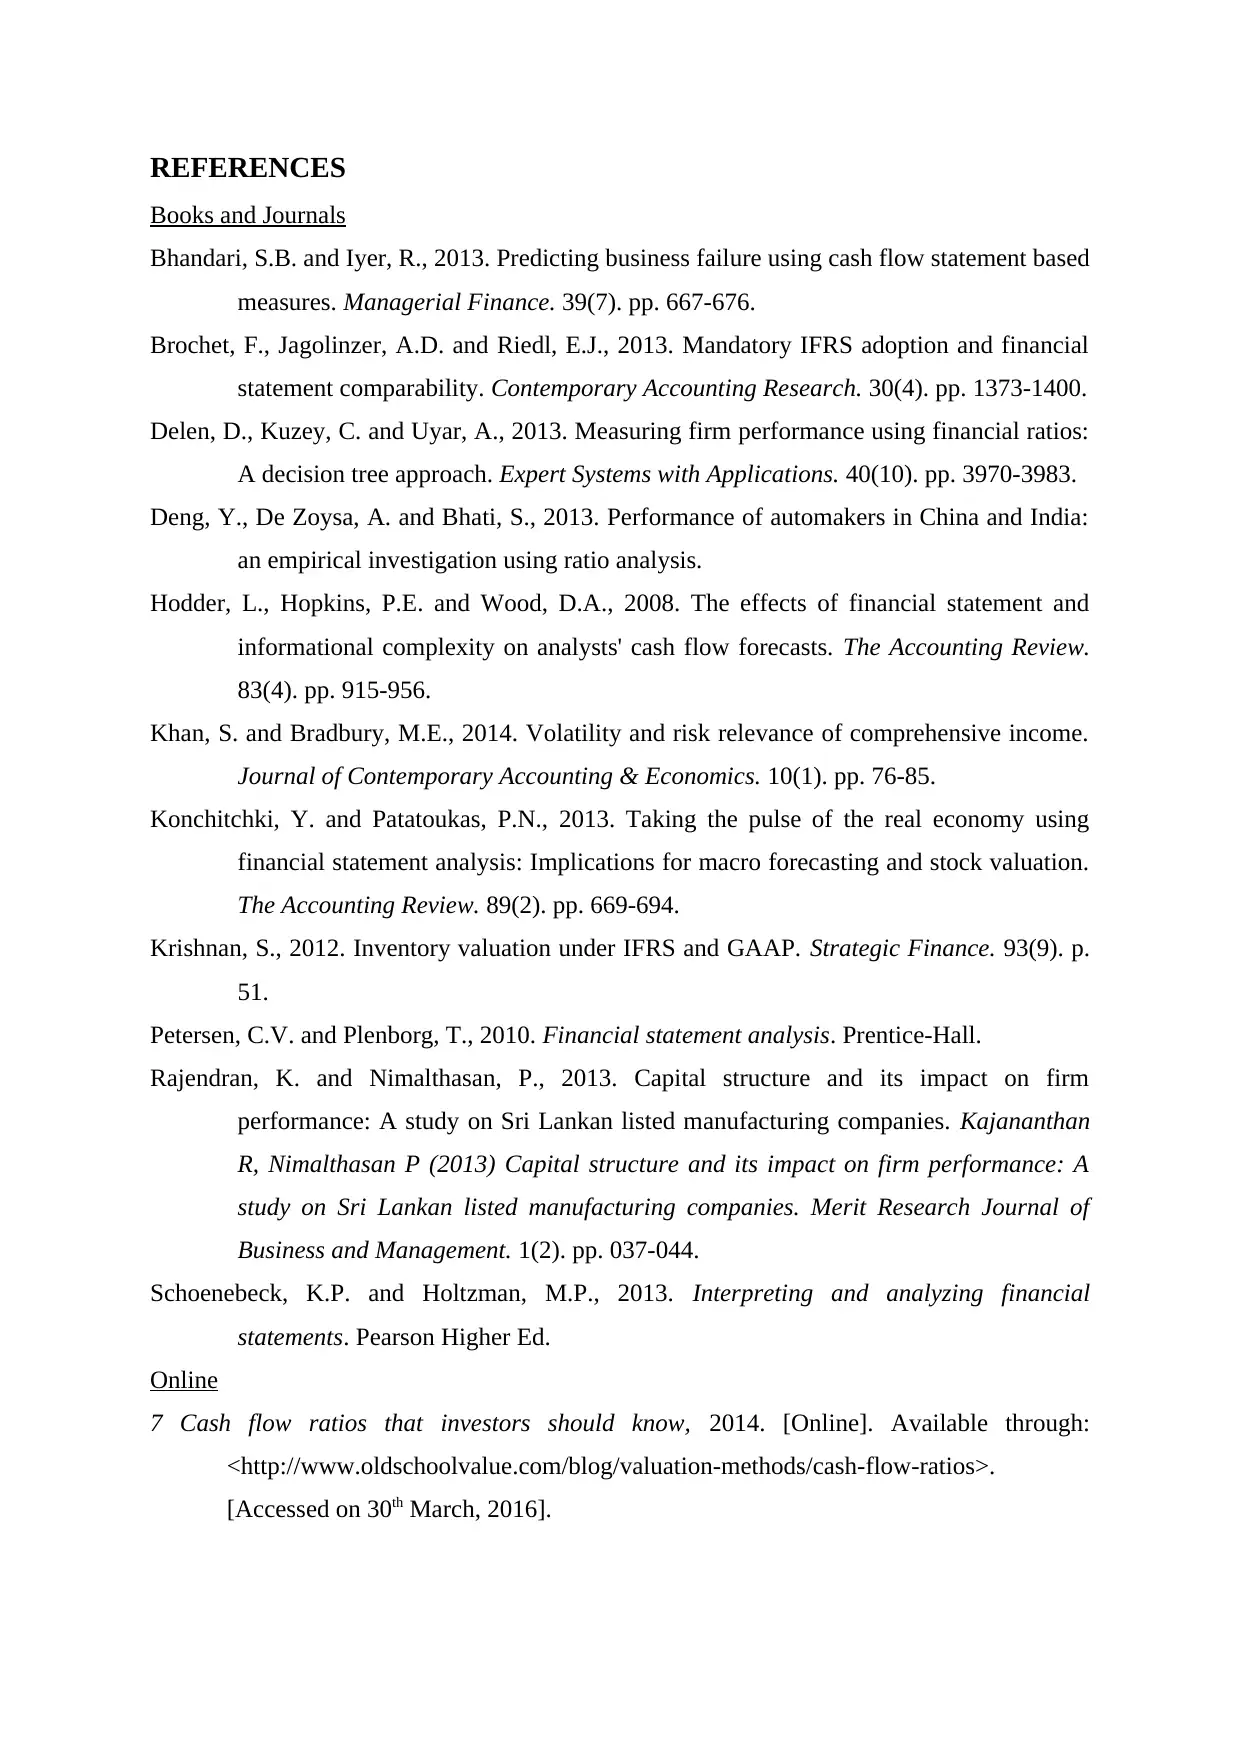
Operating cash flow (OCF) ratio = Cash flow from operations/Sales
Cash generating power ratio = CFO/(CFO +cash from investing inflow + cash from financing
inflow)
QUESTION 5 PROFESSIONAL REPORT
To
Board of Director of Redstone
Exective summary: Alchimist Ltd, is a small sized private limited company that
manufactures and sell its own branded perfumes, lotions and candles to the public and to
other large retail companies. The present report demonstrates the financial performance of
Alchimist Ltd.
Analysis and findings: In order to reccommend investment management team of
Alchimist, its financial performance has been analysed through ratio analysis. In this, it has
been founded that gearing ratio has been increased while interest coverage, profitability and
cash flow ratios have been improved.
Conclusion: On the basis of our findings, it can be concluded that Alchimit's
financial performance is sound hence, Redstone can invest funds worth £500000 in its equity.
It enable firm to get high profitability on their invested funds.
CONCLUSION
In conclusion, it can be said that Alchimistic is performing well in the market and its
newly opened segment online store and hotel chain management also contributes high
success in 2015. Henceforth, it can be suggested that Redstone can purchase stake in this firm
as it will provide high return.
REFERENCES
Books and Journals
Bhandari, S.B. and Iyer, R., 2013. Predicting business failure using cash flow statement based
measures. Managerial Finance. 39(7). pp. 667-676.
Brochet, F., Jagolinzer, A.D. and Riedl, E.J., 2013. Mandatory IFRS adoption and financial
statement comparability. Contemporary Accounting Research. 30(4). pp. 1373-1400.
Delen, D., Kuzey, C. and Uyar, A., 2013. Measuring firm performance using financial ratios:
A decision tree approach. Expert Systems with Applications. 40(10). pp. 3970-3983.
Deng, Y., De Zoysa, A. and Bhati, S., 2013. Performance of automakers in China and India:
an empirical investigation using ratio analysis.
Hodder, L., Hopkins, P.E. and Wood, D.A., 2008. The effects of financial statement and
informational complexity on analysts' cash flow forecasts. The Accounting Review.
83(4). pp. 915-956.
Khan, S. and Bradbury, M.E., 2014. Volatility and risk relevance of comprehensive income.
Journal of Contemporary Accounting & Economics. 10(1). pp. 76-85.
Konchitchki, Y. and Patatoukas, P.N., 2013. Taking the pulse of the real economy using
financial statement analysis: Implications for macro forecasting and stock valuation.
The Accounting Review. 89(2). pp. 669-694.
Krishnan, S., 2012. Inventory valuation under IFRS and GAAP. Strategic Finance. 93(9). p.
51.
Petersen, C.V. and Plenborg, T., 2010. Financial statement analysis. Prentice-Hall.
Rajendran, K. and Nimalthasan, P., 2013. Capital structure and its impact on firm
performance: A study on Sri Lankan listed manufacturing companies. Kajananthan
R, Nimalthasan P (2013) Capital structure and its impact on firm performance: A
study on Sri Lankan listed manufacturing companies. Merit Research Journal of
Business and Management. 1(2). pp. 037-044.
Schoenebeck, K.P. and Holtzman, M.P., 2013. Interpreting and analyzing financial
statements. Pearson Higher Ed.
Online
7 Cash flow ratios that investors should know, 2014. [Online]. Available through:
<http://www.oldschoolvalue.com/blog/valuation-methods/cash-flow-ratios>.
[Accessed on 30th March, 2016].
⊘ This is a preview!⊘
Do you want full access?
Subscribe today to unlock all pages.
Trusted by 1+ million students worldwide
1 out of 12
Related Documents


Your All-in-One AI-Powered Toolkit for Academic Success.
+13062052269
info@desklib.com
Available 24*7 on WhatsApp / Email
![[object Object]](/_next/static/media/star-bottom.7253800d.svg)
Unlock your academic potential
Copyright © 2020–2026 A2Z Services. All Rights Reserved. Developed and managed by ZUCOL.