Economics Assignment 1: Demand and Supply of Alcohol in Australia
VerifiedAdded on 2021/06/16
|9
|1805
|75
Report
AI Summary
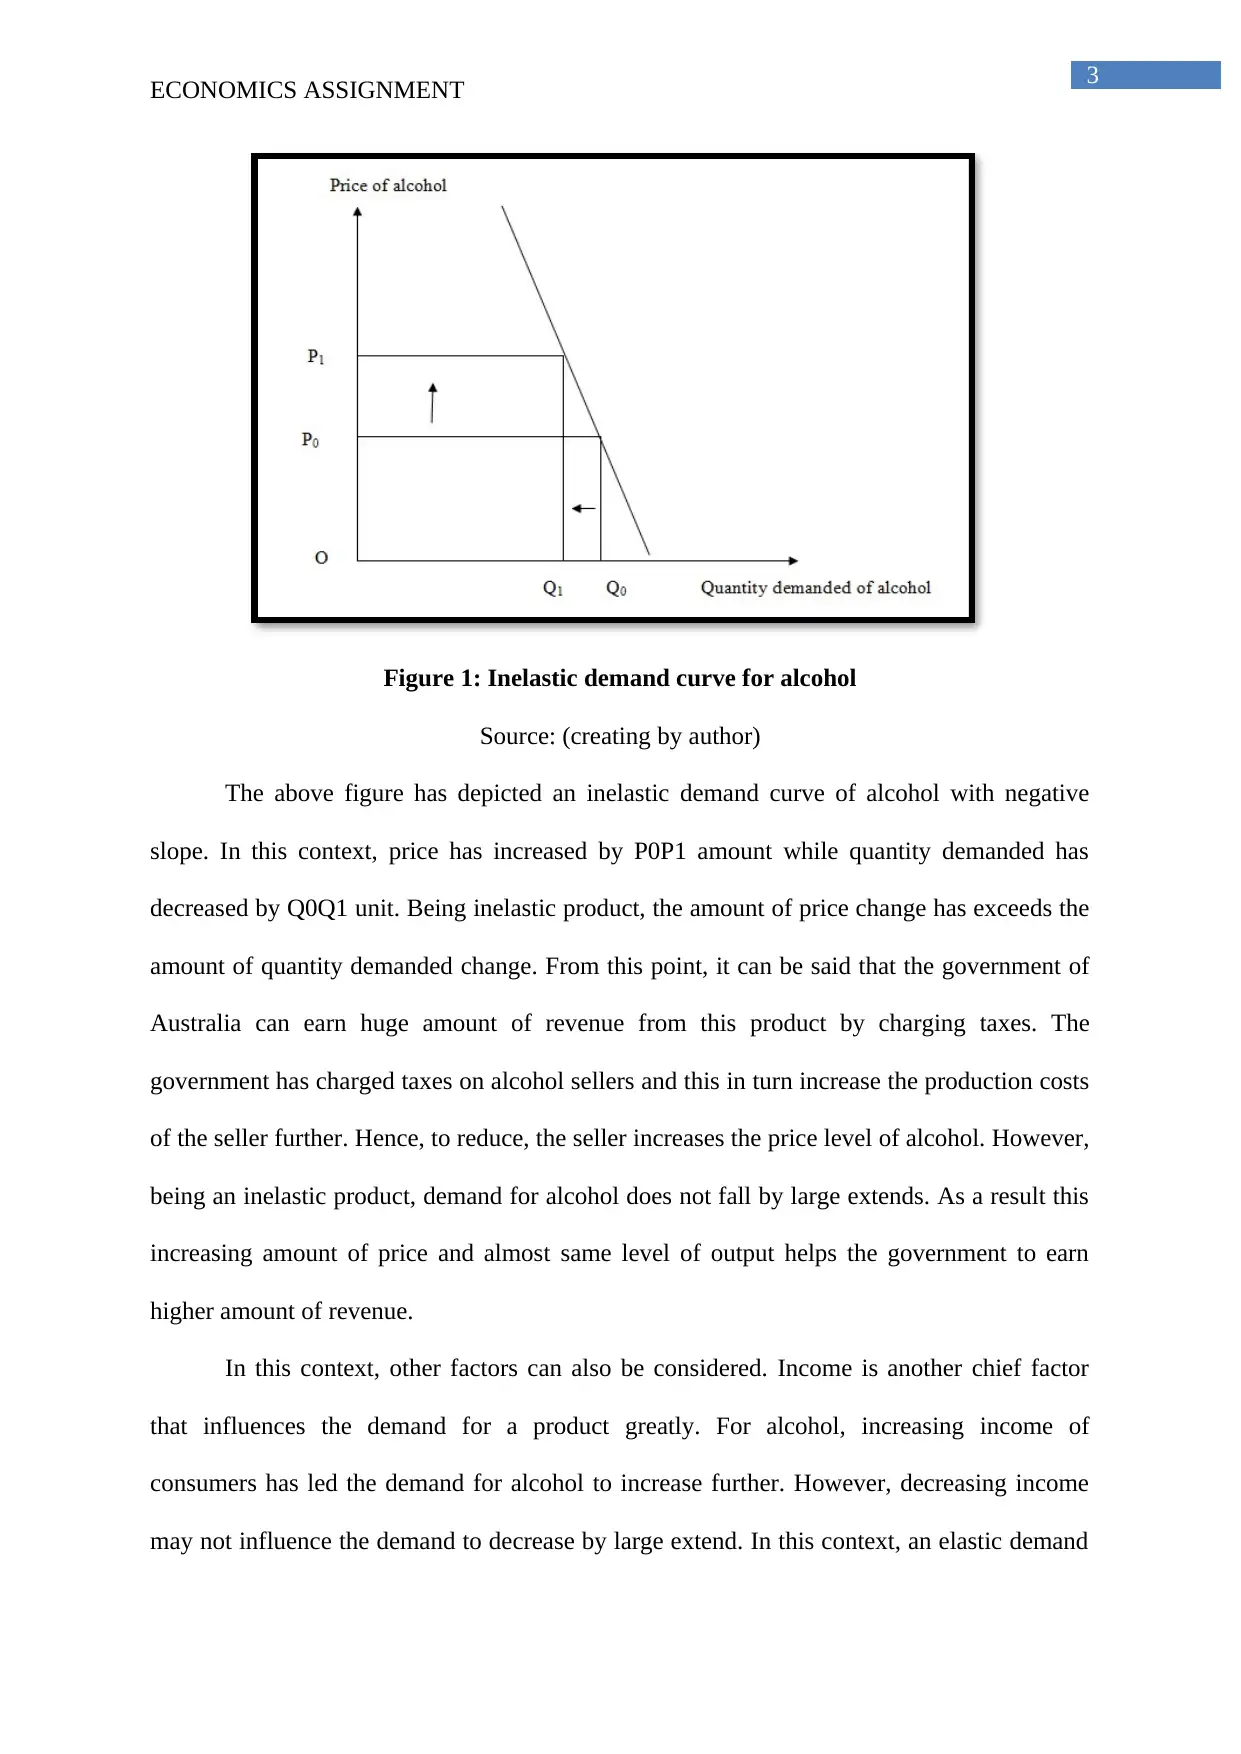
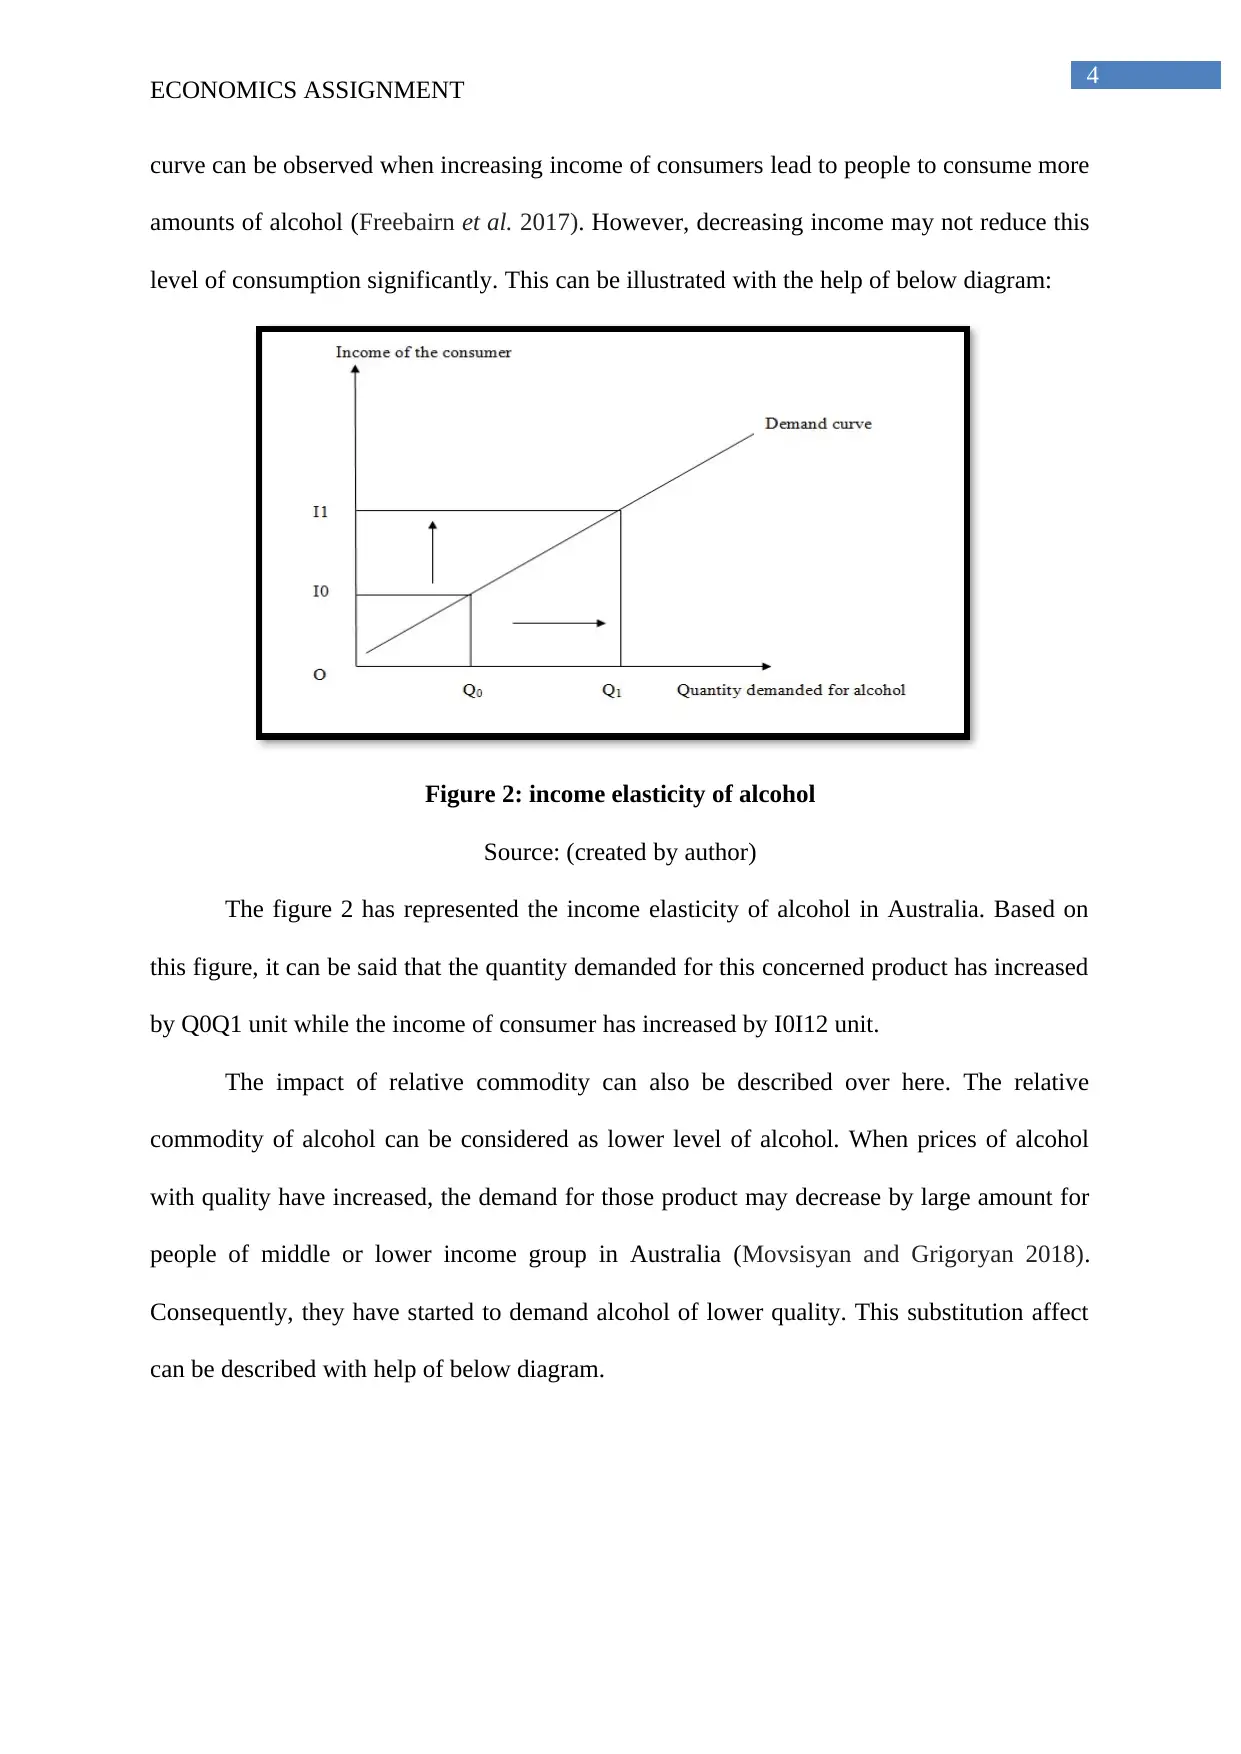
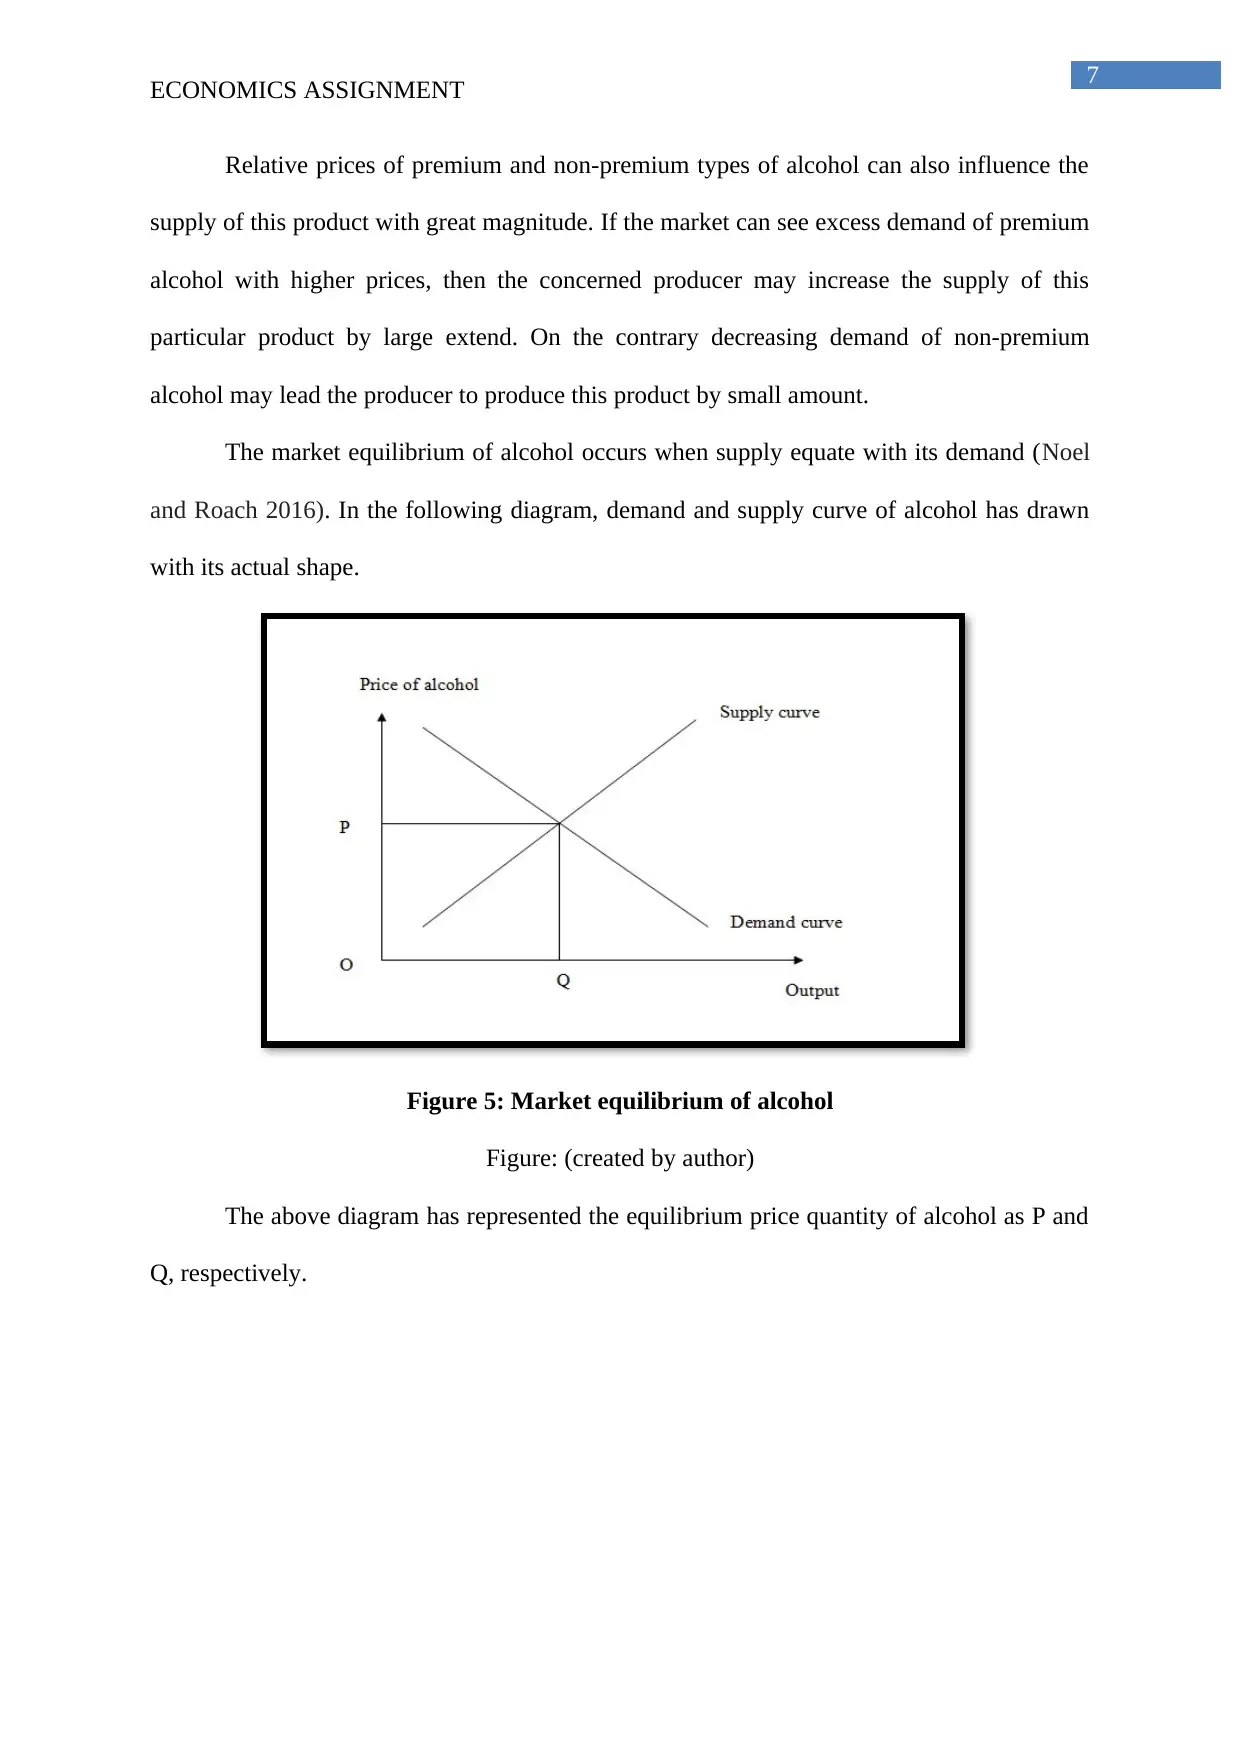
This economics assignment analyzes the demand and supply of alcohol in Australia. It begins with an introduction to the Australian alcohol beverage industry and its contribution to the national income. The report then delves into the determinants of alcohol demand, including price elasticity, income fluctuations, and the impact of related commodities. The analysis includes graphical representations of inelastic demand curves, income elasticity, and substitution effects. The supply side of alcohol is also examined, focusing on factors such as price, time trends, and relative prices of premium and non-premium varieties. The report illustrates the supply curve and market equilibrium using diagrams, and concludes with a list of relevant references. The report also highlights how government regulations and taxes influence the market and the revenue earned.

Running head: ECONOMICS ASSIGNMENT
Economics Assignment
Name of the student
Name of the university
Author Note
Economics Assignment
Name of the student
Name of the university
Author Note
Paraphrase This Document
Need a fresh take? Get an instant paraphrase of this document with our AI Paraphraser

1
ECONOMICS ASSIGNMENT
Table of Contents
Introduction:...............................................................................................................................2
Determinant of demand for alcohol:..........................................................................................2
Supply of alcohol:......................................................................................................................5
References:.................................................................................................................................8

2
ECONOMICS ASSIGNMENT
Introduction:
The alcohol beverage industry of Australia has contributed significant amount to the
country’s National income by generating employment opportunity and the tax revenue of the
state. The demand for and supply of alcohol of this concerned country can be measured by
considering two chief form of beverages, which are beer and wine (Buyucek, Knox and
Rundle-Thiele 2018). Hence, the chief intention of this report is to analyse the ability of
supply side of alcohol to create and control demand for this product in market while both side
can get advantage. Moreover, these two sides influence the government to influence
governmental regulations for this specified market.
Determinant of demand for alcohol:
According to the law of demand, price of a commodity has a negative relationship
with its amount that can be demanded. However, for establishing this relation, other demand
influencing factors are considered as fixed. Those factors are price of related commodities,
income, tastes and preferences of the consumer and so on. If one of the factor changes,
remaining the price at a same level, then the demand curve can be shifted to the right or left
accordingly. For each factor, those demand-influencing factors can be changed.
Consequently, the factors that can influence the demand for alcohol can also be taken under
consideration. Hence, for this concerned product, those demand-influencing factors are its
own price, income fluctuations of the customers, level of wine and beer stock and exchange
rate (Liu et al. 2018). Those factors can be described as follows.
Price of alcohol has a negative relation with its quantity demanded. Hence, the
demand curve slopes downward. However, in this case, price elasticity needs to be discussed.
For alcohol products, inelastic demand curve with negative slope can be found. This implies
this implies that an increase price cannot reduce the demand for this product by large extend.
The following curve can represent this situation precisely.
⊘ This is a preview!⊘
Do you want full access?
Subscribe today to unlock all pages.

Trusted by 1+ million students worldwide

3
ECONOMICS ASSIGNMENT
Figure 1: Inelastic demand curve for alcohol
Source: (creating by author)
The above figure has depicted an inelastic demand curve of alcohol with negative
slope. In this context, price has increased by P0P1 amount while quantity demanded has
decreased by Q0Q1 unit. Being inelastic product, the amount of price change has exceeds the
amount of quantity demanded change. From this point, it can be said that the government of
Australia can earn huge amount of revenue from this product by charging taxes. The
government has charged taxes on alcohol sellers and this in turn increase the production costs
of the seller further. Hence, to reduce, the seller increases the price level of alcohol. However,
being an inelastic product, demand for alcohol does not fall by large extends. As a result this
increasing amount of price and almost same level of output helps the government to earn
higher amount of revenue.
In this context, other factors can also be considered. Income is another chief factor
that influences the demand for a product greatly. For alcohol, increasing income of
consumers has led the demand for alcohol to increase further. However, decreasing income
may not influence the demand to decrease by large extend. In this context, an elastic demand
Paraphrase This Document
Need a fresh take? Get an instant paraphrase of this document with our AI Paraphraser

4
ECONOMICS ASSIGNMENT
curve can be observed when increasing income of consumers lead to people to consume more
amounts of alcohol (Freebairn et al. 2017). However, decreasing income may not reduce this
level of consumption significantly. This can be illustrated with the help of below diagram:
Figure 2: income elasticity of alcohol
Source: (created by author)
The figure 2 has represented the income elasticity of alcohol in Australia. Based on
this figure, it can be said that the quantity demanded for this concerned product has increased
by Q0Q1 unit while the income of consumer has increased by I0I12 unit.
The impact of relative commodity can also be described over here. The relative
commodity of alcohol can be considered as lower level of alcohol. When prices of alcohol
with quality have increased, the demand for those product may decrease by large amount for
people of middle or lower income group in Australia (Movsisyan and Grigoryan 2018).
Consequently, they have started to demand alcohol of lower quality. This substitution affect
can be described with help of below diagram.

5
ECONOMICS ASSIGNMENT
Figure 3: Impact of substitution product for alcohol
Figure: (created by author)
According to above figure, price of alcohol with higher quality has increased by P0P1
unit and consequently, the demand for quantity demanded has decreased by H0H1 unit. At
the same time, demand for alcohol with lower quality has increased by L0L1 unit when price
of this product has remained at the same level.
Moreover, stock of alcohol has also influenced the demand for this product
significantly. If consumers or owners of retail shops have maintained higher amount of
alcohol stock, then this can reduce the demand for this product for a short period (Kenny,
Blissenden and Villios 2017). On the contrary, the opposite situation can also be occurred if
the stock has decreased by significant amount.
Supply of alcohol:
Supply of alcohol also depends on some factors, which are current price, time trend,
relative prices regarding premium and non-premium varieties of alcohol. According to the
supply law, increasing price of a product has a positive relationship with its output supplied.
This phenomenon is also true for alcohol. Increasing price of alcohol can lead the supplier to
⊘ This is a preview!⊘
Do you want full access?
Subscribe today to unlock all pages.

Trusted by 1+ million students worldwide

6
ECONOMICS ASSIGNMENT
supply more amount this concerned output (Mattick et al. 2017). This can be discussed with
the help of adjoining diagram.
Figure 4: Supply curve of alcohol
Figure: (created by author)
Based on above figure it can be said that the price of alcohol has increased by P0P1
unit and consequently, the amount of alcohol supplied has increased by Q0Q1 unit as well.
Because of this positive relation, the supply curve slopes upward.
Time trend has also influenced the amount of alcohol supply in a positive direction.
During a long period, producers can supply more amount of alcohol through wine and bear.
Within short run, it becomes impossible for producers to supply sufficient amount of alcohol
to their customers (Pettigrew et al. 2015). However, during long period, producers can supply
higher amount of output with given price level.
The above figure has represented the impact on supply curve of alcohol, based
on time trend. If producers observe that demand for alcohol is increasing significantly over
the past few years, then they can predict that this trend may increase further. Increasing
demand may lead the prices of this concerned product to increase further. Consequently, the
producers have tried to supply alcohol by large amount.
Paraphrase This Document
Need a fresh take? Get an instant paraphrase of this document with our AI Paraphraser

7
ECONOMICS ASSIGNMENT
Relative prices of premium and non-premium types of alcohol can also influence the
supply of this product with great magnitude. If the market can see excess demand of premium
alcohol with higher prices, then the concerned producer may increase the supply of this
particular product by large extend. On the contrary decreasing demand of non-premium
alcohol may lead the producer to produce this product by small amount.
The market equilibrium of alcohol occurs when supply equate with its demand (Noel
and Roach 2016). In the following diagram, demand and supply curve of alcohol has drawn
with its actual shape.
Figure 5: Market equilibrium of alcohol
Figure: (created by author)
The above diagram has represented the equilibrium price quantity of alcohol as P and
Q, respectively.

8
ECONOMICS ASSIGNMENT
References:
Buyucek, N., Knox, K. and Rundle-Thiele, S., 2018. Observing alcohol drinking in licensed
premises: a formative social marketing study. Journal of Social Marketing, 8(1), pp.40-57.
Freebairn, J., Kenny, P., Blissenden, M., Villios, S., Yong, S., Martin, F., Yesegat, W.A.,
Coolidge, J., Corthay, L.O., Loiacono, R. and Mortimer, C., 2017. eJournal of Tax
Research. eJournal of Tax Research, 15(1), pp.105-118.
Kenny, P., Blissenden, M. and Villios, S., 2017. Wine options of Australian tax
reform. eJournal of Tax Research, 15(1), pp.22-50.
Liu, Y., Lintonen, T., Tynjälä, J., Villberg, J., Välimaa, R., Ojala, K. and Kannas, L., 2018.
Socioeconomic differences in the use of alcohol and drunkenness in adolescents: Trends in
the Health Behaviour in School-aged Children study in Finland 1990–2014. Scandinavian
journal of public health, 46(1), pp.102-111.
Mattick, R.P., Wadolowski, M., Aiken, A., Clare, P.J., Hutchinson, D., Najman, J., Slade, T.,
Bruno, R., McBride, N., Degenhardt, L. and Kypri, K., 2017. Parental supply of alcohol and
alcohol consumption in adolescence: prospective cohort study. Psychological
medicine, 47(2), pp.267-278.
Movsisyan, S.A. and Grigoryan, K.A., 2018. Increasing the competitiveness of Armenian
beer. Annals of Agrarian Science, 16(1), pp.78-84.
Noel, M.D. and Roach, T., 2016. Regulated and unregulated substitutes: aversion effects of
an ethanol mandate. Economic Inquiry, 54(2), pp.1150-1166.
Pettigrew, S., Biagioni, N., Jones, S.C., Daube, M., Kirby, G., Stafford, J. and Chikritzhs, T.,
2015. Sales promotion strategies and youth drinking in Australia. Social Science &
Medicine, 141, pp.115-122.
⊘ This is a preview!⊘
Do you want full access?
Subscribe today to unlock all pages.

Trusted by 1+ million students worldwide
1 out of 9
Related Documents

Your All-in-One AI-Powered Toolkit for Academic Success.
+13062052269
info@desklib.com
Available 24*7 on WhatsApp / Email
Unlock your academic potential
Copyright © 2020–2025 A2Z Services. All Rights Reserved. Developed and managed by ZUCOL.