Data Analysis and Strategies for Cost Reduction in Aldi's Supply Chain
VerifiedAdded on 2023/01/16
|21
|5016
|38
Report
AI Summary
This report provides a detailed analysis of Aldi's supply chain management, with a primary focus on identifying and implementing cost reduction strategies. The report begins with an understanding of the business objectives, particularly the goal of minimizing costs within the supply chain. It then delves into the processes of data collection and understanding, detailing the use of surveys to gather information from Aldi's suppliers. The data integration section discusses the structure of the collected datasets and highlights missing variables, suggesting areas for future research. The report employs inferential statistics, including t-tests and regression analysis, to examine the relationships between variables such as unit price, shipment methods, and vendor pricing. The analysis reveals insights into the factors influencing costs and provides recommendations for optimizing the supply chain, ultimately aiming to improve Aldi's operational efficiency and profitability. The report also touches on ethical considerations in data collection and concludes with a summary of findings and recommendations.
Data Design- Part 2
1
1
Paraphrase This Document
Need a fresh take? Get an instant paraphrase of this document with our AI Paraphraser
Table of Contents
BUSINESS UNDERSTANDING...................................................................................................3
DATA COLLECTION AND UNDERSTANDING.......................................................................4
DATA INTEGRATION..................................................................................................................5
INFERENTIAL STATISTICS........................................................................................................6
DEPLOYMENT ETHICS AND CONCLUSION.........................................................................17
REFERENCES..............................................................................................................................19
Appendix........................................................................................................................................20
2
BUSINESS UNDERSTANDING
For every business it is important to manage its supply chain so that cost can be reduced.
The supply chain management is integral part of organisation. The overall production and
delivering of goods depend on SCM. However, if costs are not properly managed and controlled
it impact on business efficiency. (Dong, Ma and Xin, 2017)
Supply chain plays a vital role in managing, storing, stock as well as inventory. It is an
integral part of business where all activities are interrelated to each other. The track records of
finished products and raw material are kept to ensure they are delivered to vendors or suppliers at
right time. With help of supply chain, business is able to gain competitive advantage. Having a
better supply chain increases efficiency of business. If goods are delivered on time it helps in
generating customer value. Moreover, entire operating cost depend on supply chain. The main
objective is to identify strategies to reduce the cost of supply chain in Aldi. this is because it will
help in generating more profits and decreasing operational cost. It is identified that there are
various types of business objectives. They are economic, social global, operational, etc. These all
objectives are categorised on basis of its size and area. They are short, medium and long term
objectives. Thus, the above objective target on supply chain management and is a long term
objective. However, type of business objective is cost based. (Barday, 2018)
The consequences of this business objective for Aldi is that extra cost incurred in supply
chain will be minimised. In addition, the overall process of supply chain will be improved. This
means that suppliers and vendors records are maintained. Along with it, with help of strategies
delivery and arrival date of raw materials is tracked and recorded in effective way. besides that,
in future Aldi can gain value from supply chain. This will also result in enhancing efficiency and
eliminating deviations from the process. In addition to it, Aldi SCM process will become flexible
and quick. Hence, Aldi will be able to gain competitive advantage in retail sector in the future.
In order to collect data and information about supply chain management of Aldi and to get
answer of research question, there are certain requirements which is to be taken into
consideration. Also, data collection depends on type of question. It is important to analyse the
data requirement so that questions can be prepared. Alongside, as data is of various types the
main thing to be consider is validity, reliability, etc. besides that, in present study, a survey is
conducted to gather data of supply chain. It is because of as Aldi contains a lot of vendors that
are located in different regions. Moreover, the survey is suitable tool for data collection.
3
⊘ This is a preview!⊘
Do you want full access?
Subscribe today to unlock all pages.
Trusted by 1+ million students worldwide
However, unit of analysis is large and suppliers need to be asked specific questions.
Furthermore, it is evaluated that implication of survey is all data related to schedule, supplier,
unit cost, etc. will be gathered easily. Also, survey will be easy to conduct and by analysing data
relevant information can be obtained. (Varley, Miglio and Hautier, 2017)
However, there are certain risk that can occur in data analysis. It can highly impact on
validity and outcomes of research. So, by doing risk assessment impact of risk can be minimised.
Thus, risk are as follows :-
Applicability- In this risk the data gathered through survey may not be applicable. The data
collected is irrelevant.
Availability of resources- here, resources required to collect data may not be available. It will
highly impact on authenticity of data. Also, ineffective utilization of resources may lead to rise in
cost of study.
Ethics – ethics risk may occur if data is not properly gathered. It means that without consent of
participants data is collected. Moreover, data is collected from third party, database, etc.
Time - it is a risk where there may be delay in research. Therefore, with increase in time, cost
will also increase.
There are various business rules that needs to be applied. The data must not be shared
with any third party. Also, data could only be used in developing practices and solving cost
reduction. The data collected must be relevant to business. Hence, these are rules that has to be
followed. (Hsu and Kuo, 2017)
DATA COLLECTION AND UNDERSTANDING
Dataset 1
The dataset is entirely related to supply chain of Aldi. In this many elements are included
like unit price, vendor, schedule date and time, etc. Moreover, it includes type of raw material,
supplier name, etc. the data is gathered from suppliers of Aldi. It is been gathered through survey
in which questions are asked to them. In data set country name, delivery date to third party, is
shown. This dataset applies to Aldi as it reflects on price, weight, freight cost, etc. of raw
materials. Therefore, by identifying cost and unit price it will be easy to apply strategies to
reduce cost. Along with it, it will be identified that how much variation each vendor has on cost
in same country. The tool that was used to collect data is survey. In that sample population taken
was 30 suppliers. While in collecting data, it was considered that no sample is discriminated on
4
Paraphrase This Document
Need a fresh take? Get an instant paraphrase of this document with our AI Paraphraser
basis of profit or sales. Moreover, it was ensured that supplier provide precise and relevant data
only.
Dataset 2
This dataset includes data of supplier, price, discount, customer feedback, etc. Through
that it is easy to find out identify out that how changing mode of shipment can result in bringing
variation in price. Besides that, data set provide detail of city, quantity, etc. in which products are
delivered to customers. The delivery and order date of product is mentioned as well. Thus, it will
be easy for organisation to calculate that how price of product can be reduced and how on basis
of customer feedback supplier can be selected (Kim, Schweickart and Pfister, 2016). However,
for data gathering survey tool was is selected. The sample population is 30 vendors. While in
collecting data, it was considered that no sample is discriminated on basis of profit or sales.
Moreover, no supplier was ignored on basis of city and its performance.
DATA INTEGRATION
It can be determined that the dataset collected is in tabular format. In that each column
represent a different variable. Moreover, each column the text used to describe is variable. Also,
data values is represented in key value pair format. In dataset no metadata records are included.
Datasets normally contain one or more data records from a single source representing the same
type of instance(s). However, the flexibility of a dataset can accommodate any other less-usual
use cases. Datasets may reside on the Web as well as be stored locally. Each dataset is uniquely
identified with standard metadata characterizations.
It can be identified that in dataset there are many variables which is missing. Due to it,
outcomes obtained from it is also affected. The variables missing are practices used by supplier,
distance covered, number of products delivered or sold, etc. Apart from it, other variables such
as total cost incurred, profit, variable cost, etc. therefore, in future research these variables can be
used and identified. It will provide in depth and detailed information related to how cost can be
reduced in supply chain. (Antons and Breidbach, 2018)
Exploratory analysis- it is a process of analyze data to identify main characteristics. It is a
statistical method to interpret data. With help of EDA it becomes easy to identify what data can
tell in future. Also, hypothesis testing is done in this. The approach is based on visualization to
obtain results of data.
5
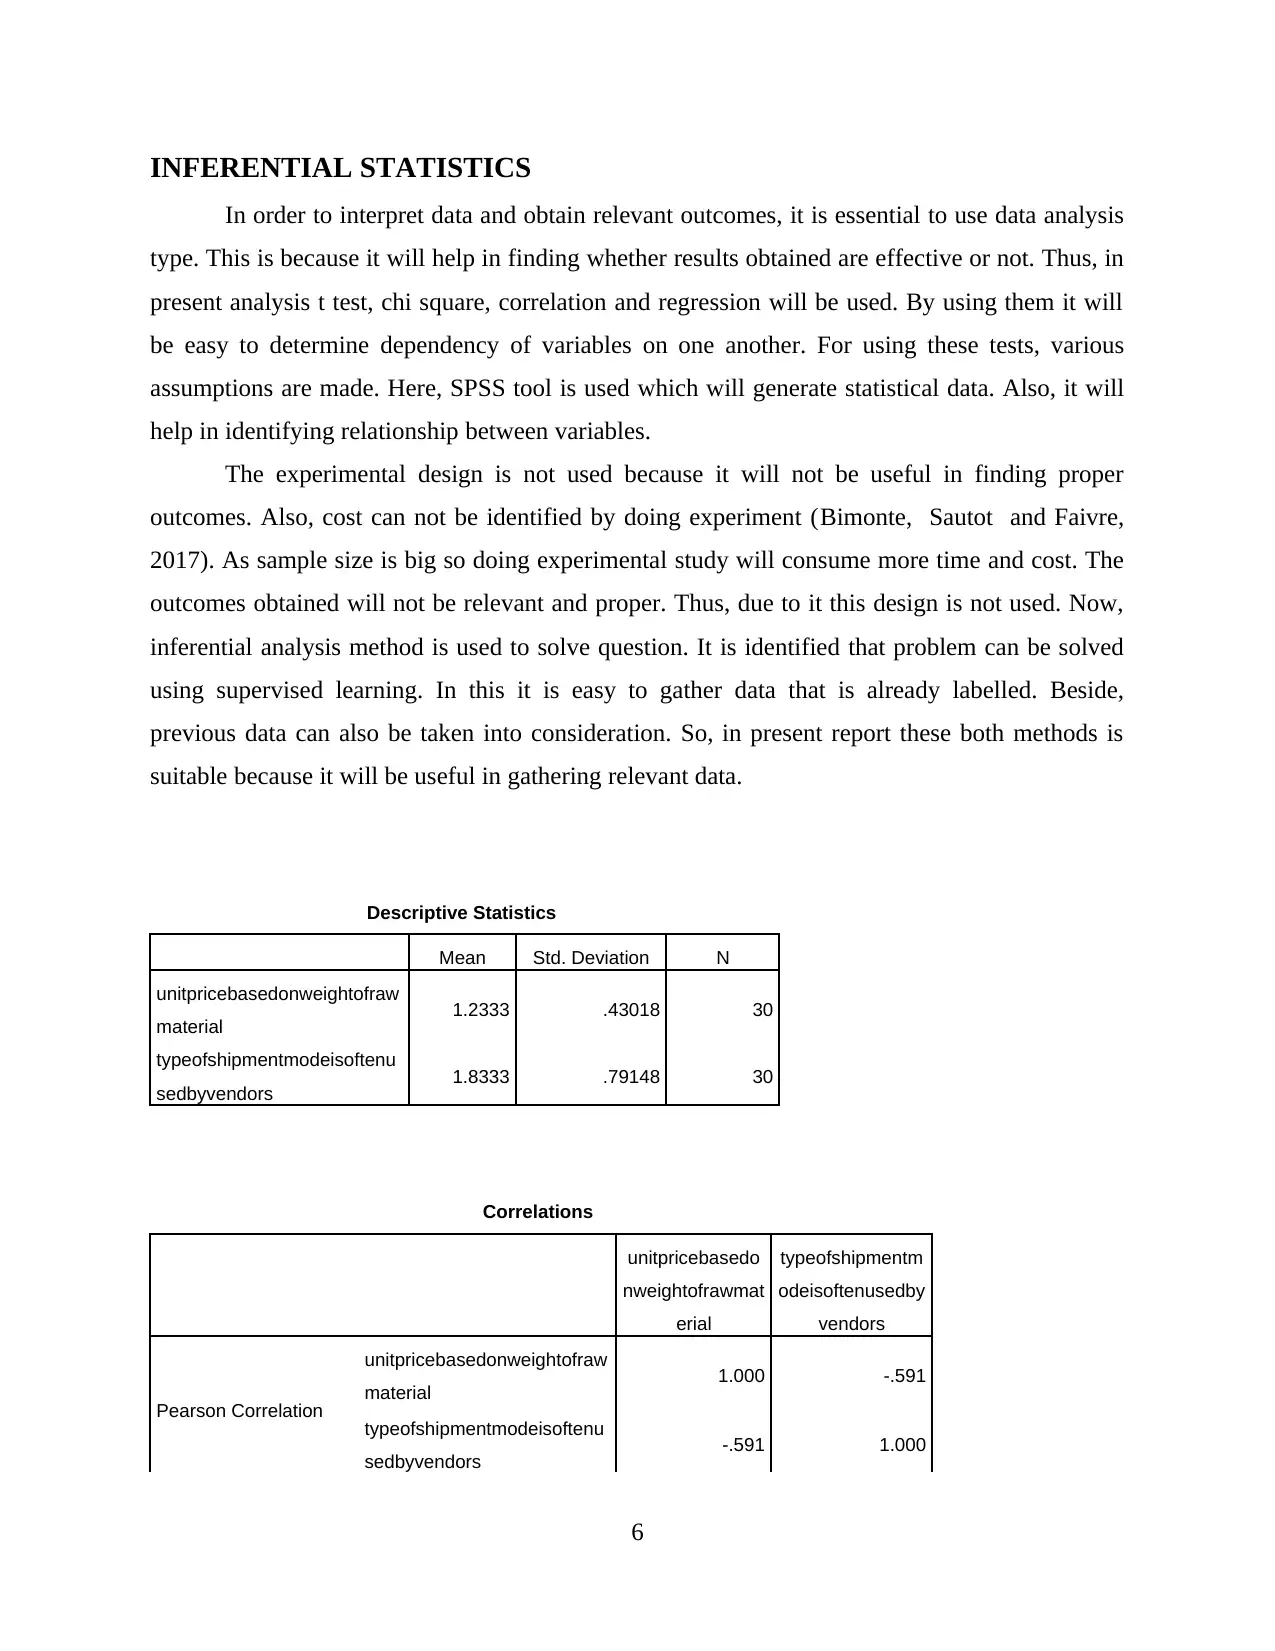
INFERENTIAL STATISTICS
In order to interpret data and obtain relevant outcomes, it is essential to use data analysis
type. This is because it will help in finding whether results obtained are effective or not. Thus, in
present analysis t test, chi square, correlation and regression will be used. By using them it will
be easy to determine dependency of variables on one another. For using these tests, various
assumptions are made. Here, SPSS tool is used which will generate statistical data. Also, it will
help in identifying relationship between variables.
The experimental design is not used because it will not be useful in finding proper
outcomes. Also, cost can not be identified by doing experiment (Bimonte, Sautot and Faivre,
2017). As sample size is big so doing experimental study will consume more time and cost. The
outcomes obtained will not be relevant and proper. Thus, due to it this design is not used. Now,
inferential analysis method is used to solve question. It is identified that problem can be solved
using supervised learning. In this it is easy to gather data that is already labelled. Beside,
previous data can also be taken into consideration. So, in present report these both methods is
suitable because it will be useful in gathering relevant data.
Descriptive Statistics
Mean Std. Deviation N
unitpricebasedonweightofraw
material 1.2333 .43018 30
typeofshipmentmodeisoftenu
sedbyvendors 1.8333 .79148 30
Correlations
unitpricebasedo
nweightofrawmat
erial
typeofshipmentm
odeisoftenusedby
vendors
Pearson Correlation
unitpricebasedonweightofraw
material 1.000 -.591
typeofshipmentmodeisoftenu
sedbyvendors -.591 1.000
6
⊘ This is a preview!⊘
Do you want full access?
Subscribe today to unlock all pages.
Trusted by 1+ million students worldwide
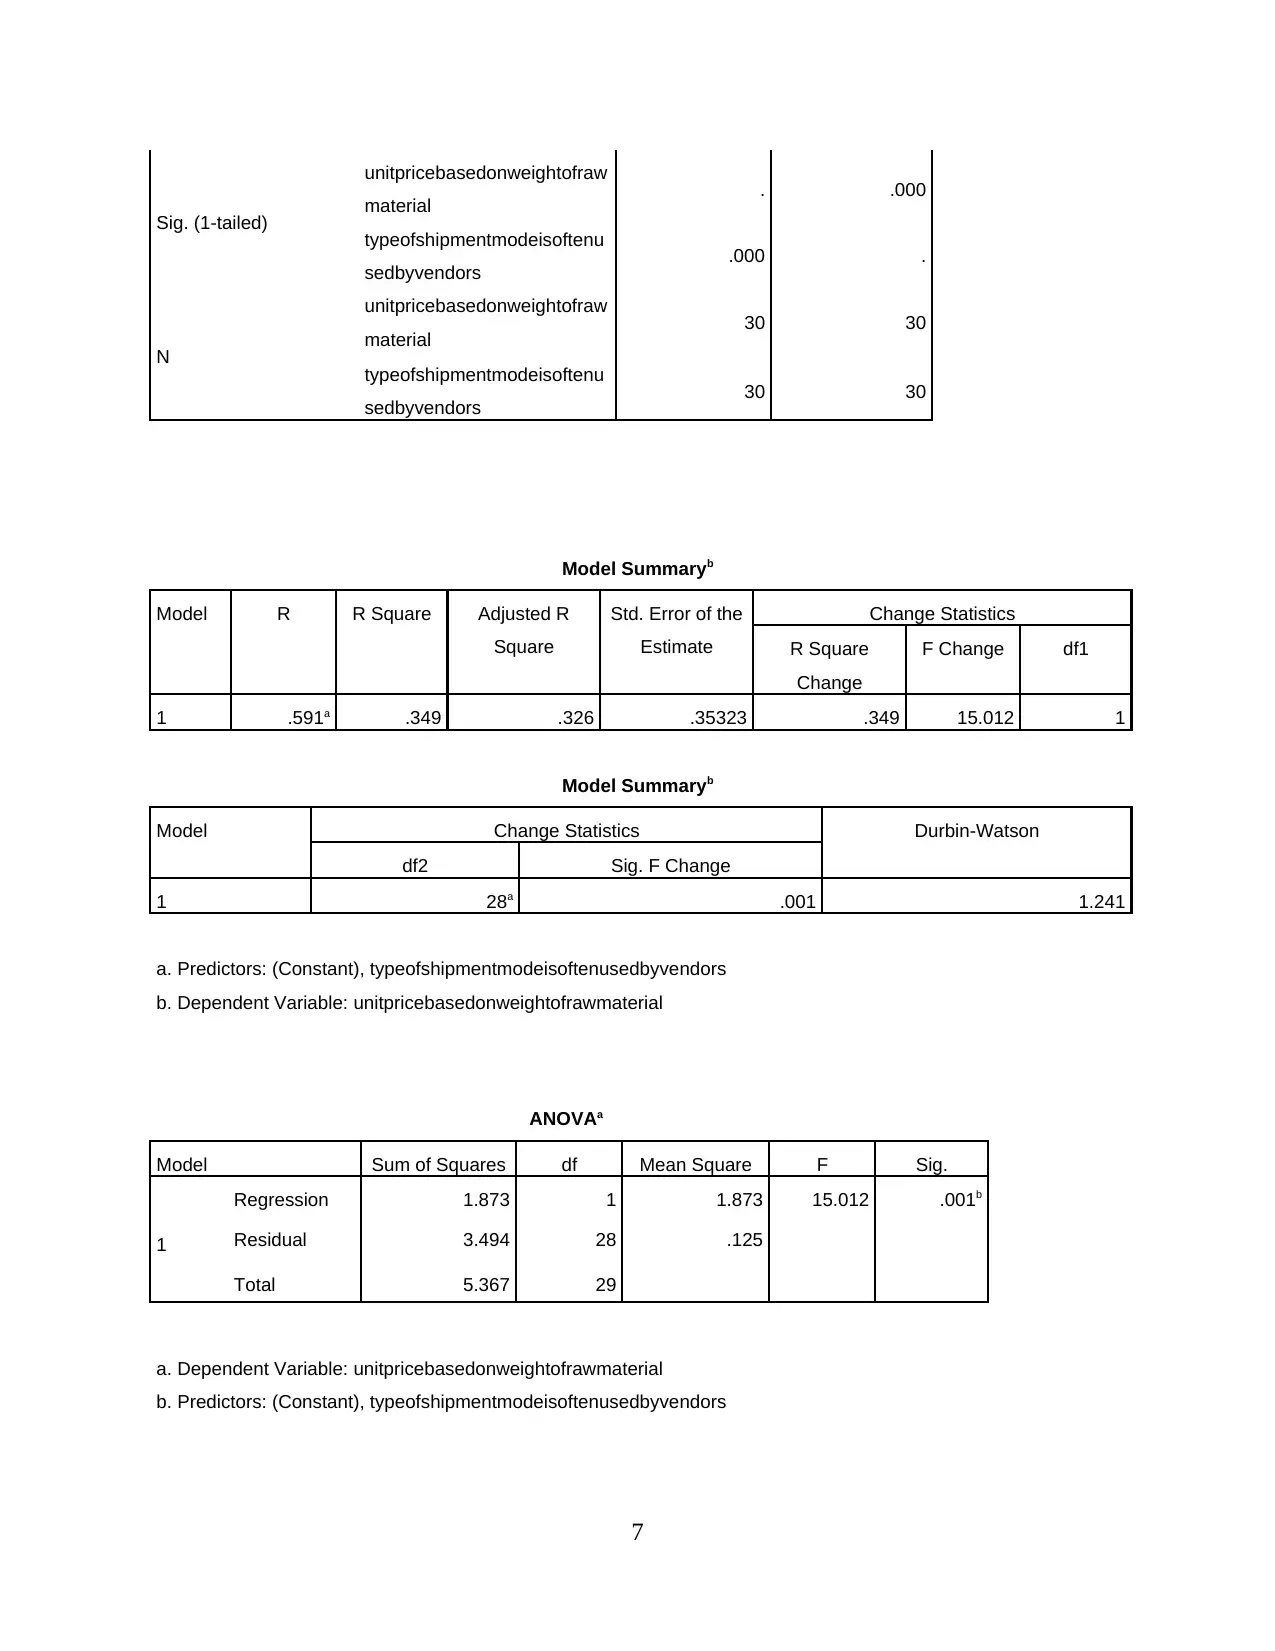
Sig. (1-tailed)
unitpricebasedonweightofraw
material . .000
typeofshipmentmodeisoftenu
sedbyvendors .000 .
N
unitpricebasedonweightofraw
material 30 30
typeofshipmentmodeisoftenu
sedbyvendors 30 30
Model Summaryb
Model R R Square Adjusted R
Square
Std. Error of the
Estimate
Change Statistics
R Square
Change
F Change df1
1 .591a .349 .326 .35323 .349 15.012 1
Model Summaryb
Model Change Statistics Durbin-Watson
df2 Sig. F Change
1 28a .001 1.241
a. Predictors: (Constant), typeofshipmentmodeisoftenusedbyvendors
b. Dependent Variable: unitpricebasedonweightofrawmaterial
ANOVAa
Model Sum of Squares df Mean Square F Sig.
1
Regression 1.873 1 1.873 15.012 .001b
Residual 3.494 28 .125
Total 5.367 29
a. Dependent Variable: unitpricebasedonweightofrawmaterial
b. Predictors: (Constant), typeofshipmentmodeisoftenusedbyvendors
7
unitpricebasedonweightofraw
material . .000
typeofshipmentmodeisoftenu
sedbyvendors .000 .
N
unitpricebasedonweightofraw
material 30 30
typeofshipmentmodeisoftenu
sedbyvendors 30 30
Model Summaryb
Model R R Square Adjusted R
Square
Std. Error of the
Estimate
Change Statistics
R Square
Change
F Change df1
1 .591a .349 .326 .35323 .349 15.012 1
Model Summaryb
Model Change Statistics Durbin-Watson
df2 Sig. F Change
1 28a .001 1.241
a. Predictors: (Constant), typeofshipmentmodeisoftenusedbyvendors
b. Dependent Variable: unitpricebasedonweightofrawmaterial
ANOVAa
Model Sum of Squares df Mean Square F Sig.
1
Regression 1.873 1 1.873 15.012 .001b
Residual 3.494 28 .125
Total 5.367 29
a. Dependent Variable: unitpricebasedonweightofrawmaterial
b. Predictors: (Constant), typeofshipmentmodeisoftenusedbyvendors
7
Paraphrase This Document
Need a fresh take? Get an instant paraphrase of this document with our AI Paraphraser
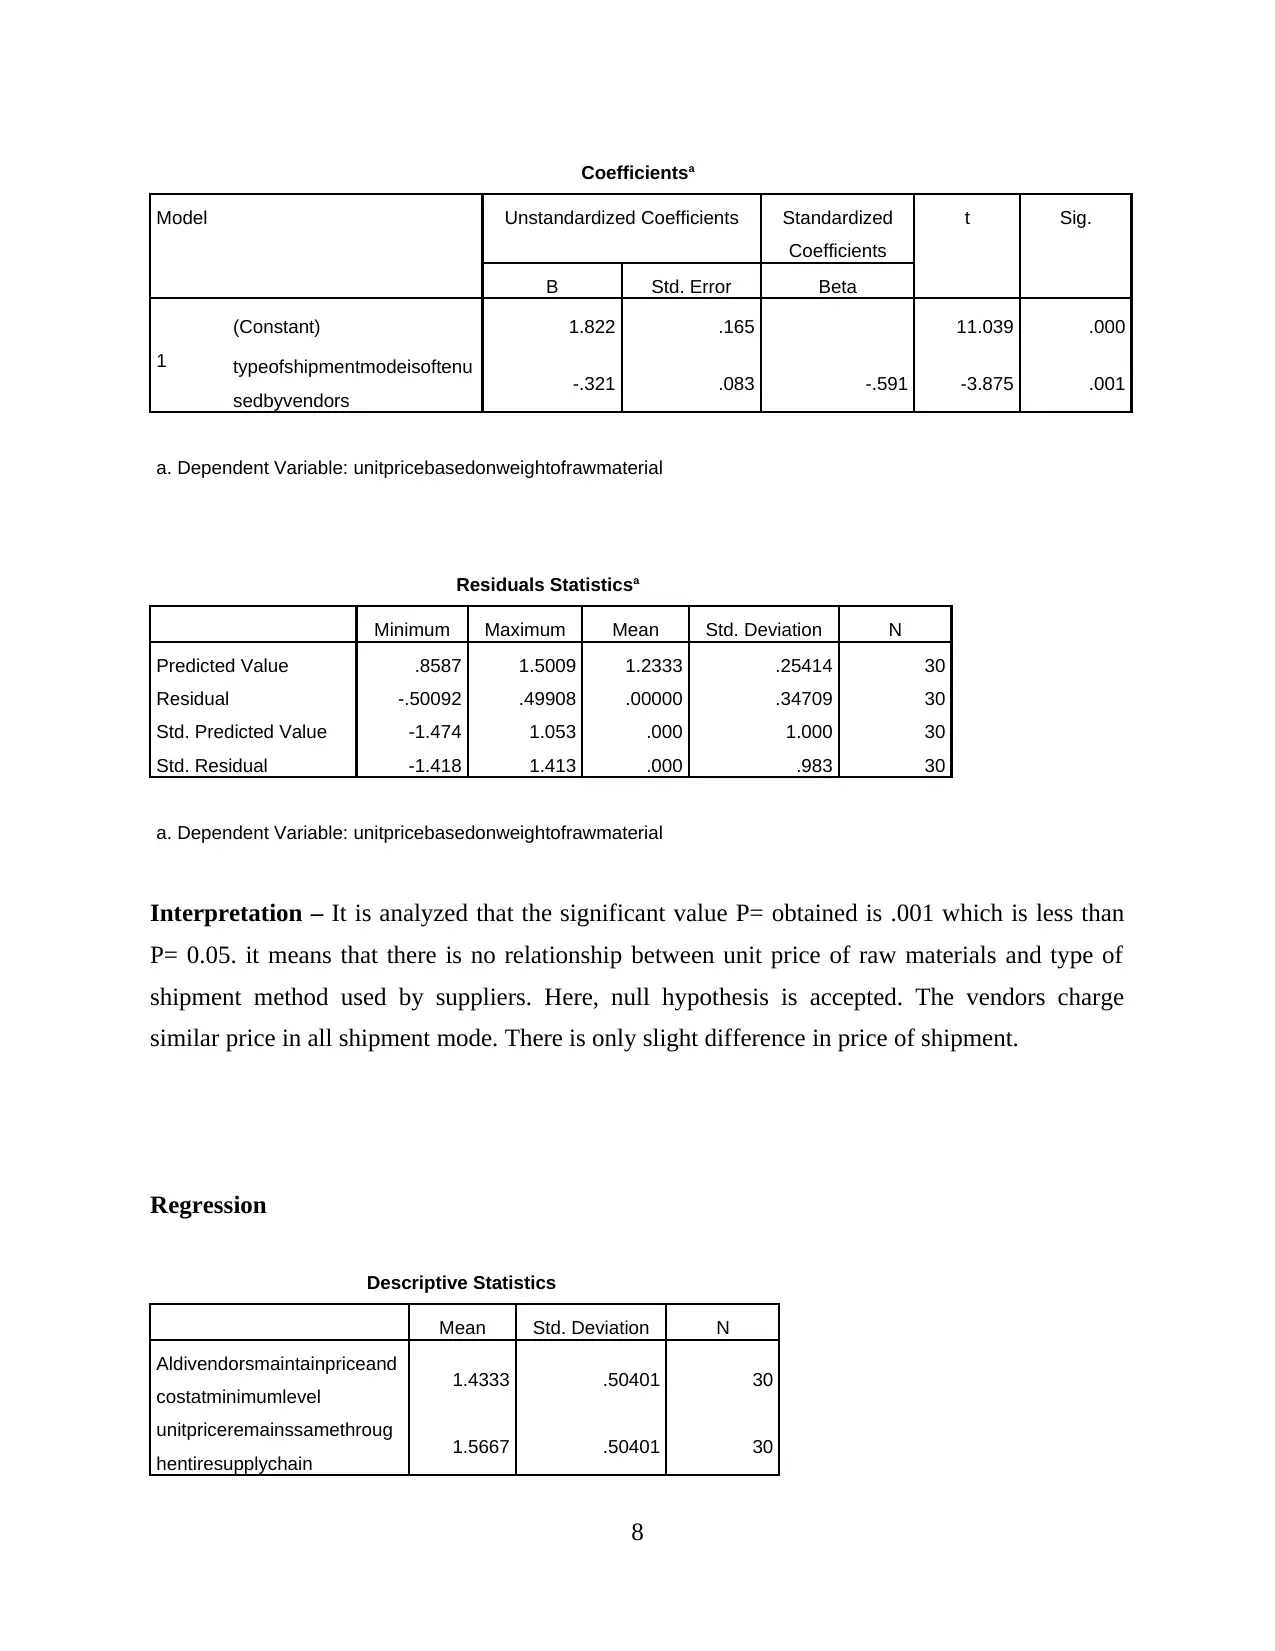
Coefficientsa
Model Unstandardized Coefficients Standardized
Coefficients
t Sig.
B Std. Error Beta
1
(Constant) 1.822 .165 11.039 .000
typeofshipmentmodeisoftenu
sedbyvendors -.321 .083 -.591 -3.875 .001
a. Dependent Variable: unitpricebasedonweightofrawmaterial
Residuals Statisticsa
Minimum Maximum Mean Std. Deviation N
Predicted Value .8587 1.5009 1.2333 .25414 30
Residual -.50092 .49908 .00000 .34709 30
Std. Predicted Value -1.474 1.053 .000 1.000 30
Std. Residual -1.418 1.413 .000 .983 30
a. Dependent Variable: unitpricebasedonweightofrawmaterial
Interpretation – It is analyzed that the significant value P= obtained is .001 which is less than
P= 0.05. it means that there is no relationship between unit price of raw materials and type of
shipment method used by suppliers. Here, null hypothesis is accepted. The vendors charge
similar price in all shipment mode. There is only slight difference in price of shipment.
Regression
Descriptive Statistics
Mean Std. Deviation N
Aldivendorsmaintainpriceand
costatminimumlevel 1.4333 .50401 30
unitpriceremainssamethroug
hentiresupplychain 1.5667 .50401 30
8
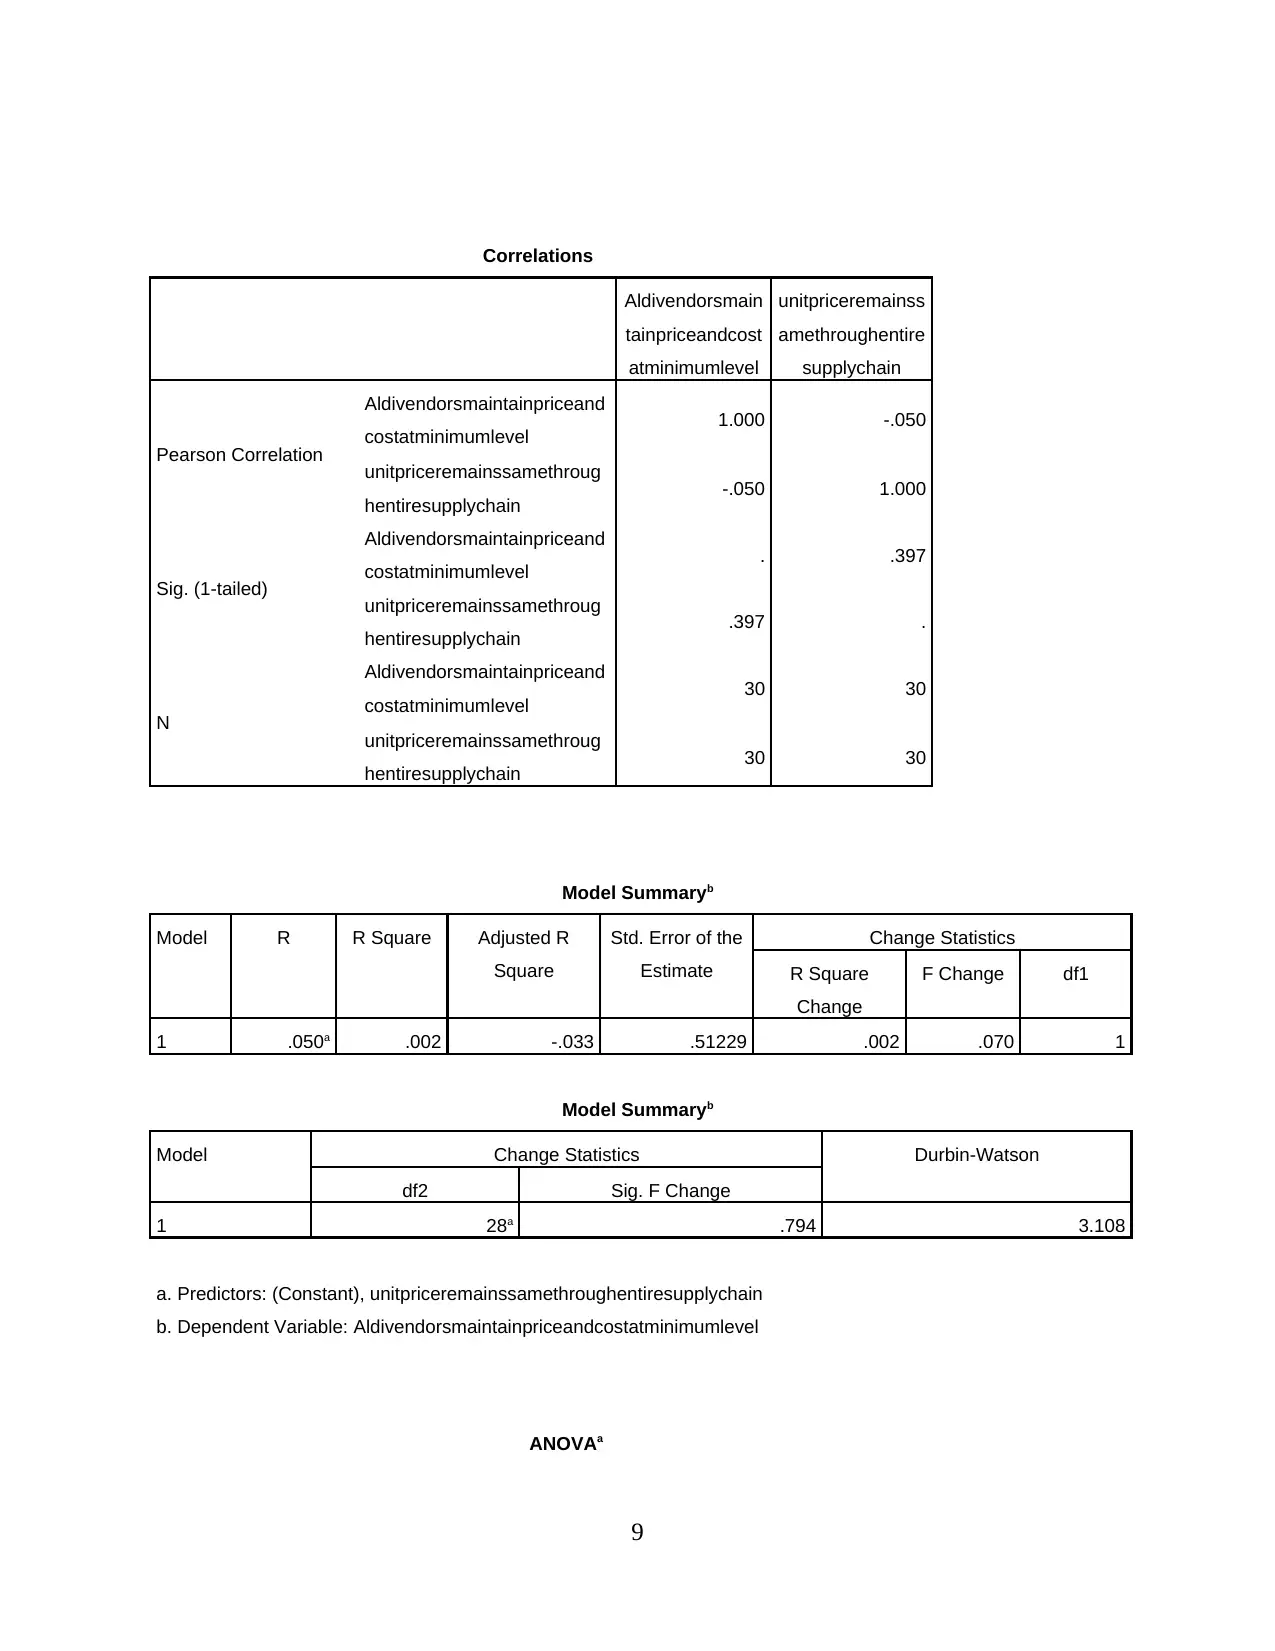
Correlations
Aldivendorsmain
tainpriceandcost
atminimumlevel
unitpriceremainss
amethroughentire
supplychain
Pearson Correlation
Aldivendorsmaintainpriceand
costatminimumlevel 1.000 -.050
unitpriceremainssamethroug
hentiresupplychain -.050 1.000
Sig. (1-tailed)
Aldivendorsmaintainpriceand
costatminimumlevel . .397
unitpriceremainssamethroug
hentiresupplychain .397 .
N
Aldivendorsmaintainpriceand
costatminimumlevel 30 30
unitpriceremainssamethroug
hentiresupplychain 30 30
Model Summaryb
Model R R Square Adjusted R
Square
Std. Error of the
Estimate
Change Statistics
R Square
Change
F Change df1
1 .050a .002 -.033 .51229 .002 .070 1
Model Summaryb
Model Change Statistics Durbin-Watson
df2 Sig. F Change
1 28a .794 3.108
a. Predictors: (Constant), unitpriceremainssamethroughentiresupplychain
b. Dependent Variable: Aldivendorsmaintainpriceandcostatminimumlevel
ANOVAa
9
⊘ This is a preview!⊘
Do you want full access?
Subscribe today to unlock all pages.
Trusted by 1+ million students worldwide
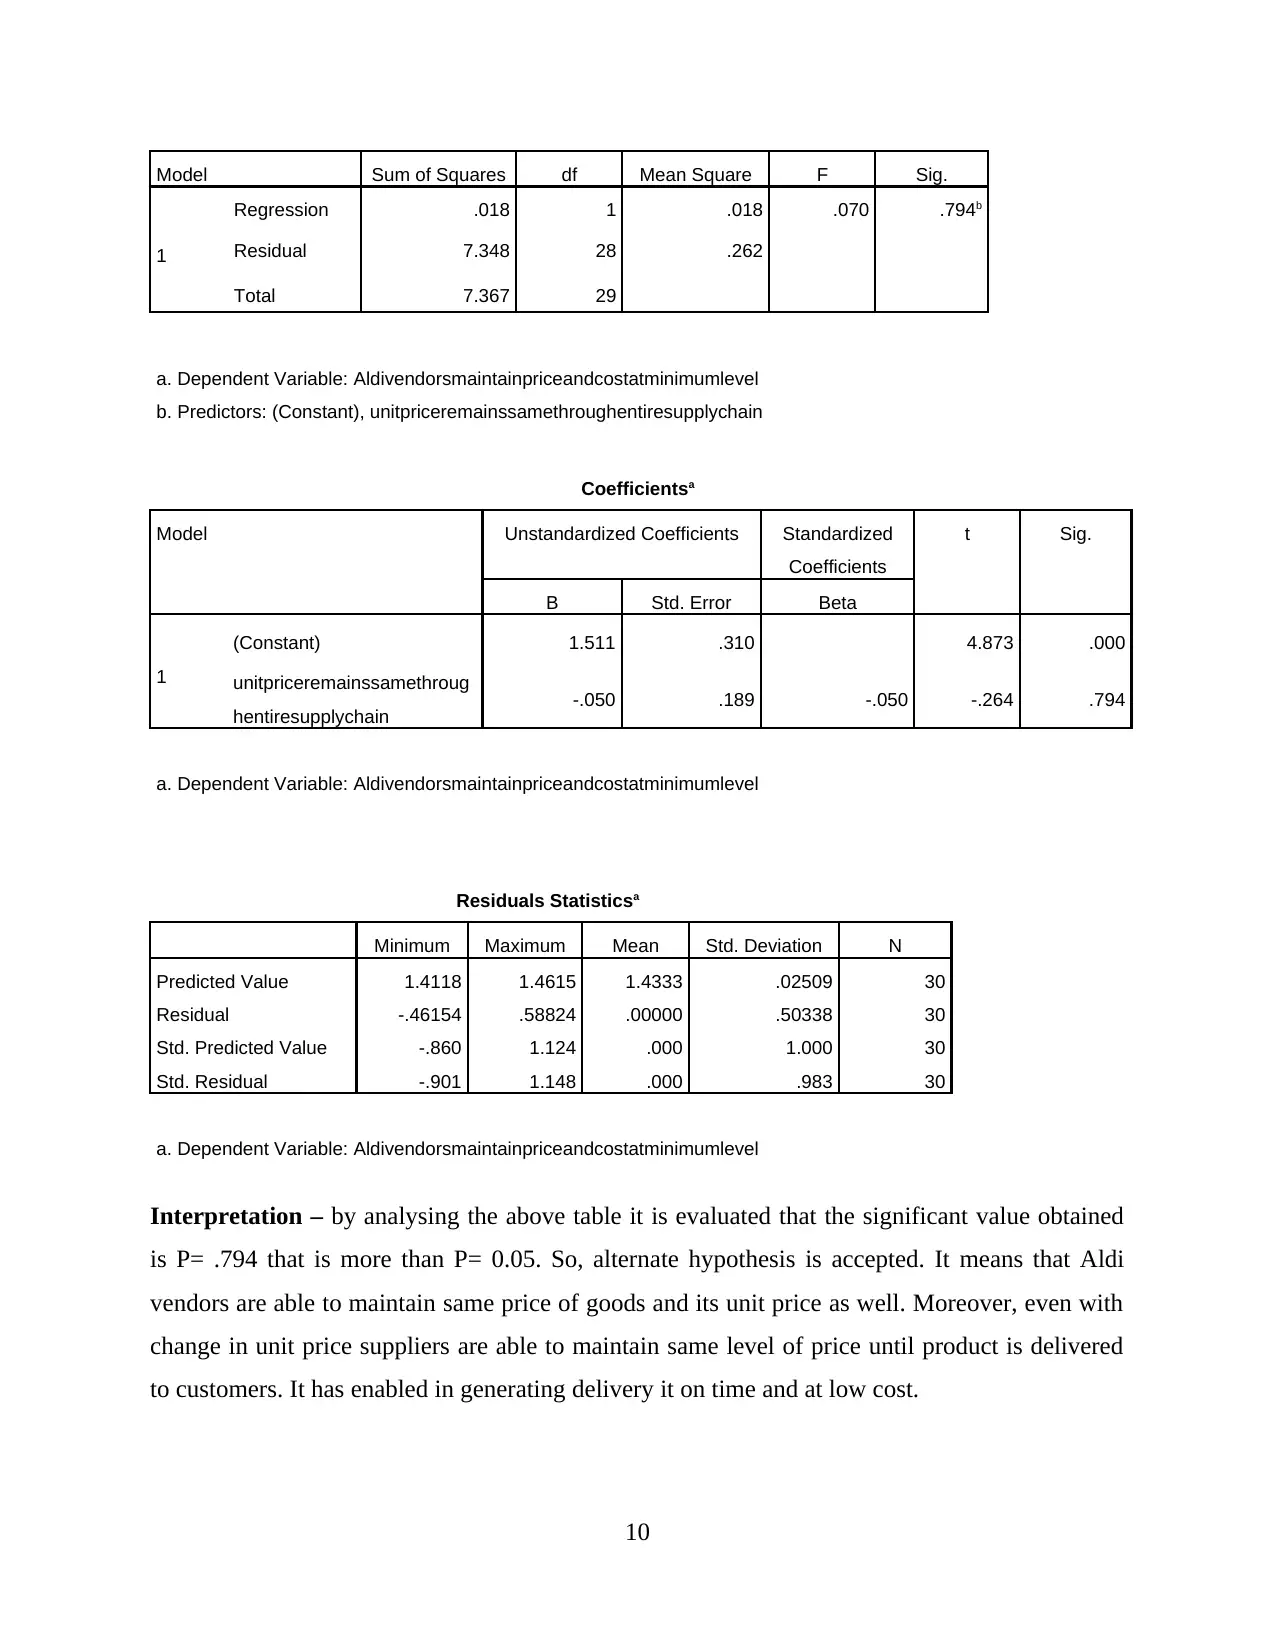
Model Sum of Squares df Mean Square F Sig.
1
Regression .018 1 .018 .070 .794b
Residual 7.348 28 .262
Total 7.367 29
a. Dependent Variable: Aldivendorsmaintainpriceandcostatminimumlevel
b. Predictors: (Constant), unitpriceremainssamethroughentiresupplychain
Coefficientsa
Model Unstandardized Coefficients Standardized
Coefficients
t Sig.
B Std. Error Beta
1
(Constant) 1.511 .310 4.873 .000
unitpriceremainssamethroug
hentiresupplychain -.050 .189 -.050 -.264 .794
a. Dependent Variable: Aldivendorsmaintainpriceandcostatminimumlevel
Residuals Statisticsa
Minimum Maximum Mean Std. Deviation N
Predicted Value 1.4118 1.4615 1.4333 .02509 30
Residual -.46154 .58824 .00000 .50338 30
Std. Predicted Value -.860 1.124 .000 1.000 30
Std. Residual -.901 1.148 .000 .983 30
a. Dependent Variable: Aldivendorsmaintainpriceandcostatminimumlevel
Interpretation – by analysing the above table it is evaluated that the significant value obtained
is P= .794 that is more than P= 0.05. So, alternate hypothesis is accepted. It means that Aldi
vendors are able to maintain same price of goods and its unit price as well. Moreover, even with
change in unit price suppliers are able to maintain same level of price until product is delivered
to customers. It has enabled in generating delivery it on time and at low cost.
10
1
Regression .018 1 .018 .070 .794b
Residual 7.348 28 .262
Total 7.367 29
a. Dependent Variable: Aldivendorsmaintainpriceandcostatminimumlevel
b. Predictors: (Constant), unitpriceremainssamethroughentiresupplychain
Coefficientsa
Model Unstandardized Coefficients Standardized
Coefficients
t Sig.
B Std. Error Beta
1
(Constant) 1.511 .310 4.873 .000
unitpriceremainssamethroug
hentiresupplychain -.050 .189 -.050 -.264 .794
a. Dependent Variable: Aldivendorsmaintainpriceandcostatminimumlevel
Residuals Statisticsa
Minimum Maximum Mean Std. Deviation N
Predicted Value 1.4118 1.4615 1.4333 .02509 30
Residual -.46154 .58824 .00000 .50338 30
Std. Predicted Value -.860 1.124 .000 1.000 30
Std. Residual -.901 1.148 .000 .983 30
a. Dependent Variable: Aldivendorsmaintainpriceandcostatminimumlevel
Interpretation – by analysing the above table it is evaluated that the significant value obtained
is P= .794 that is more than P= 0.05. So, alternate hypothesis is accepted. It means that Aldi
vendors are able to maintain same price of goods and its unit price as well. Moreover, even with
change in unit price suppliers are able to maintain same level of price until product is delivered
to customers. It has enabled in generating delivery it on time and at low cost.
10
Paraphrase This Document
Need a fresh take? Get an instant paraphrase of this document with our AI Paraphraser
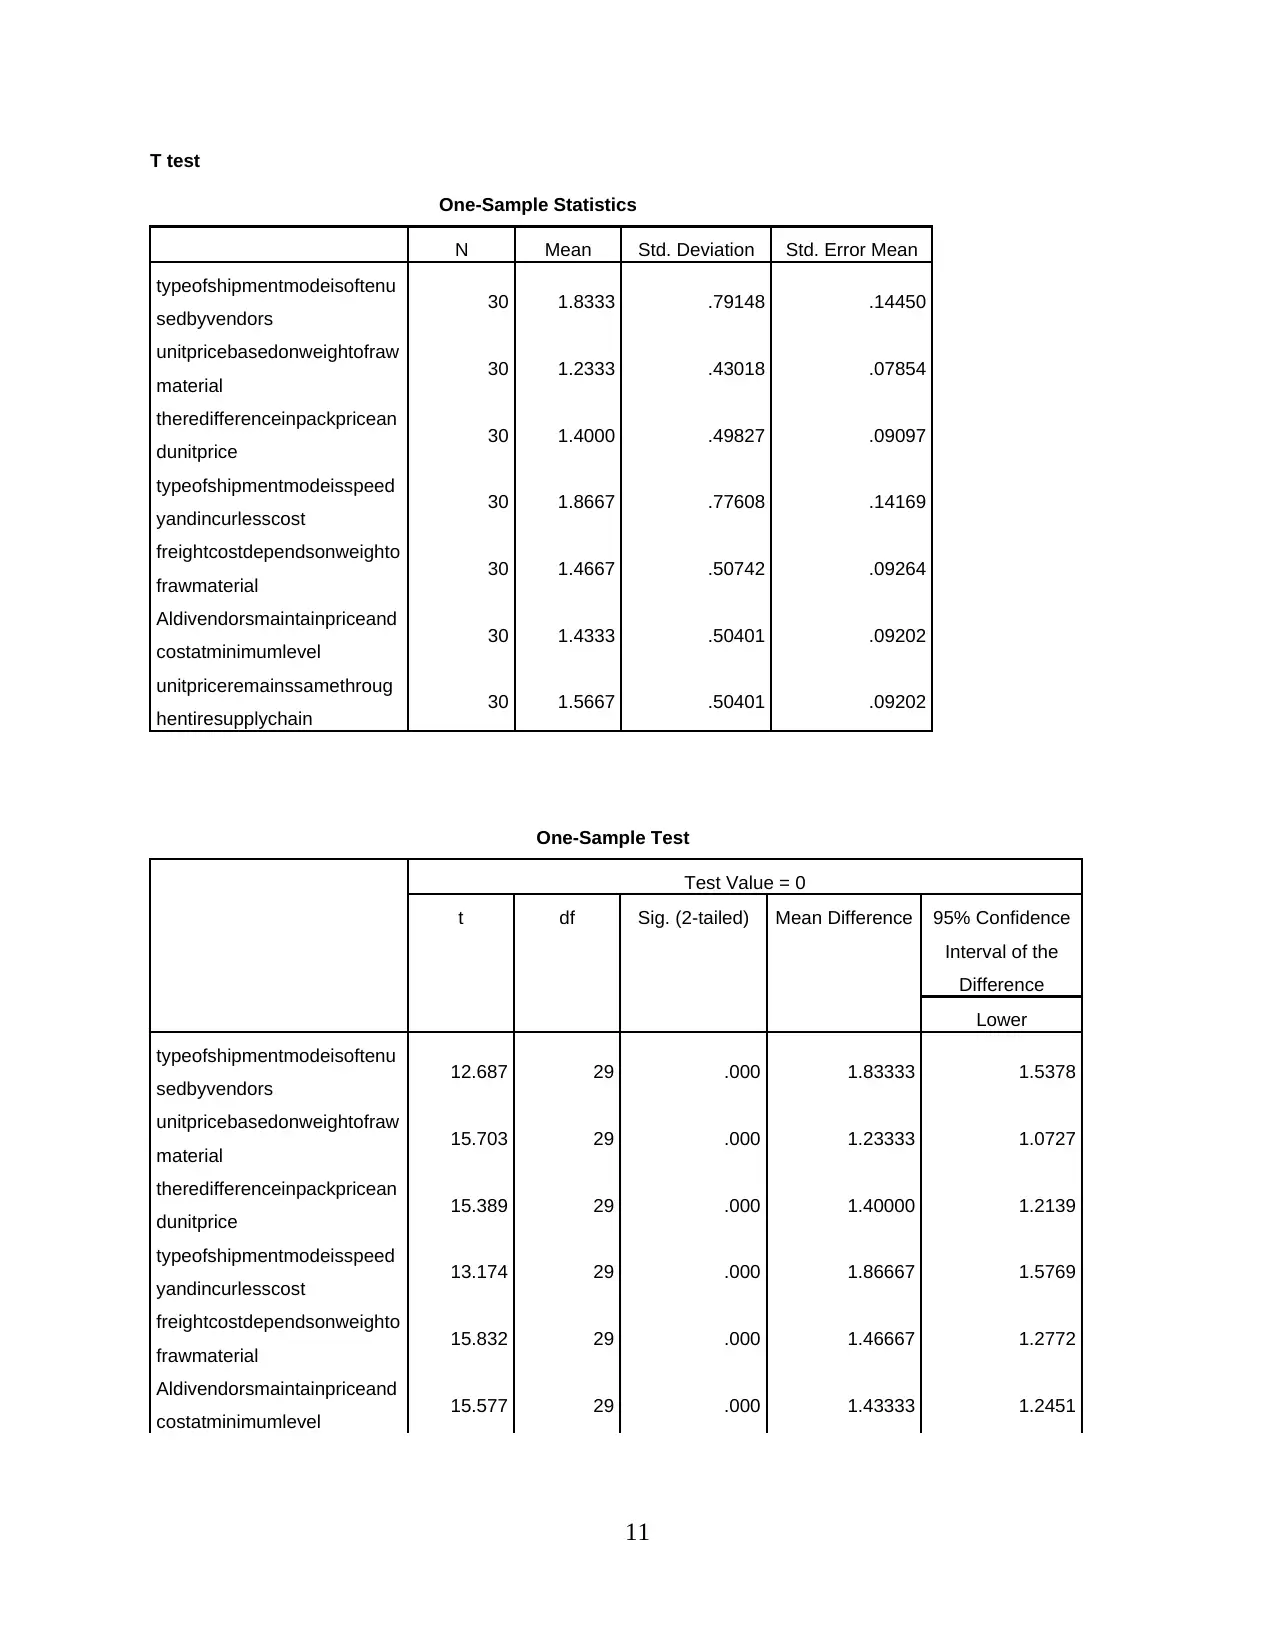
T test
One-Sample Statistics
N Mean Std. Deviation Std. Error Mean
typeofshipmentmodeisoftenu
sedbyvendors 30 1.8333 .79148 .14450
unitpricebasedonweightofraw
material 30 1.2333 .43018 .07854
theredifferenceinpackpricean
dunitprice 30 1.4000 .49827 .09097
typeofshipmentmodeisspeed
yandincurlesscost 30 1.8667 .77608 .14169
freightcostdependsonweighto
frawmaterial 30 1.4667 .50742 .09264
Aldivendorsmaintainpriceand
costatminimumlevel 30 1.4333 .50401 .09202
unitpriceremainssamethroug
hentiresupplychain 30 1.5667 .50401 .09202
One-Sample Test
Test Value = 0
t df Sig. (2-tailed) Mean Difference 95% Confidence
Interval of the
Difference
Lower
typeofshipmentmodeisoftenu
sedbyvendors 12.687 29 .000 1.83333 1.5378
unitpricebasedonweightofraw
material 15.703 29 .000 1.23333 1.0727
theredifferenceinpackpricean
dunitprice 15.389 29 .000 1.40000 1.2139
typeofshipmentmodeisspeed
yandincurlesscost 13.174 29 .000 1.86667 1.5769
freightcostdependsonweighto
frawmaterial 15.832 29 .000 1.46667 1.2772
Aldivendorsmaintainpriceand
costatminimumlevel 15.577 29 .000 1.43333 1.2451
11
unitpriceremainssamethroug
hentiresupplychain 17.026 29 .000 1.56667 1.3785
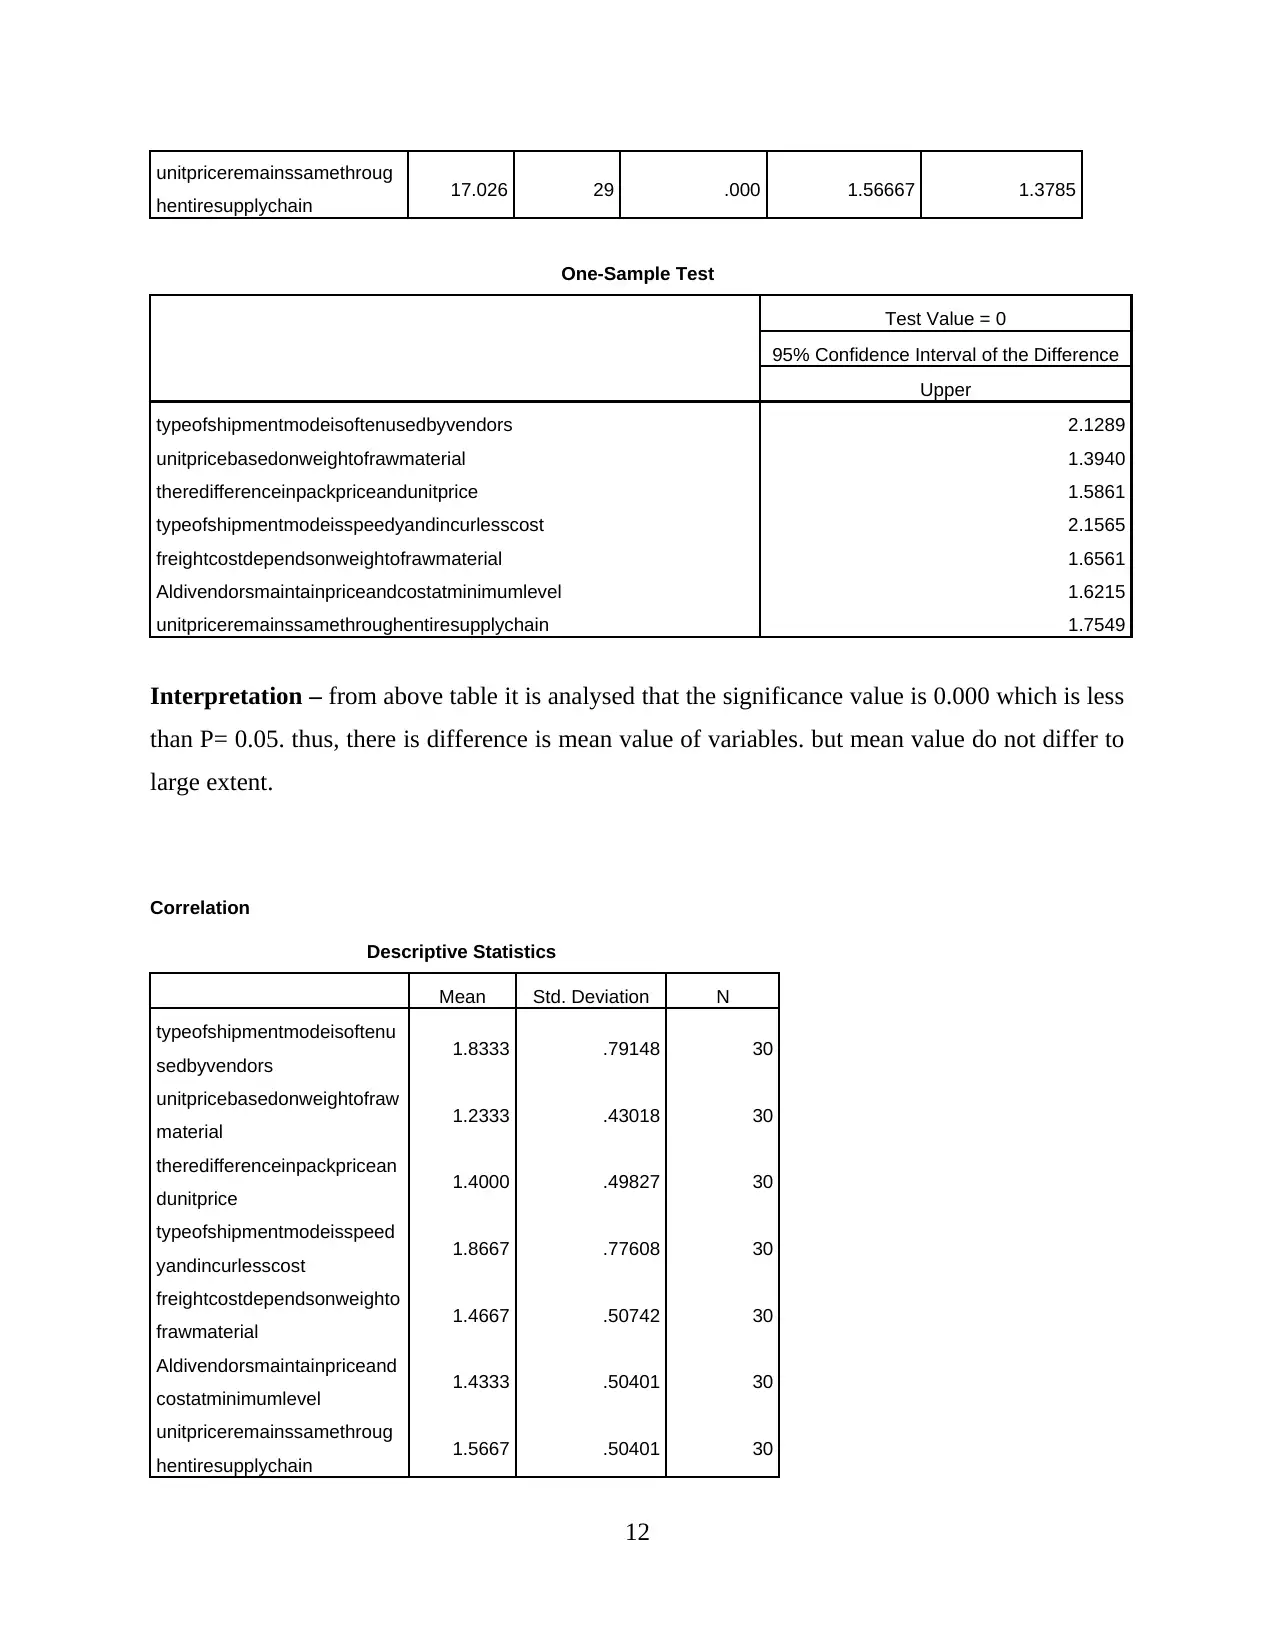
One-Sample Test
Test Value = 0
95% Confidence Interval of the Difference
Upper
typeofshipmentmodeisoftenusedbyvendors 2.1289
unitpricebasedonweightofrawmaterial 1.3940
theredifferenceinpackpriceandunitprice 1.5861
typeofshipmentmodeisspeedyandincurlesscost 2.1565
freightcostdependsonweightofrawmaterial 1.6561
Aldivendorsmaintainpriceandcostatminimumlevel 1.6215
unitpriceremainssamethroughentiresupplychain 1.7549
Interpretation – from above table it is analysed that the significance value is 0.000 which is less
than P= 0.05. thus, there is difference is mean value of variables. but mean value do not differ to
large extent.
Correlation
Descriptive Statistics
Mean Std. Deviation N
typeofshipmentmodeisoftenu
sedbyvendors 1.8333 .79148 30
unitpricebasedonweightofraw
material 1.2333 .43018 30
theredifferenceinpackpricean
dunitprice 1.4000 .49827 30
typeofshipmentmodeisspeed
yandincurlesscost 1.8667 .77608 30
freightcostdependsonweighto
frawmaterial 1.4667 .50742 30
Aldivendorsmaintainpriceand
costatminimumlevel 1.4333 .50401 30
unitpriceremainssamethroug
hentiresupplychain 1.5667 .50401 30
12
hentiresupplychain 17.026 29 .000 1.56667 1.3785
One-Sample Test
Test Value = 0
95% Confidence Interval of the Difference
Upper
typeofshipmentmodeisoftenusedbyvendors 2.1289
unitpricebasedonweightofrawmaterial 1.3940
theredifferenceinpackpriceandunitprice 1.5861
typeofshipmentmodeisspeedyandincurlesscost 2.1565
freightcostdependsonweightofrawmaterial 1.6561
Aldivendorsmaintainpriceandcostatminimumlevel 1.6215
unitpriceremainssamethroughentiresupplychain 1.7549
Interpretation – from above table it is analysed that the significance value is 0.000 which is less
than P= 0.05. thus, there is difference is mean value of variables. but mean value do not differ to
large extent.
Correlation
Descriptive Statistics
Mean Std. Deviation N
typeofshipmentmodeisoftenu
sedbyvendors 1.8333 .79148 30
unitpricebasedonweightofraw
material 1.2333 .43018 30
theredifferenceinpackpricean
dunitprice 1.4000 .49827 30
typeofshipmentmodeisspeed
yandincurlesscost 1.8667 .77608 30
freightcostdependsonweighto
frawmaterial 1.4667 .50742 30
Aldivendorsmaintainpriceand
costatminimumlevel 1.4333 .50401 30
unitpriceremainssamethroug
hentiresupplychain 1.5667 .50401 30
12
⊘ This is a preview!⊘
Do you want full access?
Subscribe today to unlock all pages.
Trusted by 1+ million students worldwide
1 out of 21
Related Documents


Your All-in-One AI-Powered Toolkit for Academic Success.
+13062052269
info@desklib.com
Available 24*7 on WhatsApp / Email
![[object Object]](/_next/static/media/star-bottom.7253800d.svg)
Unlock your academic potential
Copyright © 2020–2026 A2Z Services. All Rights Reserved. Developed and managed by ZUCOL.