ALLCURE INC. Project Evaluation Report: FIN20014 Financial Management
VerifiedAdded on  2023/06/04
|21
|3980
|161
Report
AI Summary
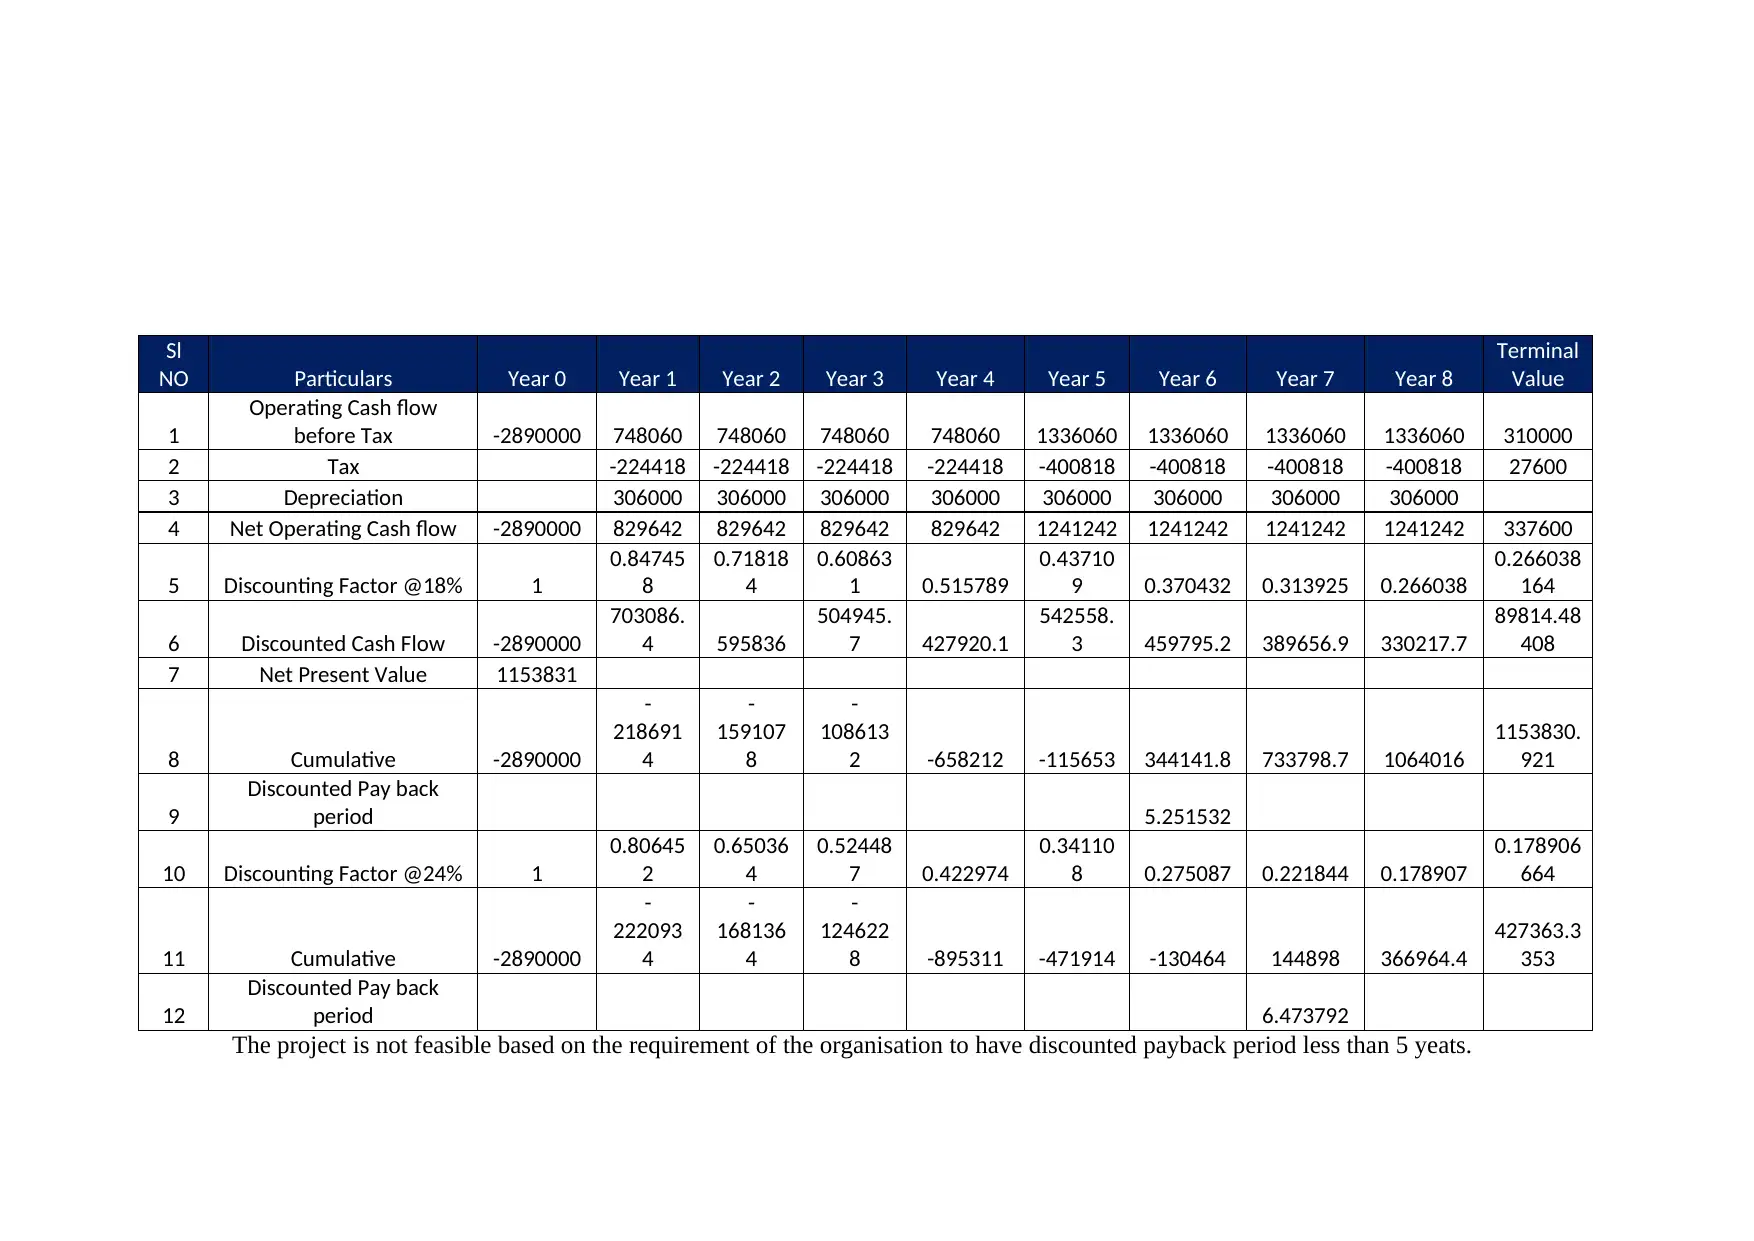
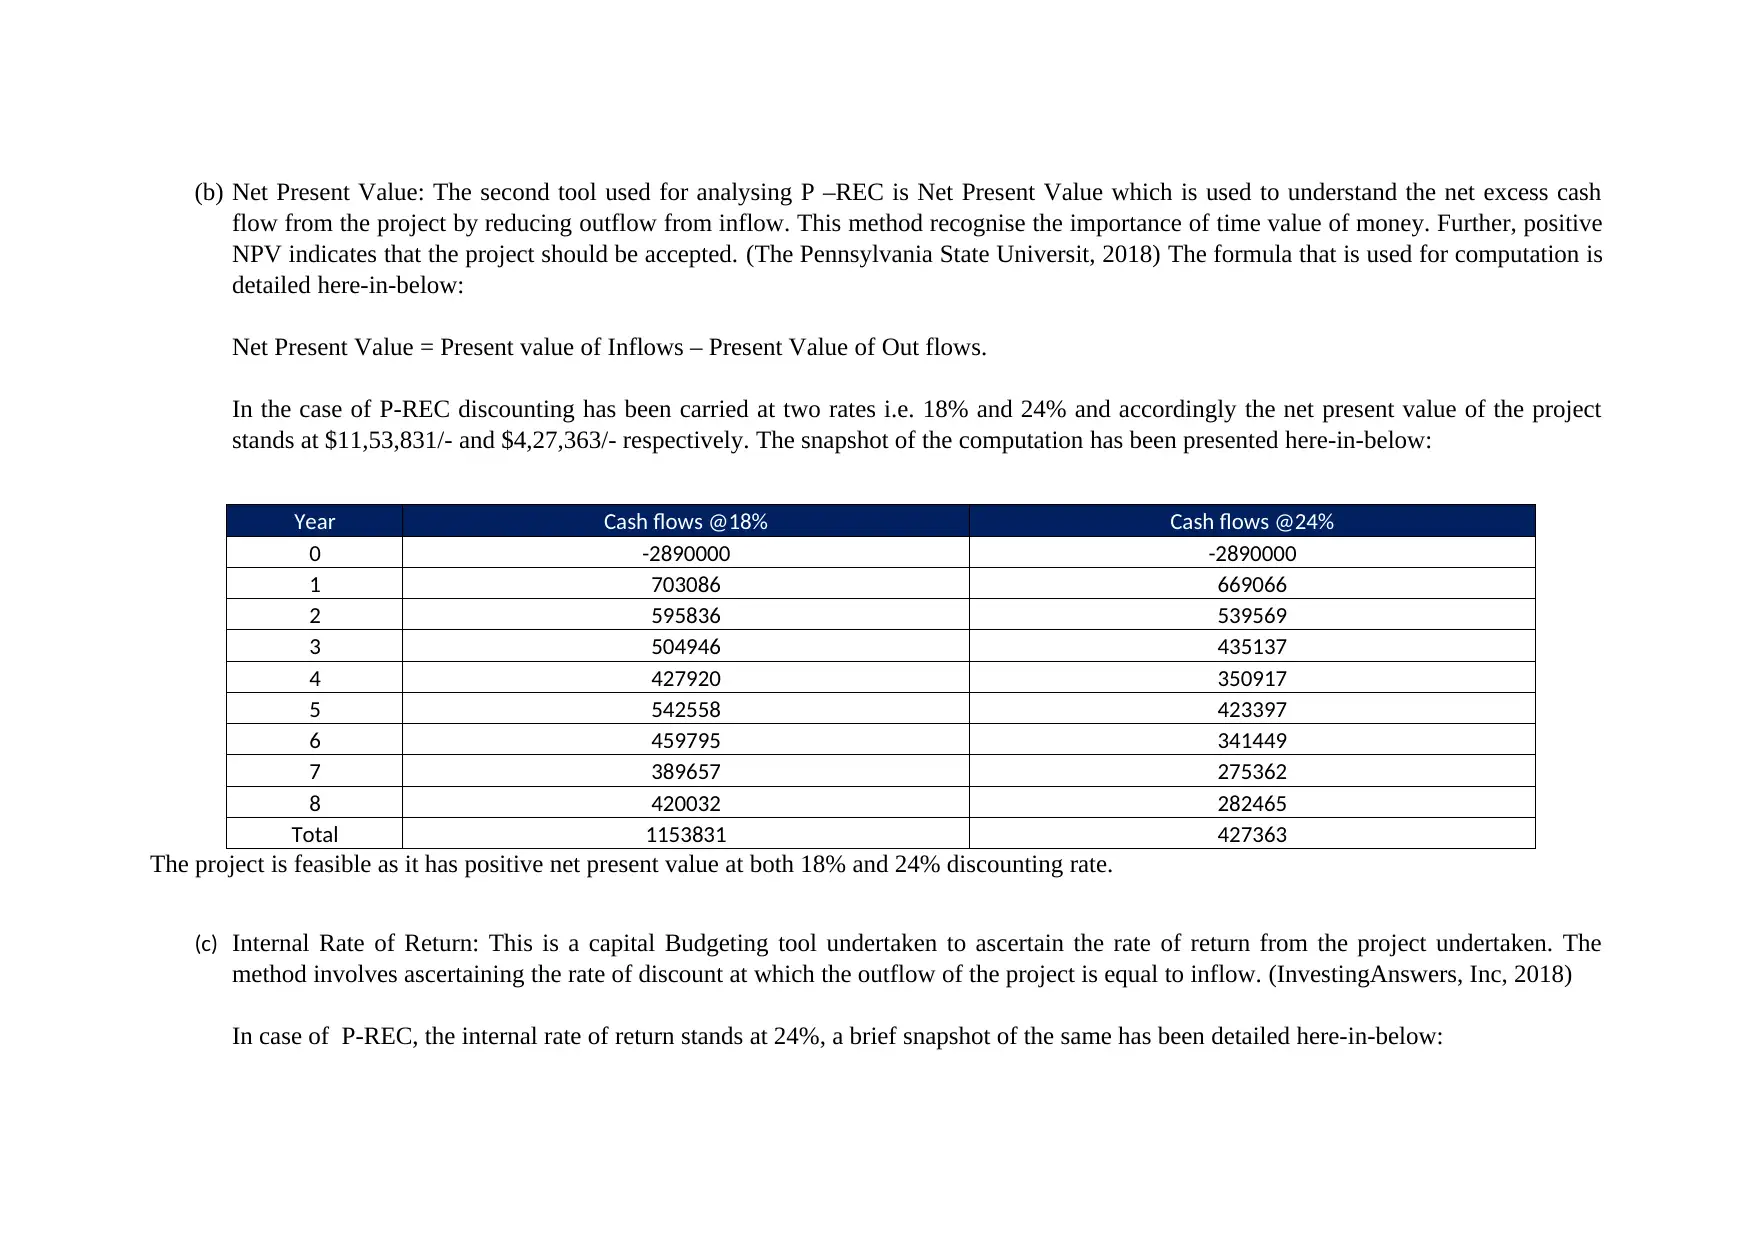
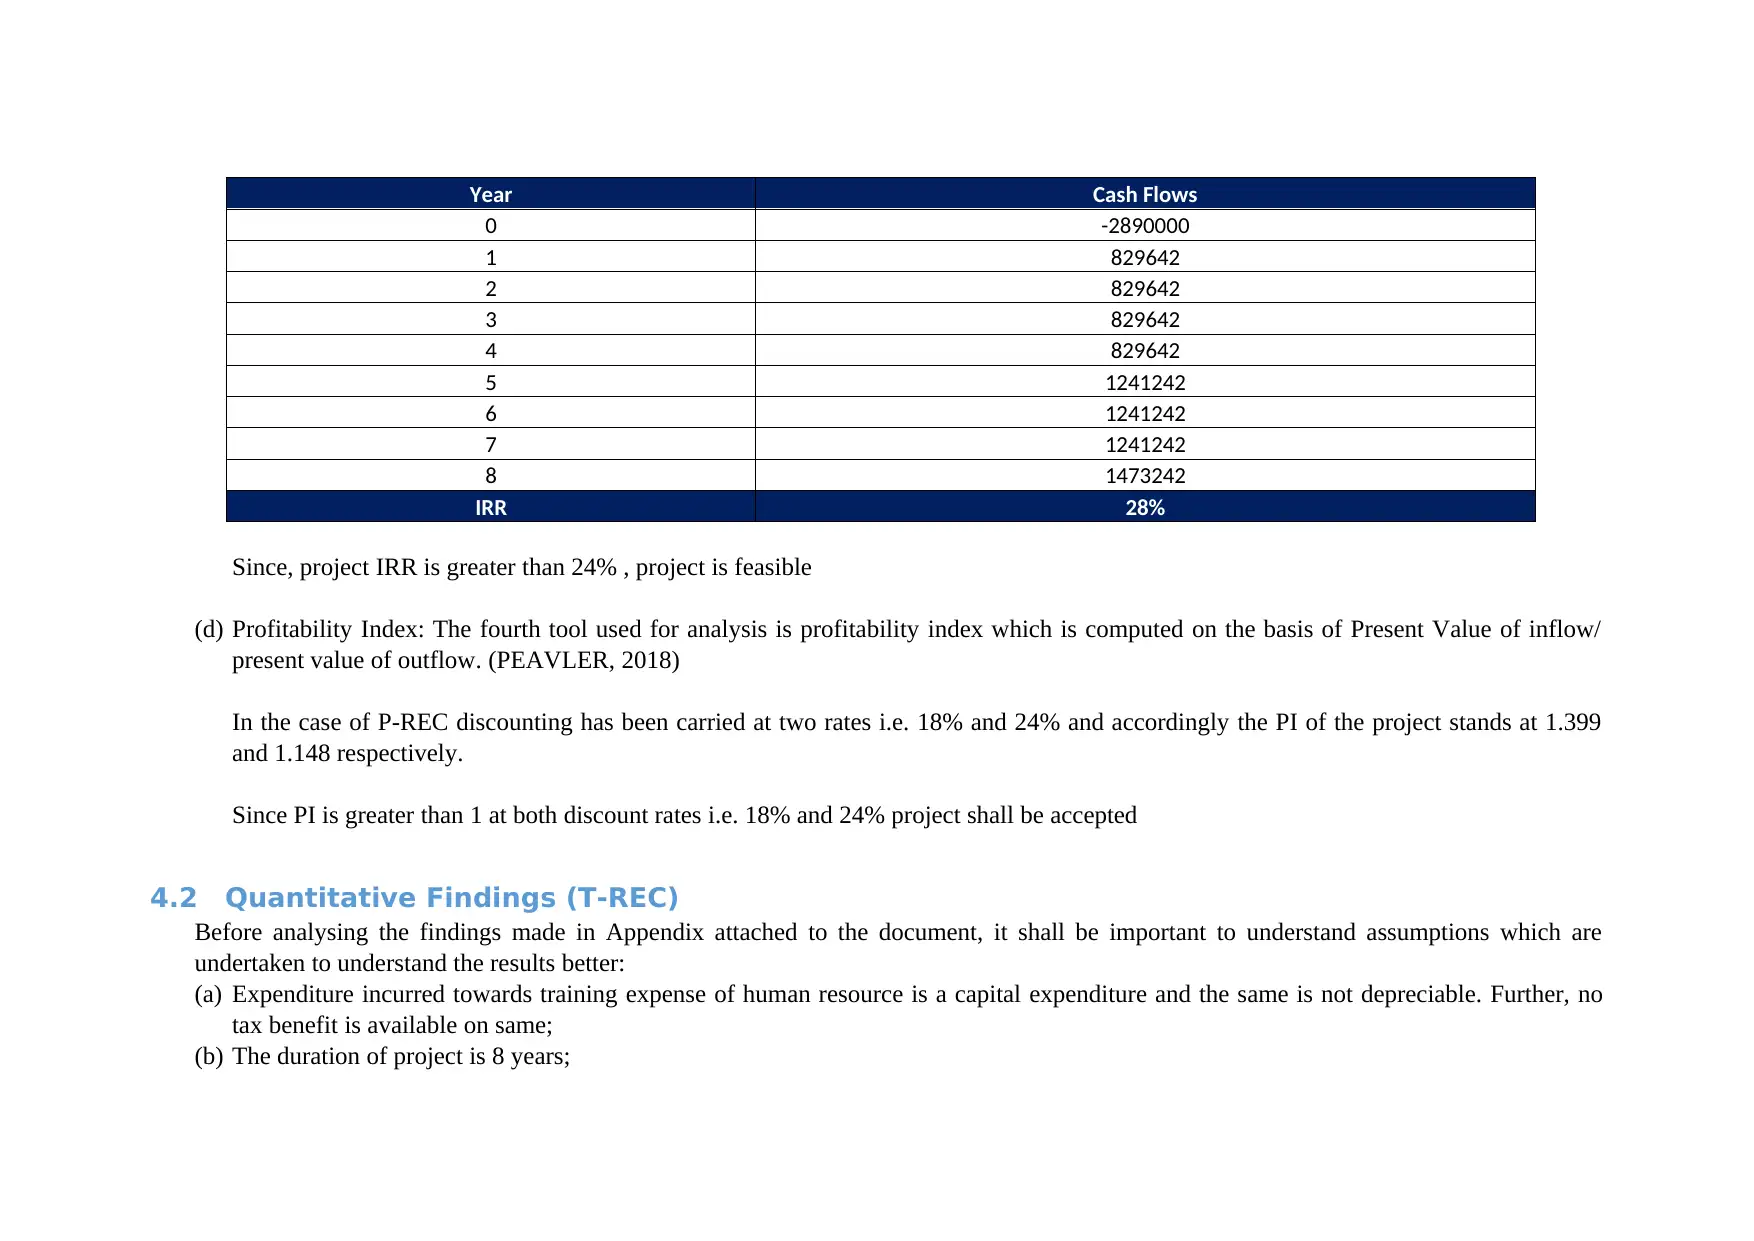
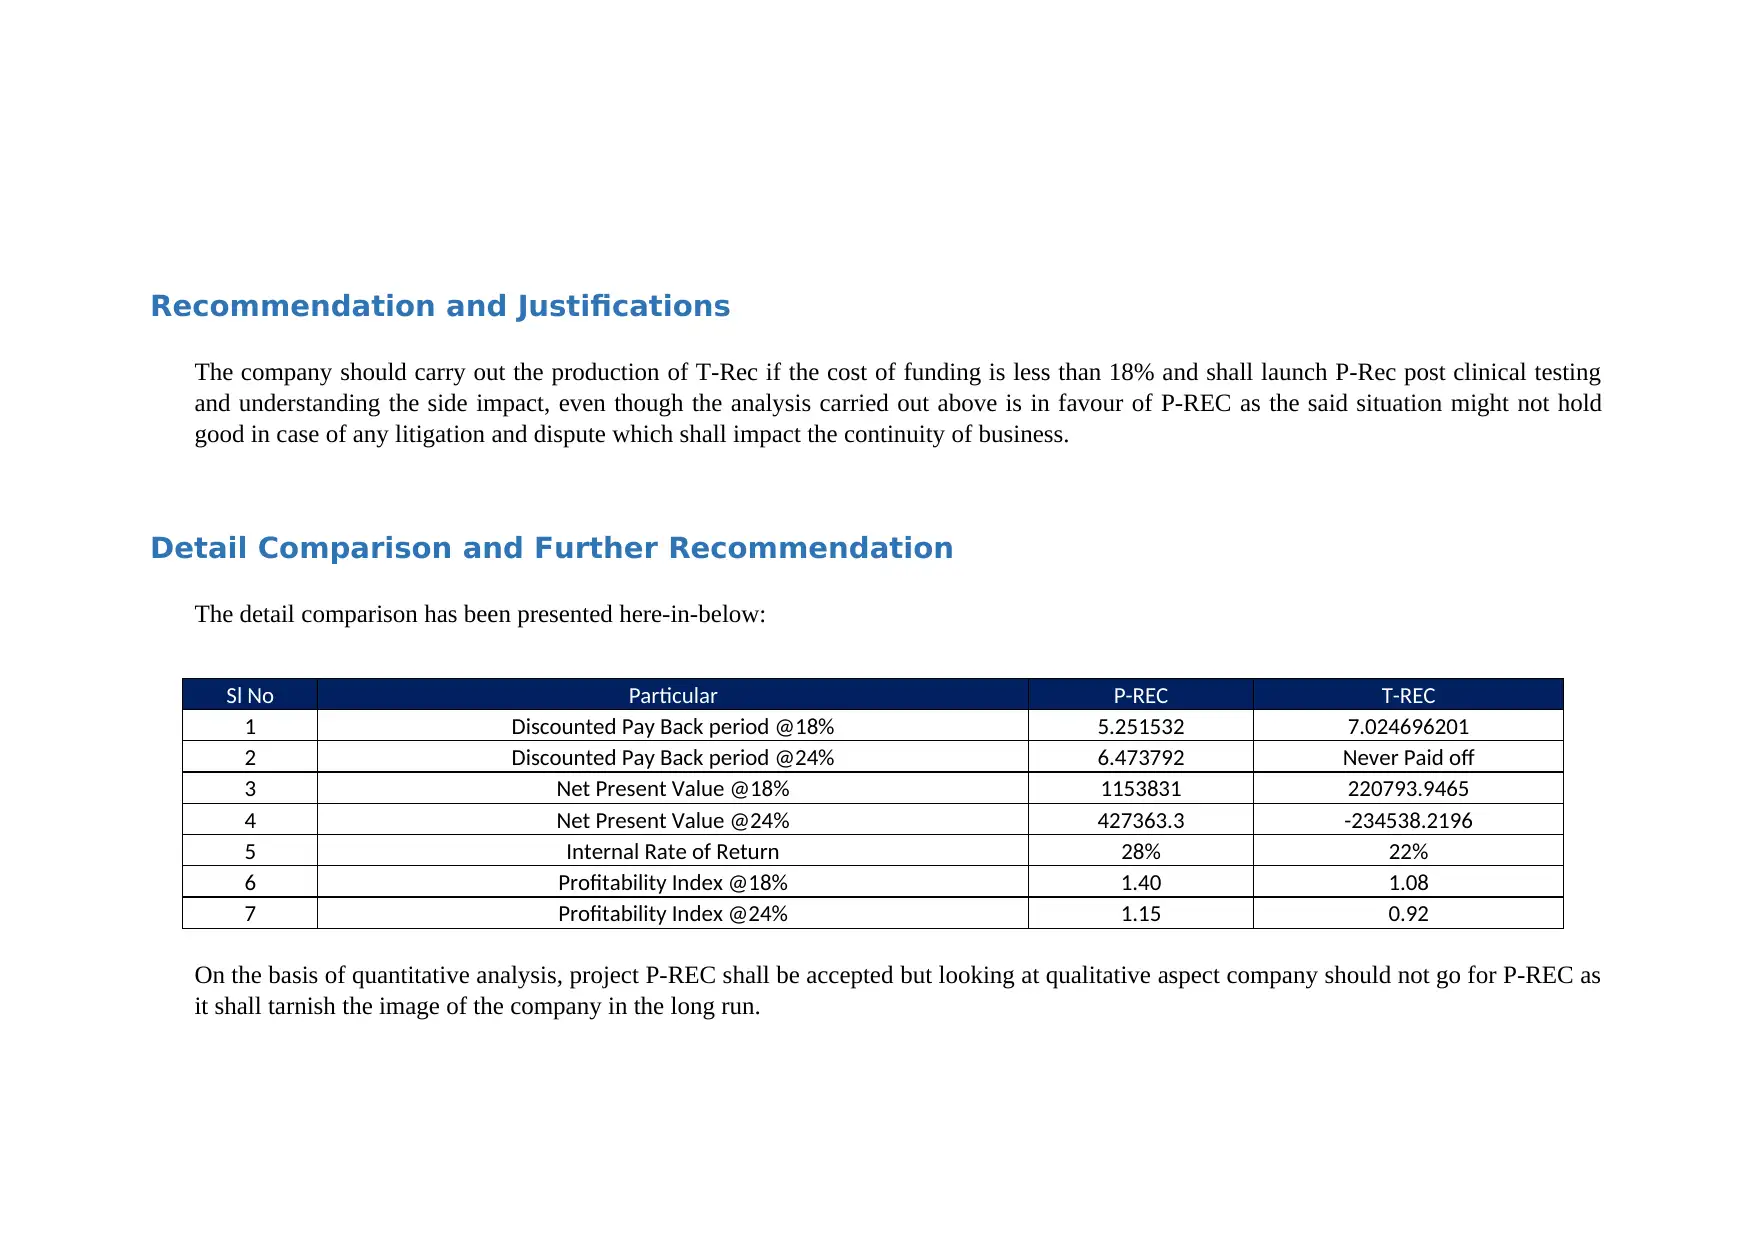
This report provides a detailed analysis of two investment proposals, T-REC and P-REC, for ALLCURE INC. The evaluation encompasses both quantitative and qualitative aspects, utilizing parameters such as Net Present Value (NPV), Profitability Index (PI), Internal Rate of Return (IRR), and Discounted Payback Period. Quantitative findings are presented for both projects under different discount rates (18% and 24%), revealing that both projects are feasible at an 18% discount rate. However, T-REC is deemed not feasible at 24%. The report includes assumptions, detailed computations, and a comparison of the projects based on financial metrics and qualitative factors like risk, potential litigation, and competitor actions. The report concludes with a recommendation to proceed with T-REC, given its clinical safety and lower risk profile, while suggesting further testing for P-REC before launch. The report also includes financial analysis and recommendations. References are also provided.

PROJECT EVALUATION FOR ALLCURE INC.
Paraphrase This Document
Need a fresh take? Get an instant paraphrase of this document with our AI Paraphraser

Executive Summary
The report outlines two investment proposal i.e T-REC and P-REC and the feasibility
study on the basis of various parameters. In this regard, an in-depth analysis has been
conducted in the report to understand both qualitative and quantitative aspect of the
project.
The parameter that have been analysed in the report includes:
(a) Net Present Value;
(b) Profitability Index;
(c) Internal Rate of Return;
(d) Discounted Payback Period
On the basis of above results and considering qualitative aspect of the project final
conclusion has been reached i.e. both projects are feasible when discounted @ 18%.
However, Project T-REC is not feasible @24%. The detailed report has been
presented here-in-below.

TABLE OF CONTENT
Executive Summary...............................................................2
Introduction..........................................................................4
Findings.................................................................................4
4.1 Quantitative Findings (P-REC).....................................4
4.2 Quantitative Findings (T-REC)......................................8
4.3 Qualitative Findings...................................................10
Recommendation and Justifications...................................11
Detail Comparison and Further Recommendation.............11
Conclusion...........................................................................11
⊘ This is a preview!⊘
Do you want full access?
Subscribe today to unlock all pages.

Trusted by 1+ million students worldwide

Introduction
The report deals with detailed analysis of the two projects that have been proposed to
be undertaken by the company i.e. T-REC and P-REC on various parameters. The
project has been conducted to understand whether to undertake the project, if yes,
which project should be undertaken and then evaluation of such project on the
qualitative parameters.
Findings
4.1 Quantitative Findings (P-REC)
Before analysing the findings made in Appendix attached to the document, it shall be
important to understand assumptions which are undertaken to understand the results
better:
(a) Expenditure incurred towards training expense of human resource is a capital
expenditure and the same is not depreciable. Further, no tax benefit is available on
same;
(b) The duration of project is 8 years;
(c) Renovation cost is depreciable and has been depreciated over 8 years
(d) The asset has been sold at the end of 8 years;
(e) Loss on sale and corresponding tax benefit on the same has been considered for
analysis purpose;
(f) Working capital has been realised at the end of the project;
(g) R&D expenditure has been considered as sunk cost and not tax deductible.
On the basis of analysis have been conducted based on 4 parameters, the information n
the same has been detailed here-in-below:
(a) Discounted Payback period: Under the said tool of capital budgeting, the period
under which the initial cash outflow shall be realised is taken into consideration.
Further, the method pay importance to time value of money and discounting to
cash flows realised over the period is carried to ascertain the present value of the
cash flows.
In the case of P-REC, cash flows have been discounted at 18% and 24% to
understand the discounted payback period of the project. Accordingly, the
discounted payback period of the project stands at 5.25 years and 6.43 years
respectively which is greater than 5 years. Further, a brief snapshot of the
computation is provided here-in-below:
Paraphrase This Document
Need a fresh take? Get an instant paraphrase of this document with our AI Paraphraser

Sl
NO Particulars Year 0 Year 1 Year 2 Year 3 Year 4 Year 5 Year 6 Year 7 Year 8
Terminal
Value
1
Operating Cash flow
before Tax -2890000 748060 748060 748060 748060 1336060 1336060 1336060 1336060 310000
2 Tax -224418 -224418 -224418 -224418 -400818 -400818 -400818 -400818 27600
3 Depreciation 306000 306000 306000 306000 306000 306000 306000 306000
4 Net Operating Cash flow -2890000 829642 829642 829642 829642 1241242 1241242 1241242 1241242 337600
5 Discounting Factor @18% 1
0.84745
8
0.71818
4
0.60863
1 0.515789
0.43710
9 0.370432 0.313925 0.266038
0.266038
164
6 Discounted Cash Flow -2890000
703086.
4 595836
504945.
7 427920.1
542558.
3 459795.2 389656.9 330217.7
89814.48
408
7 Net Present Value 1153831
8 Cumulative -2890000
-
218691
4
-
159107
8
-
108613
2 -658212 -115653 344141.8 733798.7 1064016
1153830.
921
9
Discounted Pay back
period 5.251532
10 Discounting Factor @24% 1
0.80645
2
0.65036
4
0.52448
7 0.422974
0.34110
8 0.275087 0.221844 0.178907
0.178906
664
11 Cumulative -2890000
-
222093
4
-
168136
4
-
124622
8 -895311 -471914 -130464 144898 366964.4
427363.3
353
12
Discounted Pay back
period 6.473792
The project is not feasible based on the requirement of the organisation to have discounted payback period less than 5 yeats.

⊘ This is a preview!⊘
Do you want full access?
Subscribe today to unlock all pages.

Trusted by 1+ million students worldwide

(b) Net Present Value: The second tool used for analysing P –REC is Net Present Value which is used to understand the net excess cash
flow from the project by reducing outflow from inflow. This method recognise the importance of time value of money. Further, positive
NPV indicates that the project should be accepted. (The Pennsylvania State Universit, 2018) The formula that is used for computation is
detailed here-in-below:
Net Present Value = Present value of Inflows – Present Value of Out flows.
In the case of P-REC discounting has been carried at two rates i.e. 18% and 24% and accordingly the net present value of the project
stands at $11,53,831/- and $4,27,363/- respectively. The snapshot of the computation has been presented here-in-below:
Year Cash flows @18% Cash flows @24%
0 -2890000 -2890000
1 703086 669066
2 595836 539569
3 504946 435137
4 427920 350917
5 542558 423397
6 459795 341449
7 389657 275362
8 420032 282465
Total 1153831 427363
The project is feasible as it has positive net present value at both 18% and 24% discounting rate.
(c) Internal Rate of Return: This is a capital Budgeting tool undertaken to ascertain the rate of return from the project undertaken. The
method involves ascertaining the rate of discount at which the outflow of the project is equal to inflow. (InvestingAnswers, Inc, 2018)
In case of P-REC, the internal rate of return stands at 24%, a brief snapshot of the same has been detailed here-in-below:
Paraphrase This Document
Need a fresh take? Get an instant paraphrase of this document with our AI Paraphraser

Year Cash Flows
0 -2890000
1 829642
2 829642
3 829642
4 829642
5 1241242
6 1241242
7 1241242
8 1473242
IRR 28%
Since, project IRR is greater than 24% , project is feasible
(d) Profitability Index: The fourth tool used for analysis is profitability index which is computed on the basis of Present Value of inflow/
present value of outflow. (PEAVLER, 2018)
In the case of P-REC discounting has been carried at two rates i.e. 18% and 24% and accordingly the PI of the project stands at 1.399
and 1.148 respectively.
Since PI is greater than 1 at both discount rates i.e. 18% and 24% project shall be accepted
4.2 Quantitative Findings (T-REC)
Before analysing the findings made in Appendix attached to the document, it shall be important to understand assumptions which are
undertaken to understand the results better:
(a) Expenditure incurred towards training expense of human resource is a capital expenditure and the same is not depreciable. Further, no
tax benefit is available on same;
(b) The duration of project is 8 years;

(c) Renovation cost is depreciable and has been depreciated over 8 years
(d) The asset has been sold at the end of 8 years;
(e) Loss on sale and corresponding tax benefit on the same has been considered for analysis purpose;
(f) Working capital has been realised at the end of the project;
(g) No other cost has been considered for analysis;
(h) R&D expenditure has been considered as sunk cost and not tax deductible.
On the basis of analysis have been conducted based on 4 parameters, the information n the same has been detailed here-in-below:
(a) Discounted Payback Period:
In the case of T-REC, cash flows have been discounted at 18% and 24% to understand the discounted payback period of the project.
Accordingly, the discounted payback period of the project stands at 7.024 years and unrealisable respectively which is greater than 5
years. (Payback Period & Discounted Payback Period | Formula | Example, 2018)
The project is not feasible at 24% discounting rate.
(b) Net Present Value:
⊘ This is a preview!⊘
Do you want full access?
Subscribe today to unlock all pages.

Trusted by 1+ million students worldwide

In the case of T-REC discounting has been carried at two rates i.e. 18% and 24% and accordingly the net present value of the project
stands at $2,20,794/- and -$2,34,538/- respectively.
The project is not feasible at 24% discounting rate.
(c) Internal Rate of return of the project is 22% for T-REC.
(d) Profitability Index
In the case of T-REC discounting has been carried at two rates i.e. 18% and 24% and accordingly the PI of the project stands at 1.076
and .9188 respectively.
The project is not feasible at 24% discounting rate.
4.3 Qualitative Findings
The qualitative factors that must be taken into consideration for analysing the project has been detailed here-in-below:
(a) The project proposed to be undertaken i.e P-REC is risky as the same might cause long term hazard to the company on account of
not being fully clinically tested. The impact of the same may adversely impact the cash flows stated above;
(b) There might be litigation and dispute on account of undertaking the project and the same shall hamper the future prospect of the
company;
(c) Since the Pharmaceutical Sector is prone to litigation and bans risk of such kind may in the long result in closure of the company;
(d) Further, one should consider the competitor action and the response of them and the above computation might not hold true if any
competitor launches similar product with better results;
(e) For T-REC, it is clinically safe and tested but the same is not feasible @24% discounting rate. However, it is less prone to litigation
and the above result shall hold good unless any drastic change take place in economy or on account of any major innovation;
Paraphrase This Document
Need a fresh take? Get an instant paraphrase of this document with our AI Paraphraser

Recommendation and Justifications
The company should carry out the production of T-Rec if the cost of funding is less than 18% and shall launch P-Rec post clinical testing
and understanding the side impact, even though the analysis carried out above is in favour of P-REC as the said situation might not hold
good in case of any litigation and dispute which shall impact the continuity of business.
Detail Comparison and Further Recommendation
The detail comparison has been presented here-in-below:
Sl No Particular P-REC T-REC
1 Discounted Pay Back period @18% 5.251532 7.024696201
2 Discounted Pay Back period @24% 6.473792 Never Paid off
3 Net Present Value @18% 1153831 220793.9465
4 Net Present Value @24% 427363.3 -234538.2196
5 Internal Rate of Return 28% 22%
6 Profitability Index @18% 1.40 1.08
7 Profitability Index @24% 1.15 0.92
On the basis of quantitative analysis, project P-REC shall be accepted but looking at qualitative aspect company should not go for P-REC as
it shall tarnish the image of the company in the long run.

Conclusion
On the basis of above analysis, T-REC shall be accepted further it shall be pertinent to note that P-REC is not clinically proven and same
shall be tested to be launch on a future date and the company should proceed with T-REC.
References:
InvestingAnswers, Inc. (2018). Internal Rate of Return (IRR). Retrieved October 1, 2018, from investinganswers.com: https://investinganswers.com/financial-
dictionary/investing/internal-rate-return-irr-2130
Payback Period & Discounted Payback Period | Formula | Example. (2018). Retrieved October 1, 2018, from www.wallstreetmojo.com:
https://www.wallstreetmojo.com/payback-period-discounted-payback-period/
PEAVLER, R. (2018, july 23). The Profitability Index. Retrieved October 1, 2018, from www.thebalancesmb.com: https://www.thebalancesmb.com/the-
profitability-index-392917
The Pennsylvania State Universit. (2018). Net Present Value, Benefit Cost Ratio, and Present Value Ratio for project assessment. Retrieved October 1, 2018,
from www.e-education.psu.edu: https://www.e-education.psu.edu/eme460/node/608
Appendix-1
⊘ This is a preview!⊘
Do you want full access?
Subscribe today to unlock all pages.

Trusted by 1+ million students worldwide
1 out of 21
Related Documents

Your All-in-One AI-Powered Toolkit for Academic Success.
 +13062052269
info@desklib.com
Available 24*7 on WhatsApp / Email
Unlock your academic potential
Copyright © 2020–2025 A2Z Services. All Rights Reserved. Developed and managed by ZUCOL.