Comparative Financial Analysis: Alpha Ltd and Beta Ltd Investment
VerifiedAdded on  2022/12/29
|15
|1713
|59
Report
AI Summary
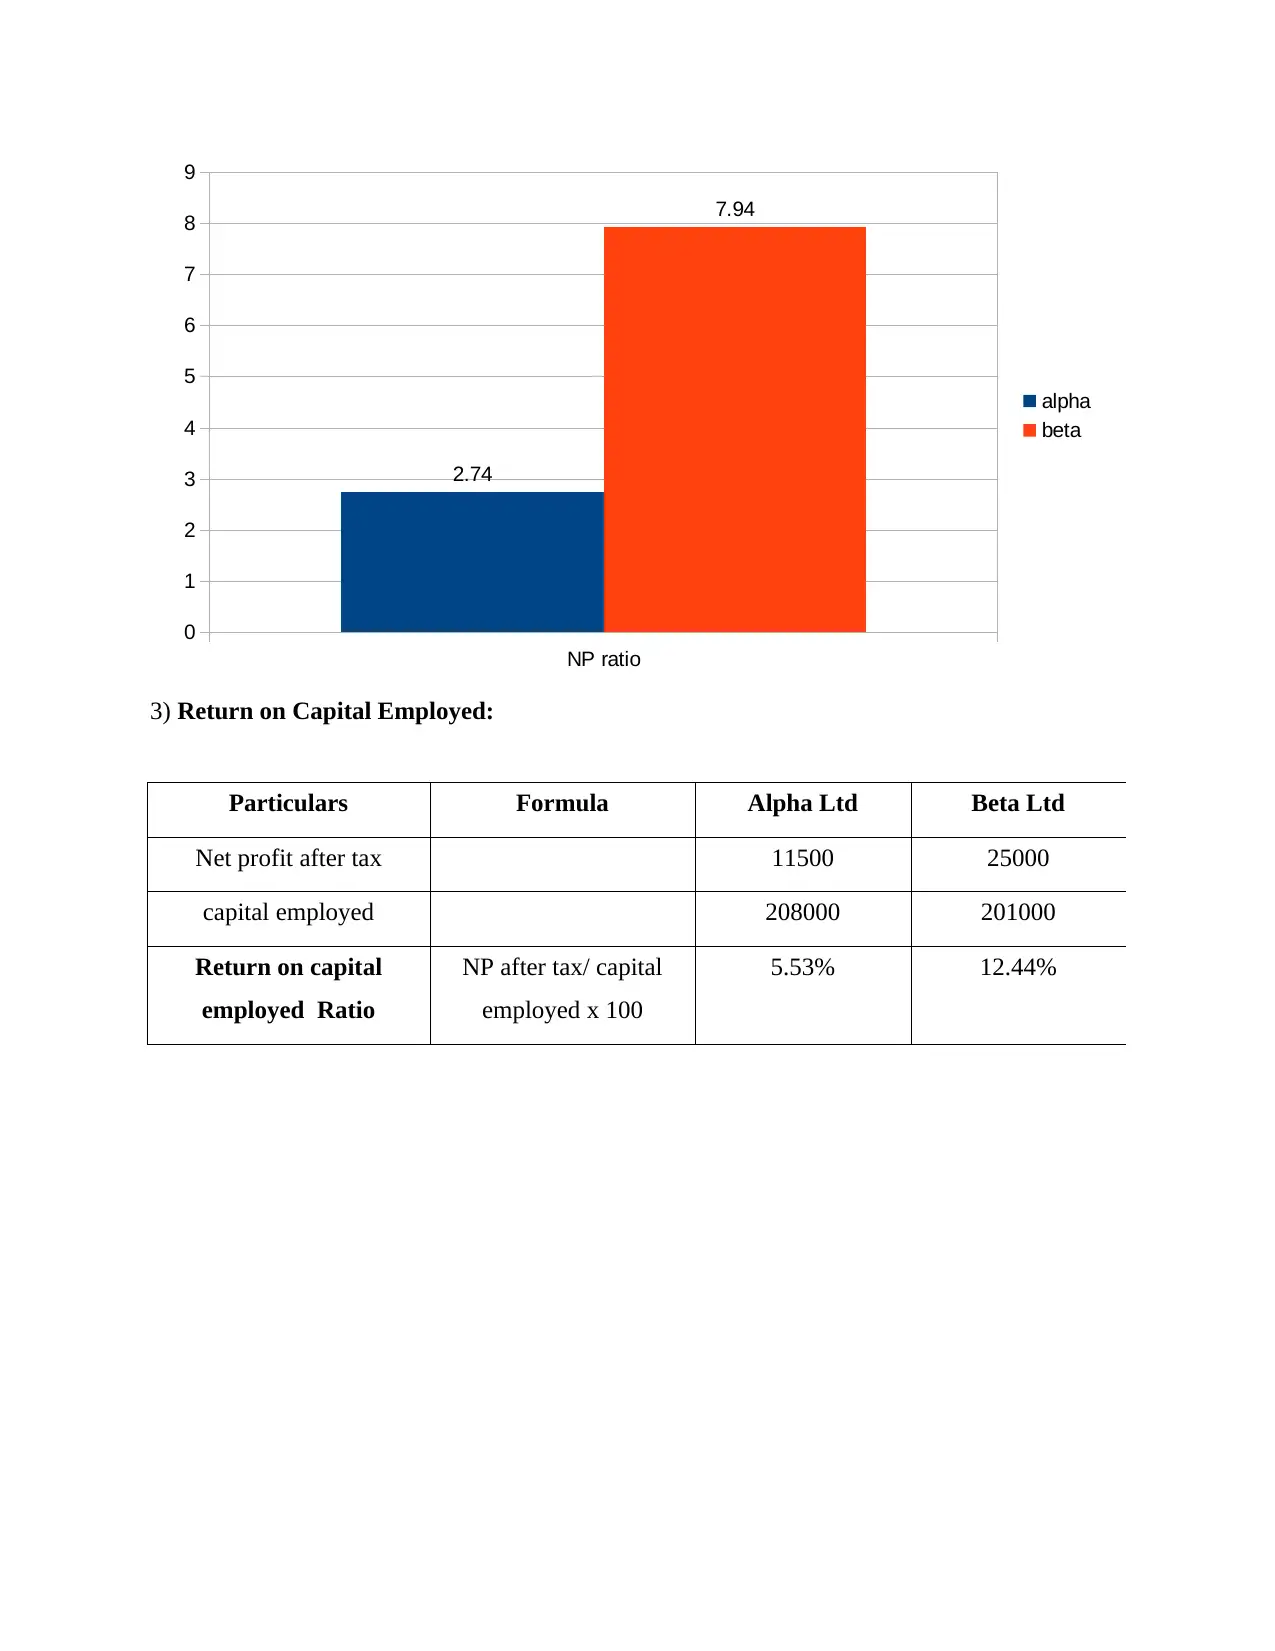
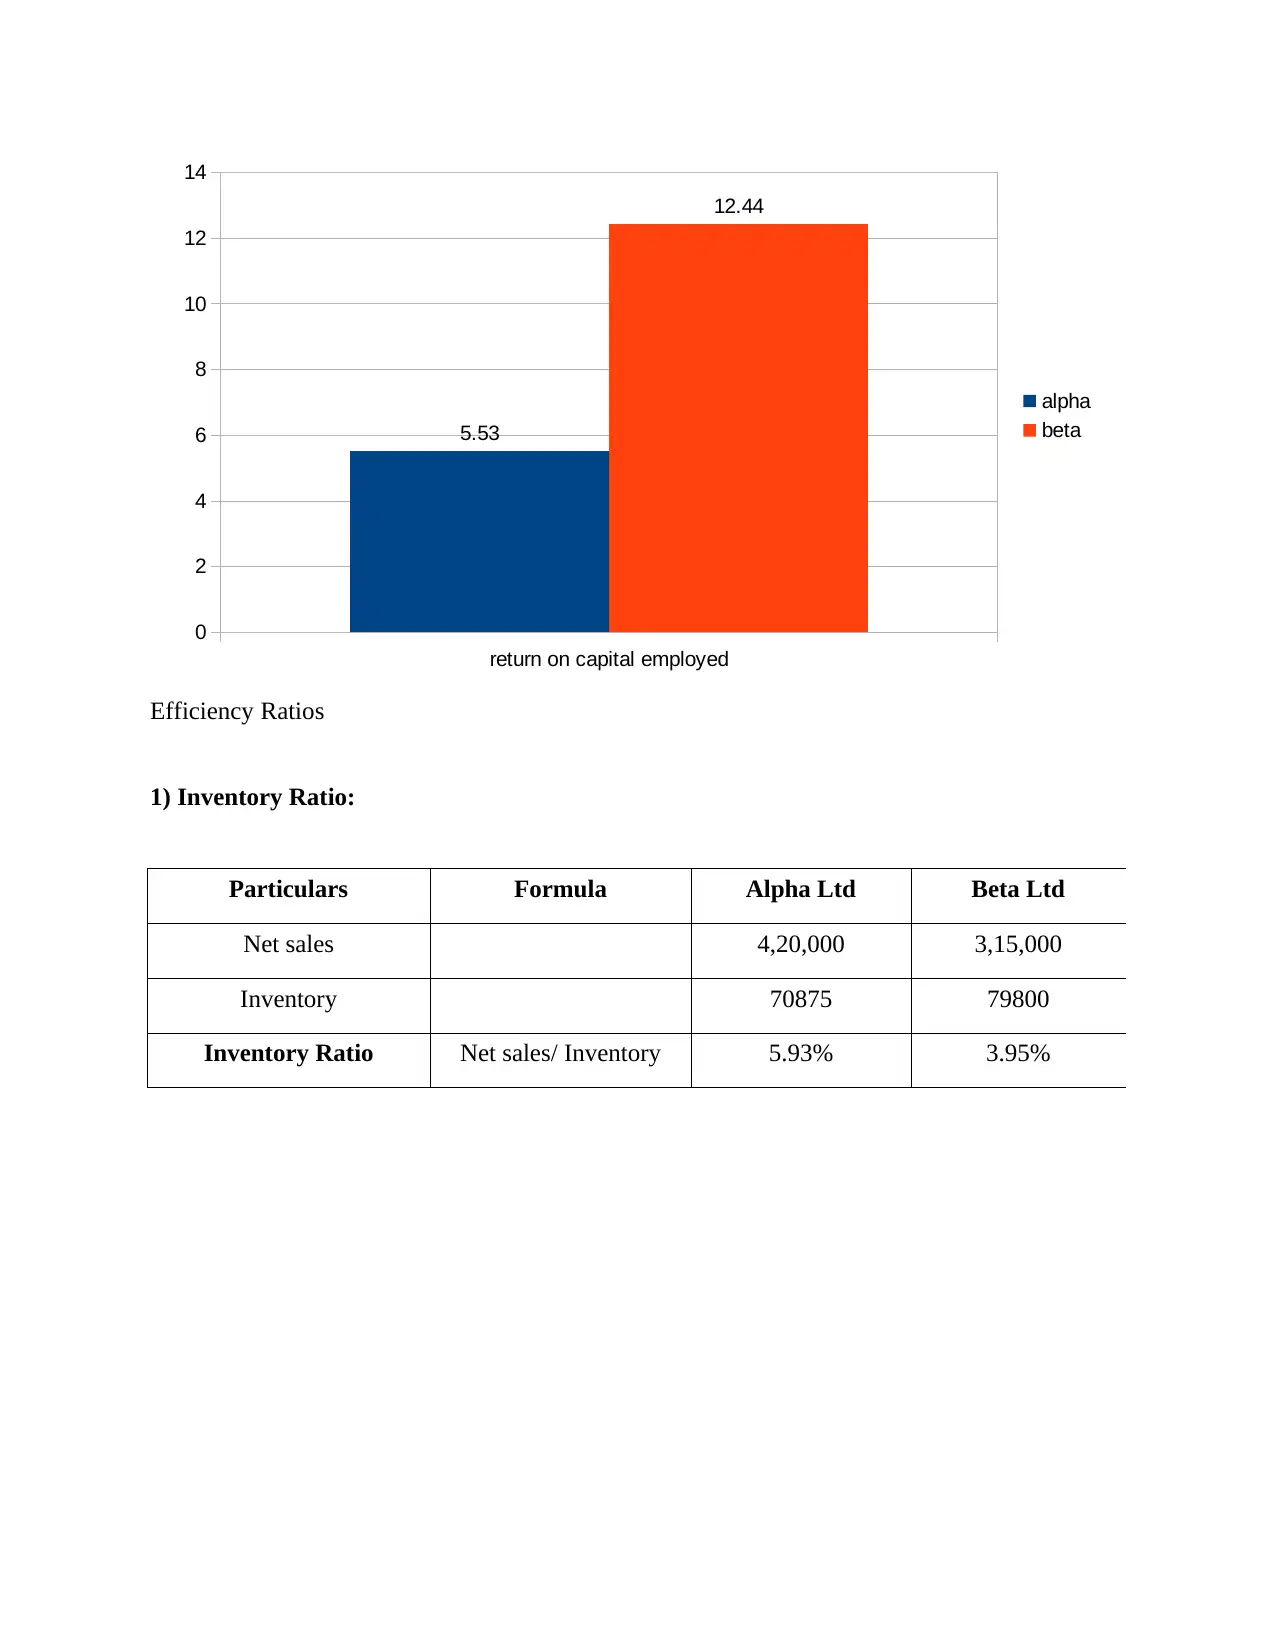
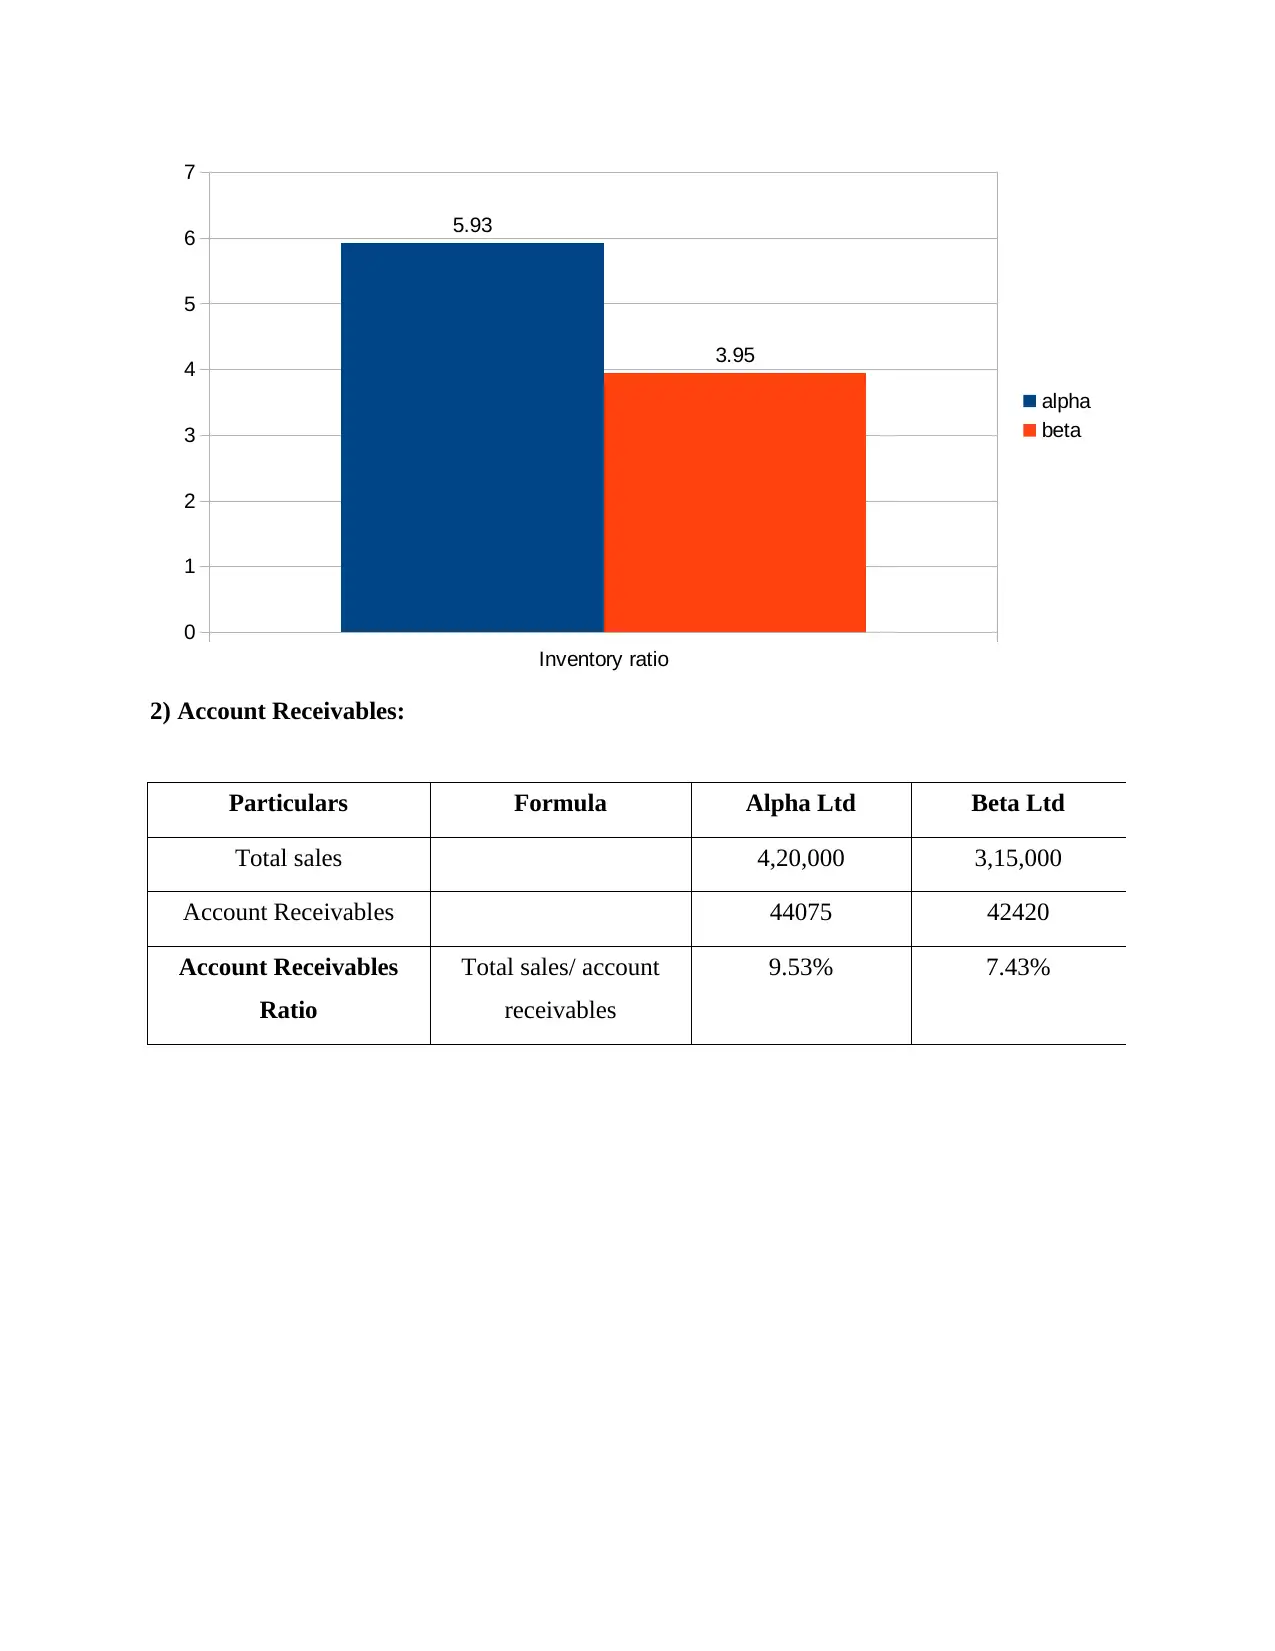
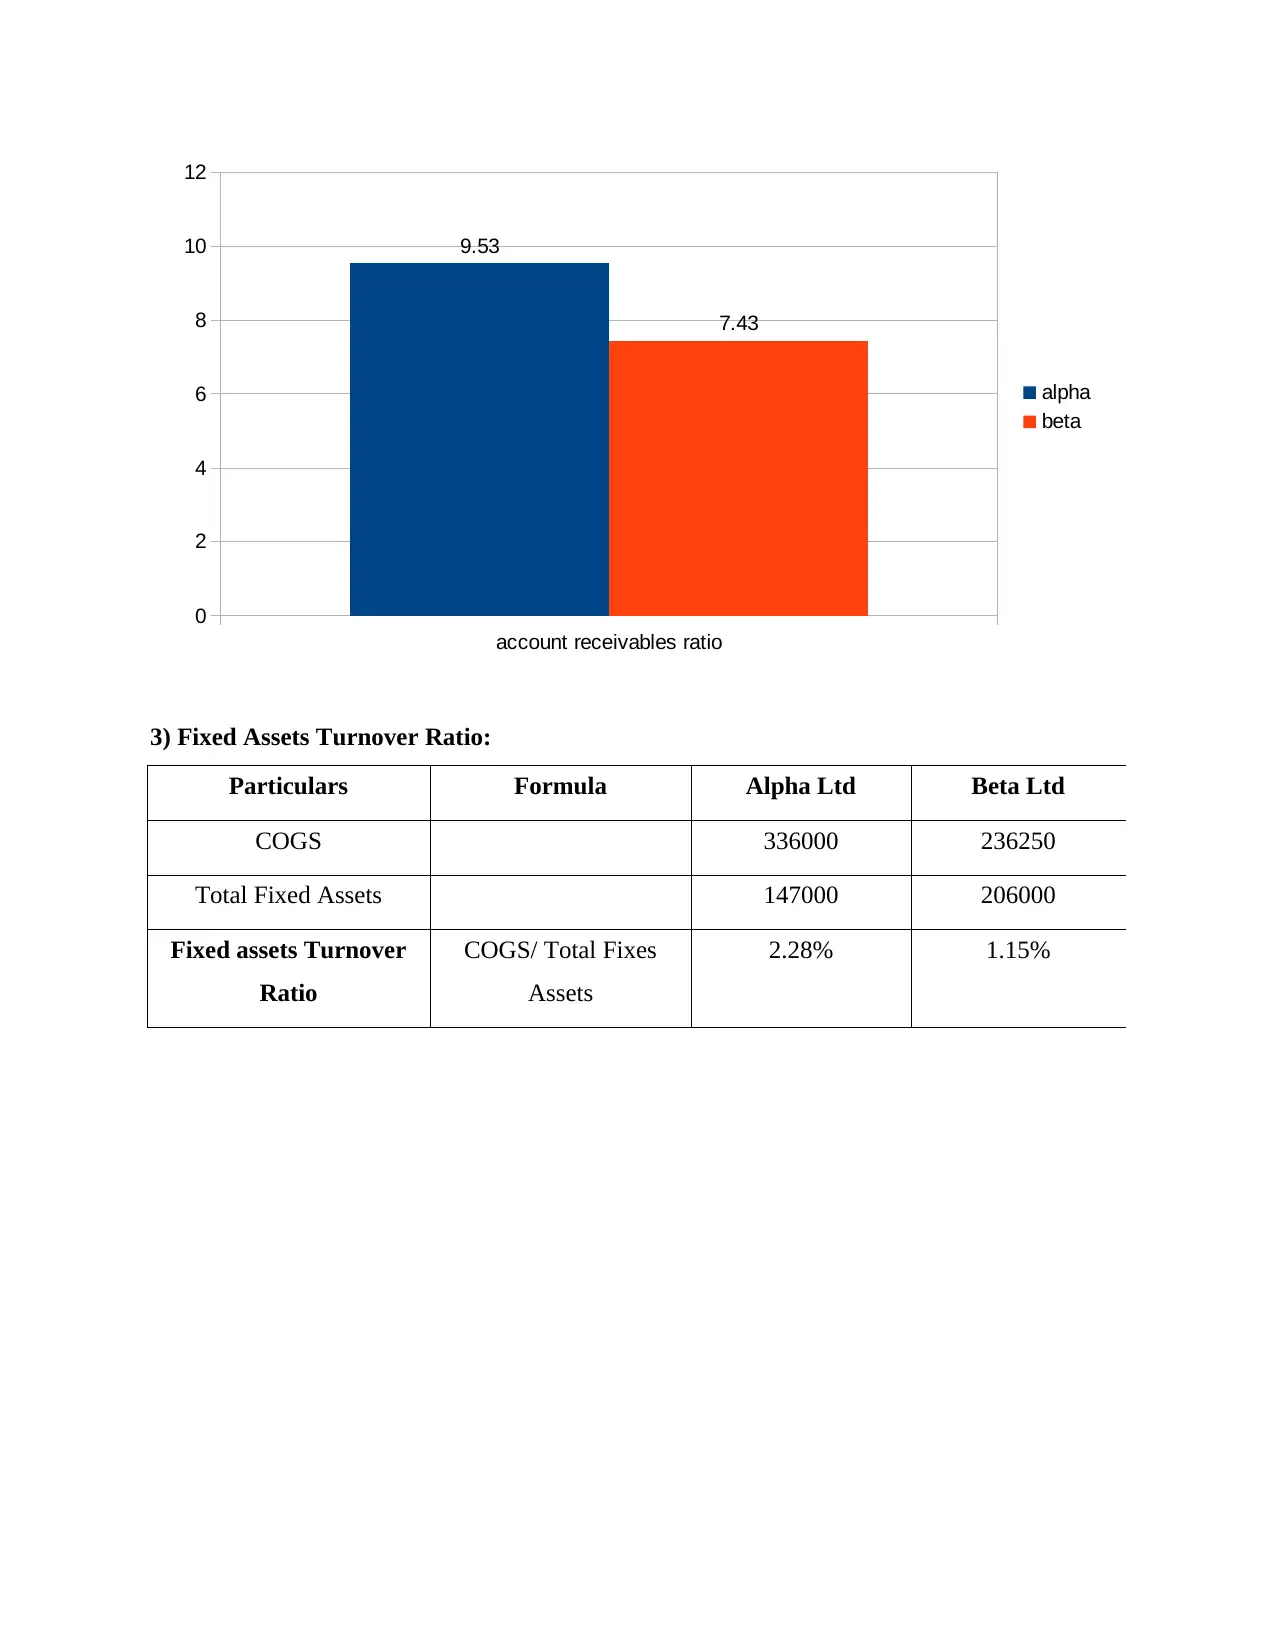
This report presents a comprehensive financial analysis comparing Alpha Ltd and Beta Ltd, utilizing various financial ratios to evaluate their performance and investment suitability. The analysis includes the calculation and interpretation of liquidity, profitability, efficiency, and solvency ratios for both companies. The current ratio, quick ratio, gross profit ratio, net profit ratio, return on capital employed, inventory ratio, account receivables ratio, fixed assets turnover ratio, debt-equity ratio, and proprietary ratio are all calculated and interpreted. The report concludes that Alpha Ltd is the more suitable company for potential investment based on its stronger financial position, particularly its higher current ratio, quick ratio, and efficiency in utilizing fixed assets. The findings highlight Alpha Ltd's better performance in managing its current obligations, generating profits, and utilizing its assets effectively, making it a more attractive investment option compared to Beta Ltd.

ACCOUNTING AND
FINANCE FOR MANAGER
FINANCE FOR MANAGER
Paraphrase This Document
Need a fresh take? Get an instant paraphrase of this document with our AI Paraphraser

Table of Contents
INTRODUCTION...........................................................................................................................3
MAIN BODY...................................................................................................................................3
(A) Calculation of ratios.............................................................................................................3
..........................................................................................................................................................4
(B) Interpretations of Ratio.......................................................................................................11
(C) the suitability for potential investment in one of the company...........................................13
CONCLUSION..............................................................................................................................13
REFERENCES..............................................................................................................................14

INTRODUCTION
In the present era every firm wants to know its overall financial performance to show its
investors that how much they earn or efficiently manage the liquidity. Ratio analysis helps the
company to analyse liquidity, operational efficiency, and profitability of the firm by comparing
two years financial performance. In this current report the suitability for potential investment in
one company will be highlighted. The present study will identify that which firm is most
appropriate for investment with the help of ratio analysis.
MAIN BODY
(A) Calculation of ratios
Liquidity ratios
1) Current Ratio:
Particulars Formula Alpha Ltd Beta Ltd
Current assets 114950 122220
Current liability 53950 127220
Current ratio Current asset/current
liability
2.13 0.96
Current ratio
0
0.5
1
1.5
2
2.5
2.13
0.96
alpha
beta
2) Quick ratio:
⊘ This is a preview!⊘
Do you want full access?
Subscribe today to unlock all pages.

Trusted by 1+ million students worldwide

Particulars Formula Alpha Ltd Beta Ltd
quick assets 44075 42420
Current liability 53950 127220
Quick ratio Quick asset/current
liability
0.82 0.33
Quick ratio
0
0.1
0.2
0.3
0.4
0.5
0.6
0.7
0.8
0.9 0.82
0.33
alpha
beta
Profitability Ratios
1) Gross Profit Ratio:
Particulars Formula Alpha Ltd Beta Ltd
Gross profit 84000 78750
Net sales 4,20,000 3,15,000
GP Ratio GP/Net sales x 100 20.00% 25.00%
Paraphrase This Document
Need a fresh take? Get an instant paraphrase of this document with our AI Paraphraser

GP ratio
0
5
10
15
20
25
30
20
25
alpha
beta
2) Net Profit Ratio
Particulars Formula Alpha Ltd Beta Ltd
Net profit 11500 25000
Net sales 4,20,000 3,15,000
NP Ratio NP/Net sales x 100 2.74% 7.94%
0
5
10
15
20
25
30
20
25
alpha
beta
2) Net Profit Ratio
Particulars Formula Alpha Ltd Beta Ltd
Net profit 11500 25000
Net sales 4,20,000 3,15,000
NP Ratio NP/Net sales x 100 2.74% 7.94%

NP ratio
0
1
2
3
4
5
6
7
8
9
2.74
7.94
alpha
beta
3) Return on Capital Employed:
Particulars Formula Alpha Ltd Beta Ltd
Net profit after tax 11500 25000
capital employed 208000 201000
Return on capital
employed Ratio
NP after tax/ capital
employed x 100
5.53% 12.44%
0
1
2
3
4
5
6
7
8
9
2.74
7.94
alpha
beta
3) Return on Capital Employed:
Particulars Formula Alpha Ltd Beta Ltd
Net profit after tax 11500 25000
capital employed 208000 201000
Return on capital
employed Ratio
NP after tax/ capital
employed x 100
5.53% 12.44%
⊘ This is a preview!⊘
Do you want full access?
Subscribe today to unlock all pages.

Trusted by 1+ million students worldwide

return on capital employed
0
2
4
6
8
10
12
14
5.53
12.44
alpha
beta
Efficiency Ratios
1) Inventory Ratio:
Particulars Formula Alpha Ltd Beta Ltd
Net sales 4,20,000 3,15,000
Inventory 70875 79800
Inventory Ratio Net sales/ Inventory 5.93% 3.95%
0
2
4
6
8
10
12
14
5.53
12.44
alpha
beta
Efficiency Ratios
1) Inventory Ratio:
Particulars Formula Alpha Ltd Beta Ltd
Net sales 4,20,000 3,15,000
Inventory 70875 79800
Inventory Ratio Net sales/ Inventory 5.93% 3.95%
Paraphrase This Document
Need a fresh take? Get an instant paraphrase of this document with our AI Paraphraser

Inventory ratio
0
1
2
3
4
5
6
7
5.93
3.95
alpha
beta
2) Account Receivables:
Particulars Formula Alpha Ltd Beta Ltd
Total sales 4,20,000 3,15,000
Account Receivables 44075 42420
Account Receivables
Ratio
Total sales/ account
receivables
9.53% 7.43%
0
1
2
3
4
5
6
7
5.93
3.95
alpha
beta
2) Account Receivables:
Particulars Formula Alpha Ltd Beta Ltd
Total sales 4,20,000 3,15,000
Account Receivables 44075 42420
Account Receivables
Ratio
Total sales/ account
receivables
9.53% 7.43%

account receivables ratio
0
2
4
6
8
10
12
9.53
7.43
alpha
beta
3) Fixed Assets Turnover Ratio:
Particulars Formula Alpha Ltd Beta Ltd
COGS 336000 236250
Total Fixed Assets 147000 206000
Fixed assets Turnover
Ratio
COGS/ Total Fixes
Assets
2.28% 1.15%
0
2
4
6
8
10
12
9.53
7.43
alpha
beta
3) Fixed Assets Turnover Ratio:
Particulars Formula Alpha Ltd Beta Ltd
COGS 336000 236250
Total Fixed Assets 147000 206000
Fixed assets Turnover
Ratio
COGS/ Total Fixes
Assets
2.28% 1.15%
⊘ This is a preview!⊘
Do you want full access?
Subscribe today to unlock all pages.

Trusted by 1+ million students worldwide

Fixed assets Turnover Ratio
0
0.5
1
1.5
2
2.5
2.28
1.15 alpha
beta
Solvency Ratio
1) Debt Equity ratio:
Particulars Formula Alpha Ltd Beta Ltd
Total long term Debt 52500 -
Share holder fund 155500 201000
Debt Equity ratio Total long term debt/
share holder fund
0.34% 0.00%
0
0.5
1
1.5
2
2.5
2.28
1.15 alpha
beta
Solvency Ratio
1) Debt Equity ratio:
Particulars Formula Alpha Ltd Beta Ltd
Total long term Debt 52500 -
Share holder fund 155500 201000
Debt Equity ratio Total long term debt/
share holder fund
0.34% 0.00%
Paraphrase This Document
Need a fresh take? Get an instant paraphrase of this document with our AI Paraphraser

debt equity ratio
0
0.05
0.1
0.15
0.2
0.25
0.3
0.35
0.4
0.34
0
alpha
beta
2) proprietary Ratio:
Particulars Formula Alpha Ltd Beta Ltd
Shareholder fund 155500 201000
Total assets 261950 328220
Proprietary ratio share holder fund/ total
assets
0.59% 0.61
0
0.05
0.1
0.15
0.2
0.25
0.3
0.35
0.4
0.34
0
alpha
beta
2) proprietary Ratio:
Particulars Formula Alpha Ltd Beta Ltd
Shareholder fund 155500 201000
Total assets 261950 328220
Proprietary ratio share holder fund/ total
assets
0.59% 0.61

Proprietary ratio
0.575
0.58
0.585
0.59
0.595
0.6
0.605
0.61
0.615
0.59
0.61
alpha
beta
(B) Interpretations of Ratio
1) Current Ratio - The ideal current ratio is 2:1 if any company has double its assets in
respect to its current liabilities then it shows good condition of company (Lee and Lee 2018).
Alpha Ltd current ratio is 2.13, which means company have enough assets to pay its current
liabilities. Beta Ltd current ratio is 0.96 means firm don't have enough current assets to meet out
its short term liabilities. So it is necessary for company to invest in current assets. With
comparison of both the companies it is evaluated that Alpha Ltd is better than Beta Ltd
2) Quick Ratio - It measures liquidity using more liquid current assets. If the quick ratio
is greater than 1 means the company has enough quick assets to pay for its current liabilities.
From the above data alpha Ltd has 0.82 times quick ratio which means firm have to invest more
in current assets. Beta Ltd has 0.33 times quick assets so company does not meet out its current
liability. Therefore, both companies need to invest more in current assets. With the comparison
of the above companies alpha Ltd is better company for investment.
3) Gross Profit Ratio - From the above studies it is identified that alpha limited GP ratio
is 20% while beta limited is 25%. Beta Ltd earn more than Alpha Ltd so better to invest in the
Beta Ltd for higher return.
⊘ This is a preview!⊘
Do you want full access?
Subscribe today to unlock all pages.

Trusted by 1+ million students worldwide
1 out of 15

Your All-in-One AI-Powered Toolkit for Academic Success.
 +13062052269
info@desklib.com
Available 24*7 on WhatsApp / Email
Unlock your academic potential
Copyright © 2020–2025 A2Z Services. All Rights Reserved. Developed and managed by ZUCOL.