Economics Alternative Assessment 1: Micro and Macro Analysis
VerifiedAdded on 2022/12/29
|15
|3608
|73
Report
AI Summary
This economics report provides a comprehensive analysis of microeconomic and macroeconomic principles. The microeconomics section explores the relationships between short-run costs, including fixed, variable, marginal, and average costs, along with graphical representations. It further examines the differences in short-run equilibrium for firms operating under perfect competition and those functioning as monopolists, highlighting the implications of market structure on pricing and output decisions. The macroeconomics portion delves into the components of domestic final demand, explaining consumption, investment, government spending, exports, and imports, and their mathematical representation. Additionally, the report critically assesses the use of GDP as a measure of national welfare, arguing that it is not a perfect tool due to its limitations in capturing various aspects of societal well-being. The report concludes by summarizing the key findings and referencing relevant economic literature. This report is a valuable resource for students studying economics, offering in-depth explanations and real-world examples.
Economics Alternative
Assessment
1
Assessment
1
Paraphrase This Document
Need a fresh take? Get an instant paraphrase of this document with our AI Paraphraser
Table of Contents
Introduction .....................................................................................................................................3
Microeconomics - Question 2:.........................................................................................................3
a) Relationships between short run costs................................................................................3
b) Difference between short run equilibrium of firms – one which operates as monopolist and
another operating under perfectly competitive market...........................................................8
Macroeconomics - Question 4:......................................................................................................10
a) Domestic final demand and its components.....................................................................10
b) GDP is not a perfect tool to measure welfare of people of a nation................................12
Conclusion.....................................................................................................................................13
References......................................................................................................................................14
2
Introduction
Economics as a subject is concerned with activities related to products and services such
as production, distribution and consumption (Mäki, 2020). Study of economics can be bifurcated
into two categories – microeconomics and macroeconomics. Microeconomics is that segment of
economics which is concerned with study of individual market, industry or firm, their demand
and supply, price equilibrium, etc. while macroeconomics is that segment of economics which is
concerned with analysis of whole economy, general price level, inflation, deflation, national
income, etc. This essay is aimed at exploring various concepts related to microeconomics and
macroeconomics. In the microeconomics part, relationship between short run costs is explored
and difference between short run equilibrium of firms – one which operates as monopolist and
another operating under perfectly competitive market is discussed. Under the macroeconomics
section, various components of aggregate demands are explored. Further, discussions are made
on how GDP isn't a perfect tool to measure welfare of people of a nation.
Microeconomics - Question 2:
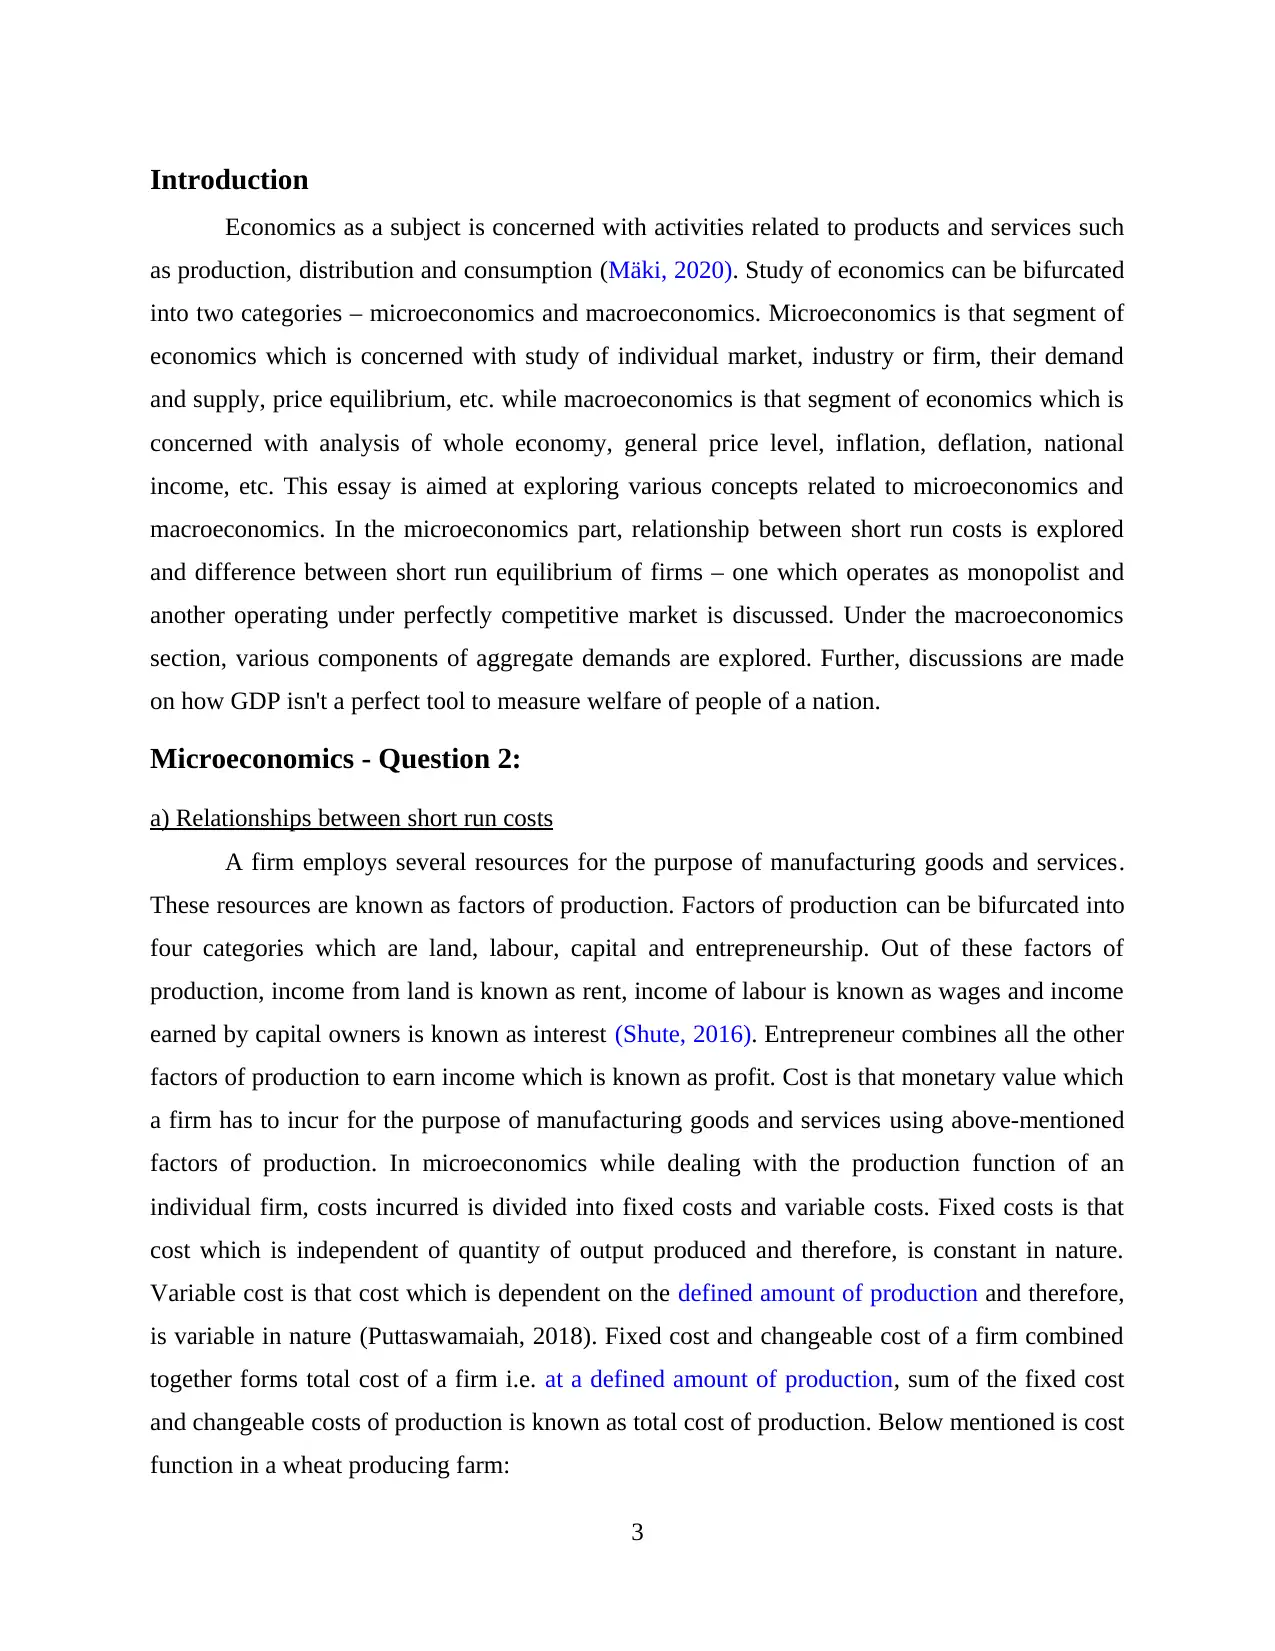
a) Relationships between short run costs
A firm employs several resources for the purpose of manufacturing goods and services.
These resources are known as factors of production. Factors of production can be bifurcated into
four categories which are land, labour, capital and entrepreneurship. Out of these factors of
production, income from land is known as rent, income of labour is known as wages and income
earned by capital owners is known as interest (Shute, 2016). Entrepreneur combines all the other
factors of production to earn income which is known as profit. Cost is that monetary value which
a firm has to incur for the purpose of manufacturing goods and services using above-mentioned
factors of production. In microeconomics while dealing with the production function of an
individual firm, costs incurred is divided into fixed costs and variable costs. Fixed costs is that
cost which is independent of quantity of output produced and therefore, is constant in nature.
Variable cost is that cost which is dependent on the defined amount of production and therefore,
is variable in nature (Puttaswamaiah, 2018). Fixed cost and changeable cost of a firm combined
together forms total cost of a firm i.e. at a defined amount of production, sum of the fixed cost
and changeable costs of production is known as total cost of production. Below mentioned is cost
function in a wheat producing farm:
3
Economics as a subject is concerned with activities related to products and services such
as production, distribution and consumption (Mäki, 2020). Study of economics can be bifurcated
into two categories – microeconomics and macroeconomics. Microeconomics is that segment of
economics which is concerned with study of individual market, industry or firm, their demand
and supply, price equilibrium, etc. while macroeconomics is that segment of economics which is
concerned with analysis of whole economy, general price level, inflation, deflation, national
income, etc. This essay is aimed at exploring various concepts related to microeconomics and
macroeconomics. In the microeconomics part, relationship between short run costs is explored
and difference between short run equilibrium of firms – one which operates as monopolist and
another operating under perfectly competitive market is discussed. Under the macroeconomics
section, various components of aggregate demands are explored. Further, discussions are made
on how GDP isn't a perfect tool to measure welfare of people of a nation.
Microeconomics - Question 2:
a) Relationships between short run costs
A firm employs several resources for the purpose of manufacturing goods and services.
These resources are known as factors of production. Factors of production can be bifurcated into
four categories which are land, labour, capital and entrepreneurship. Out of these factors of
production, income from land is known as rent, income of labour is known as wages and income
earned by capital owners is known as interest (Shute, 2016). Entrepreneur combines all the other
factors of production to earn income which is known as profit. Cost is that monetary value which
a firm has to incur for the purpose of manufacturing goods and services using above-mentioned
factors of production. In microeconomics while dealing with the production function of an
individual firm, costs incurred is divided into fixed costs and variable costs. Fixed costs is that
cost which is independent of quantity of output produced and therefore, is constant in nature.
Variable cost is that cost which is dependent on the defined amount of production and therefore,
is variable in nature (Puttaswamaiah, 2018). Fixed cost and changeable cost of a firm combined
together forms total cost of a firm i.e. at a defined amount of production, sum of the fixed cost
and changeable costs of production is known as total cost of production. Below mentioned is cost
function in a wheat producing farm:
3
⊘ This is a preview!⊘
Do you want full access?
Subscribe today to unlock all pages.
Trusted by 1+ million students worldwide
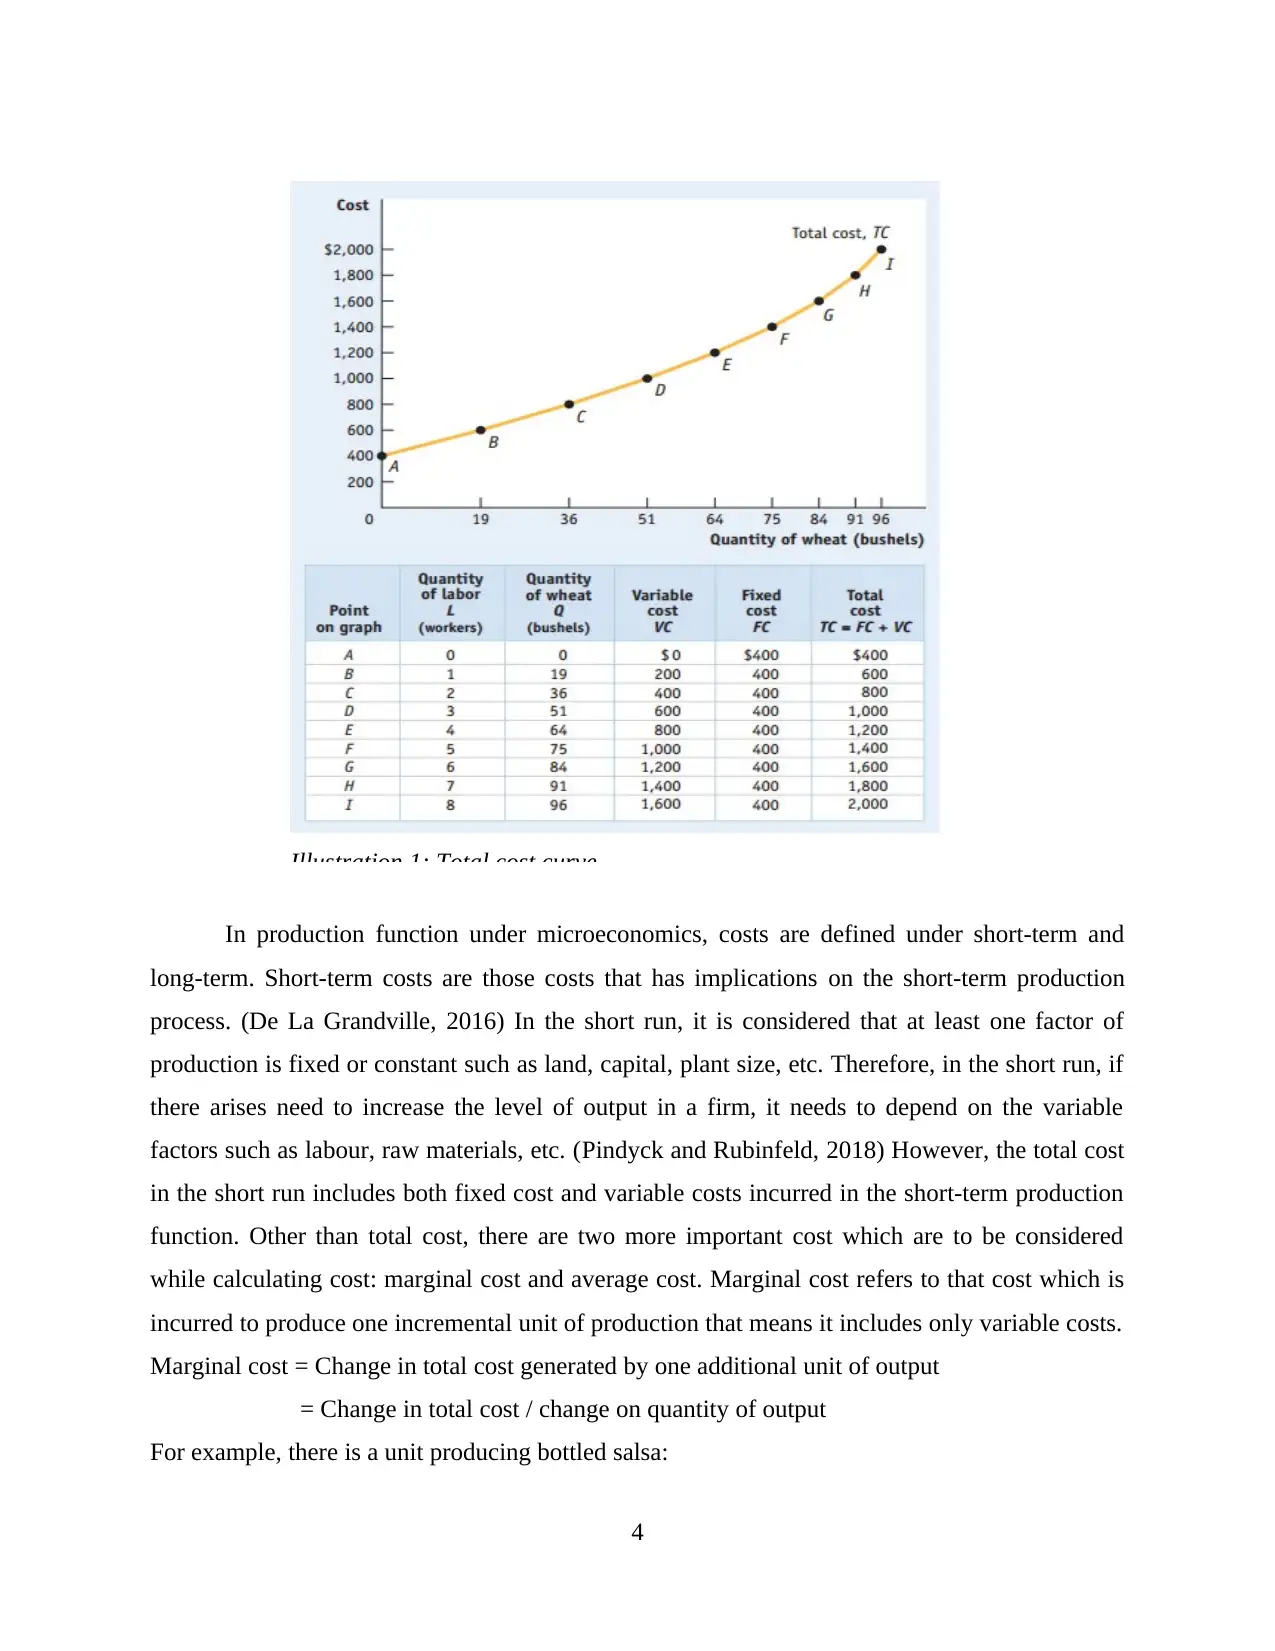
In production function under microeconomics, costs are defined under short-term and
long-term. Short-term costs are those costs that has implications on the short-term production
process. (De La Grandville, 2016) In the short run, it is considered that at least one factor of
production is fixed or constant such as land, capital, plant size, etc. Therefore, in the short run, if
there arises need to increase the level of output in a firm, it needs to depend on the variable
factors such as labour, raw materials, etc. (Pindyck and Rubinfeld, 2018) However, the total cost
in the short run includes both fixed cost and variable costs incurred in the short-term production
function. Other than total cost, there are two more important cost which are to be considered
while calculating cost: marginal cost and average cost. Marginal cost refers to that cost which is
incurred to produce one incremental unit of production that means it includes only variable costs.
Marginal cost = Change in total cost generated by one additional unit of output
= Change in total cost / change on quantity of output
For example, there is a unit producing bottled salsa:
4
Illustration 1: Total cost curve
Paraphrase This Document
Need a fresh take? Get an instant paraphrase of this document with our AI Paraphraser
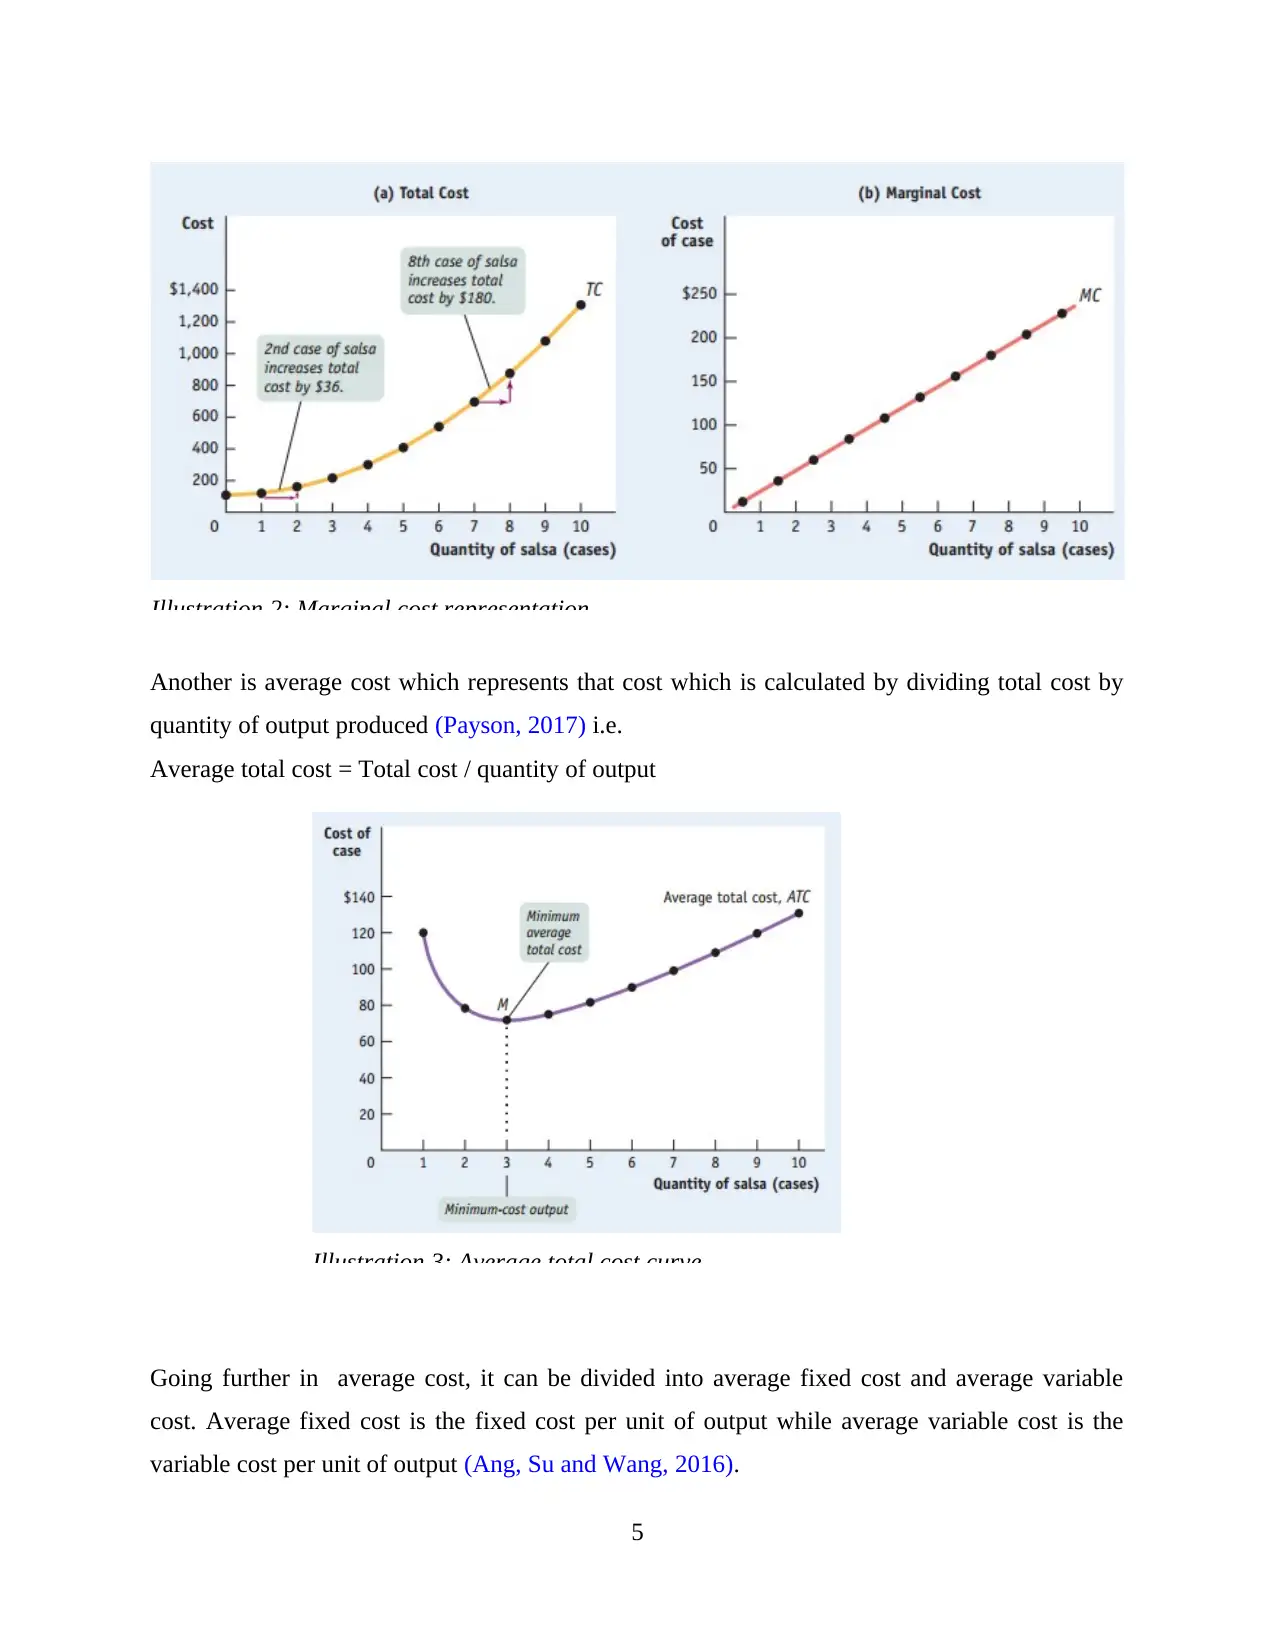
Another is average cost which represents that cost which is calculated by dividing total cost by
quantity of output produced (Payson, 2017) i.e.
Average total cost = Total cost / quantity of output
Going further in average cost, it can be divided into average fixed cost and average variable
cost. Average fixed cost is the fixed cost per unit of output while average variable cost is the
variable cost per unit of output (Ang, Su and Wang, 2016).
5
Illustration 2: Marginal cost representation
Illustration 3: Average total cost curve
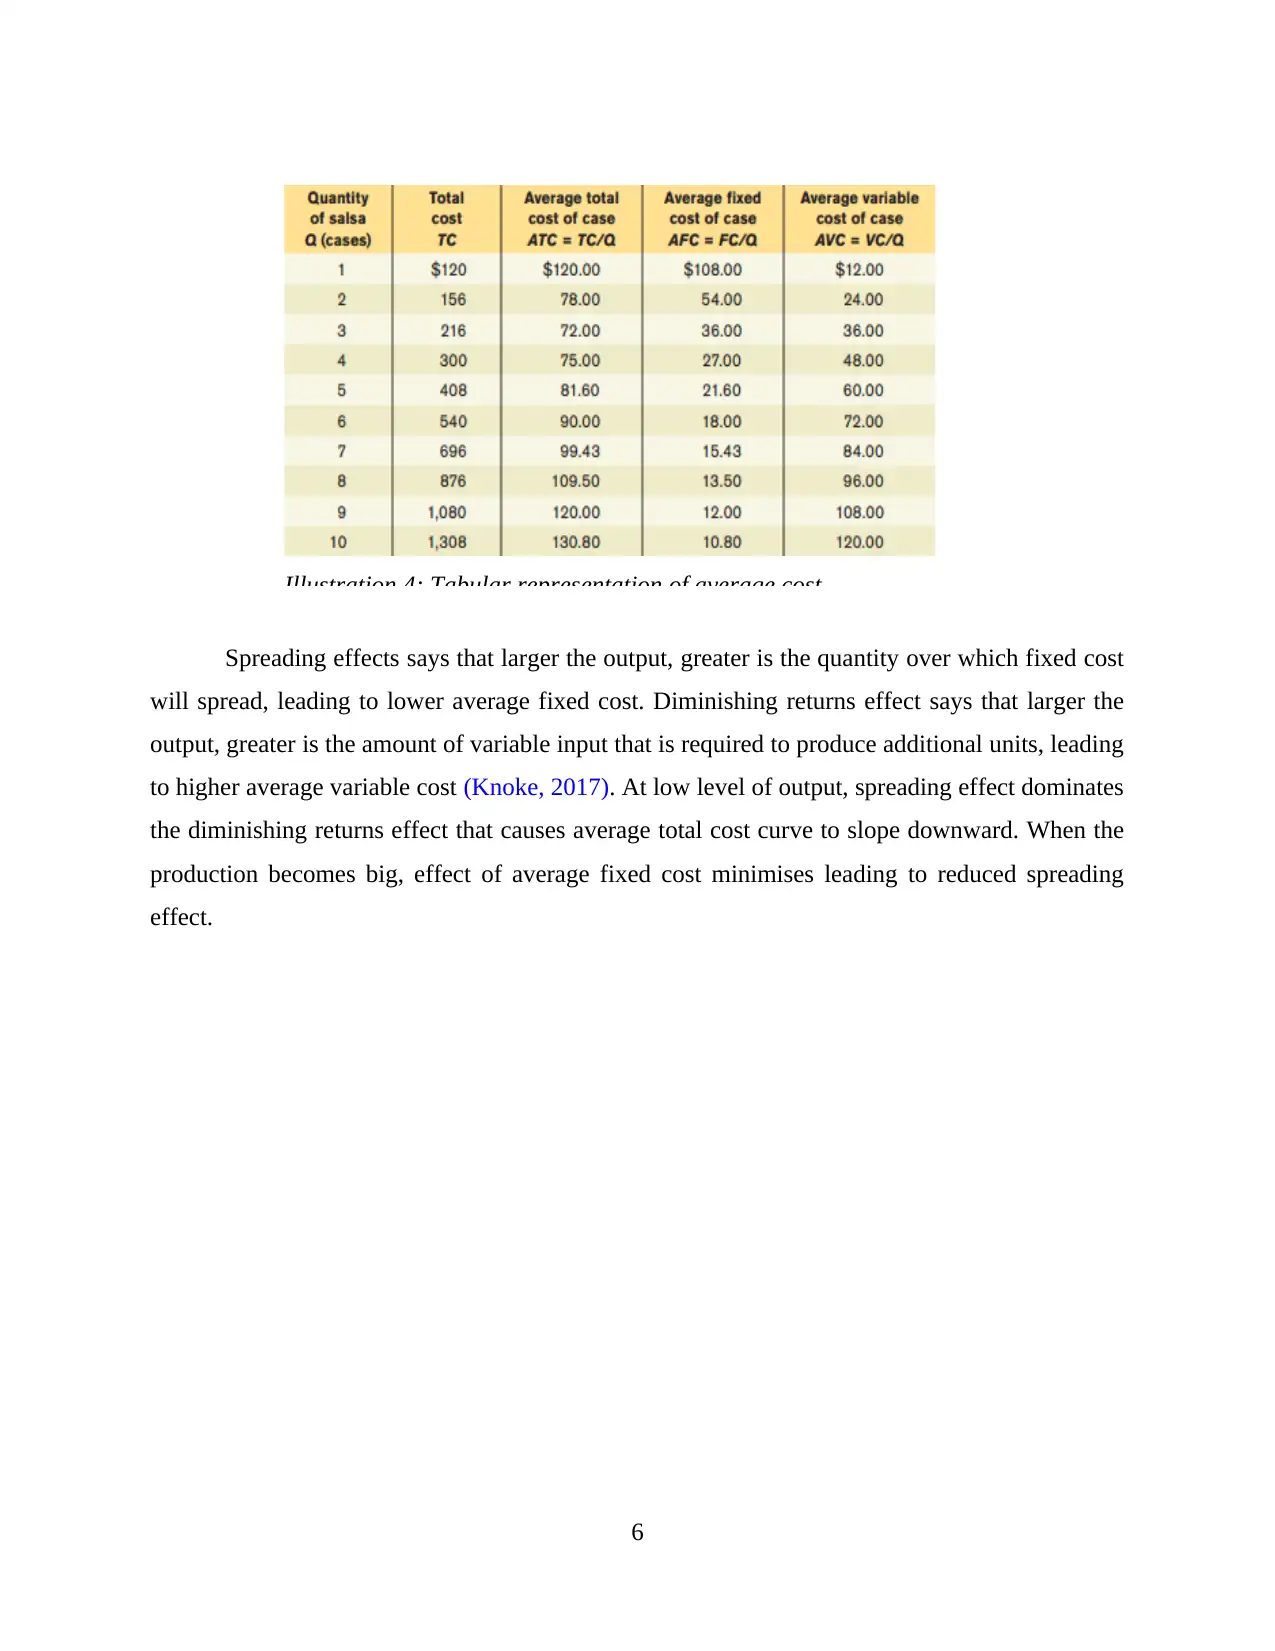
Spreading effects says that larger the output, greater is the quantity over which fixed cost
will spread, leading to lower average fixed cost. Diminishing returns effect says that larger the
output, greater is the amount of variable input that is required to produce additional units, leading
to higher average variable cost (Knoke, 2017). At low level of output, spreading effect dominates
the diminishing returns effect that causes average total cost curve to slope downward. When the
production becomes big, effect of average fixed cost minimises leading to reduced spreading
effect.
6
Illustration 4: Tabular representation of average cost
⊘ This is a preview!⊘
Do you want full access?
Subscribe today to unlock all pages.
Trusted by 1+ million students worldwide
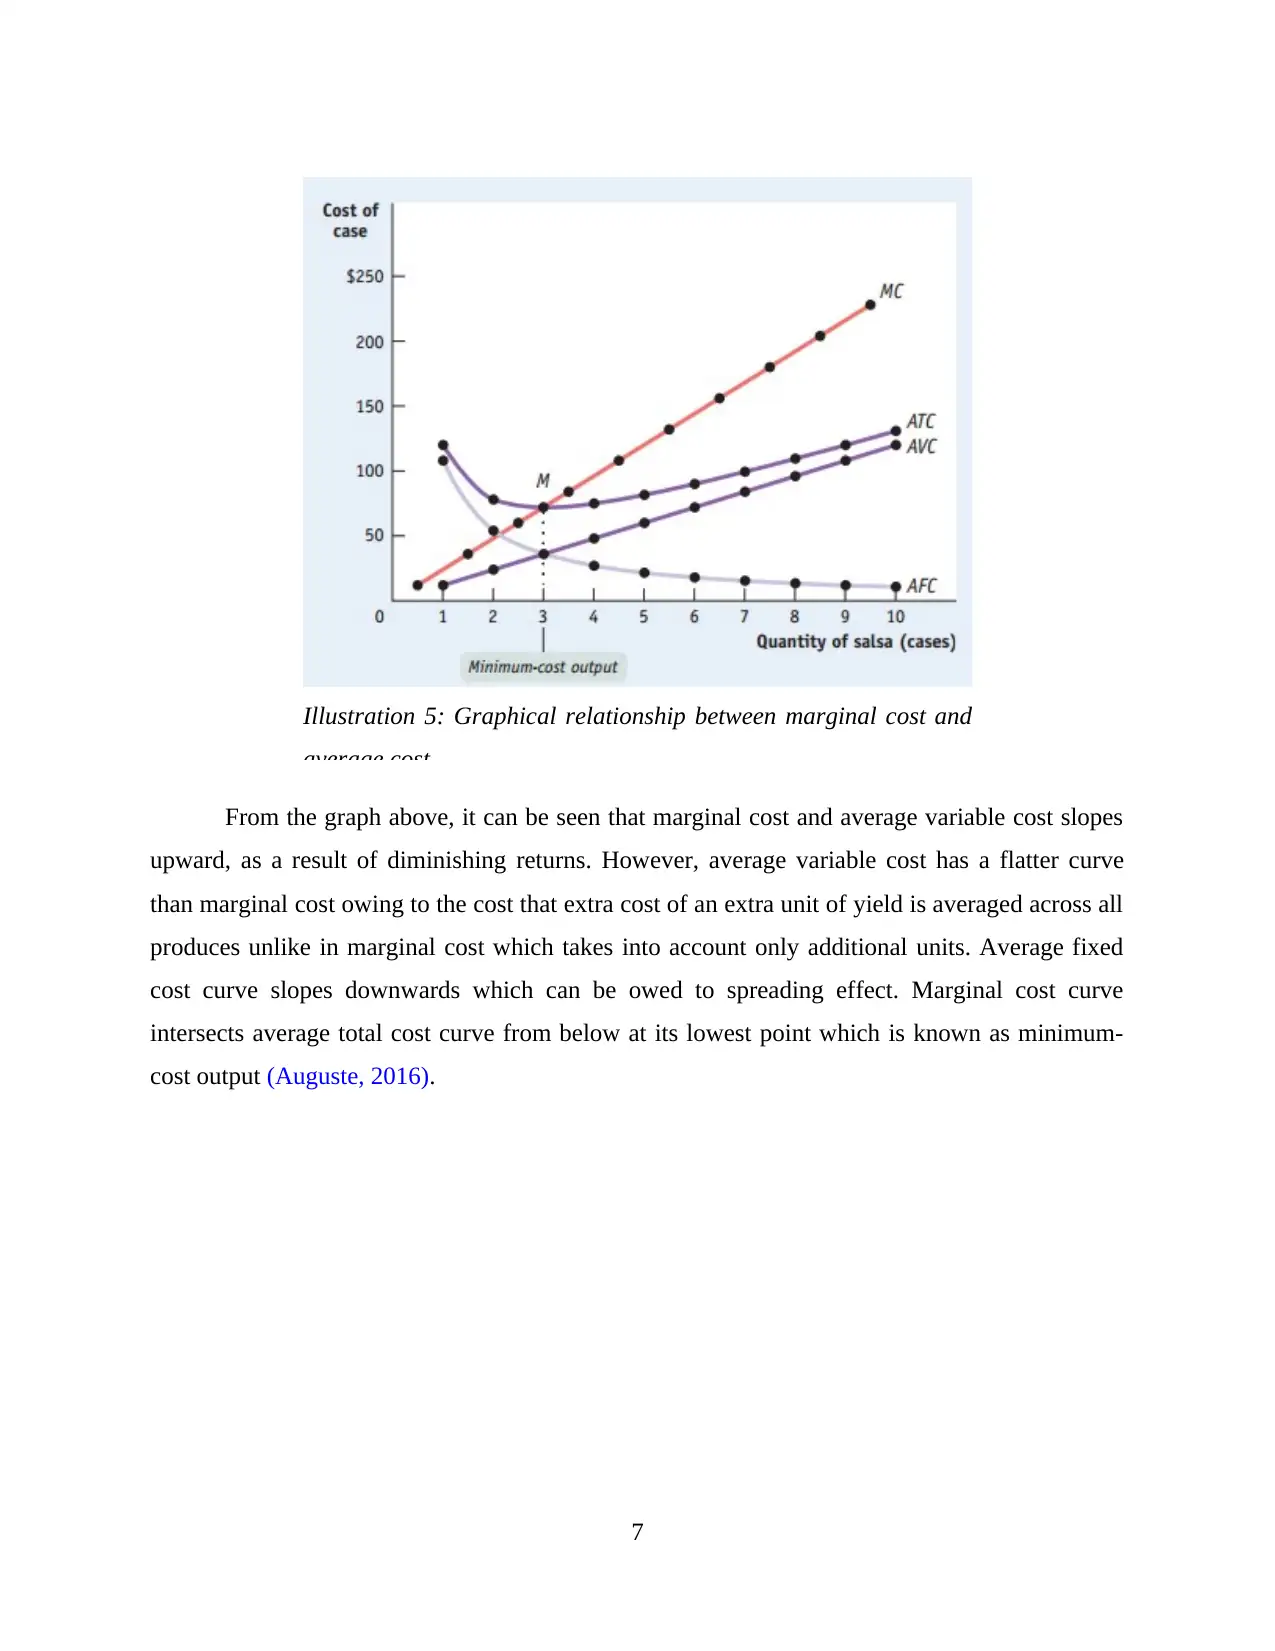
From the graph above, it can be seen that marginal cost and average variable cost slopes
upward, as a result of diminishing returns. However, average variable cost has a flatter curve
than marginal cost owing to the cost that extra cost of an extra unit of yield is averaged across all
produces unlike in marginal cost which takes into account only additional units. Average fixed
cost curve slopes downwards which can be owed to spreading effect. Marginal cost curve
intersects average total cost curve from below at its lowest point which is known as minimum-
cost output (Auguste, 2016).
7
Illustration 5: Graphical relationship between marginal cost and
average cost
Paraphrase This Document
Need a fresh take? Get an instant paraphrase of this document with our AI Paraphraser
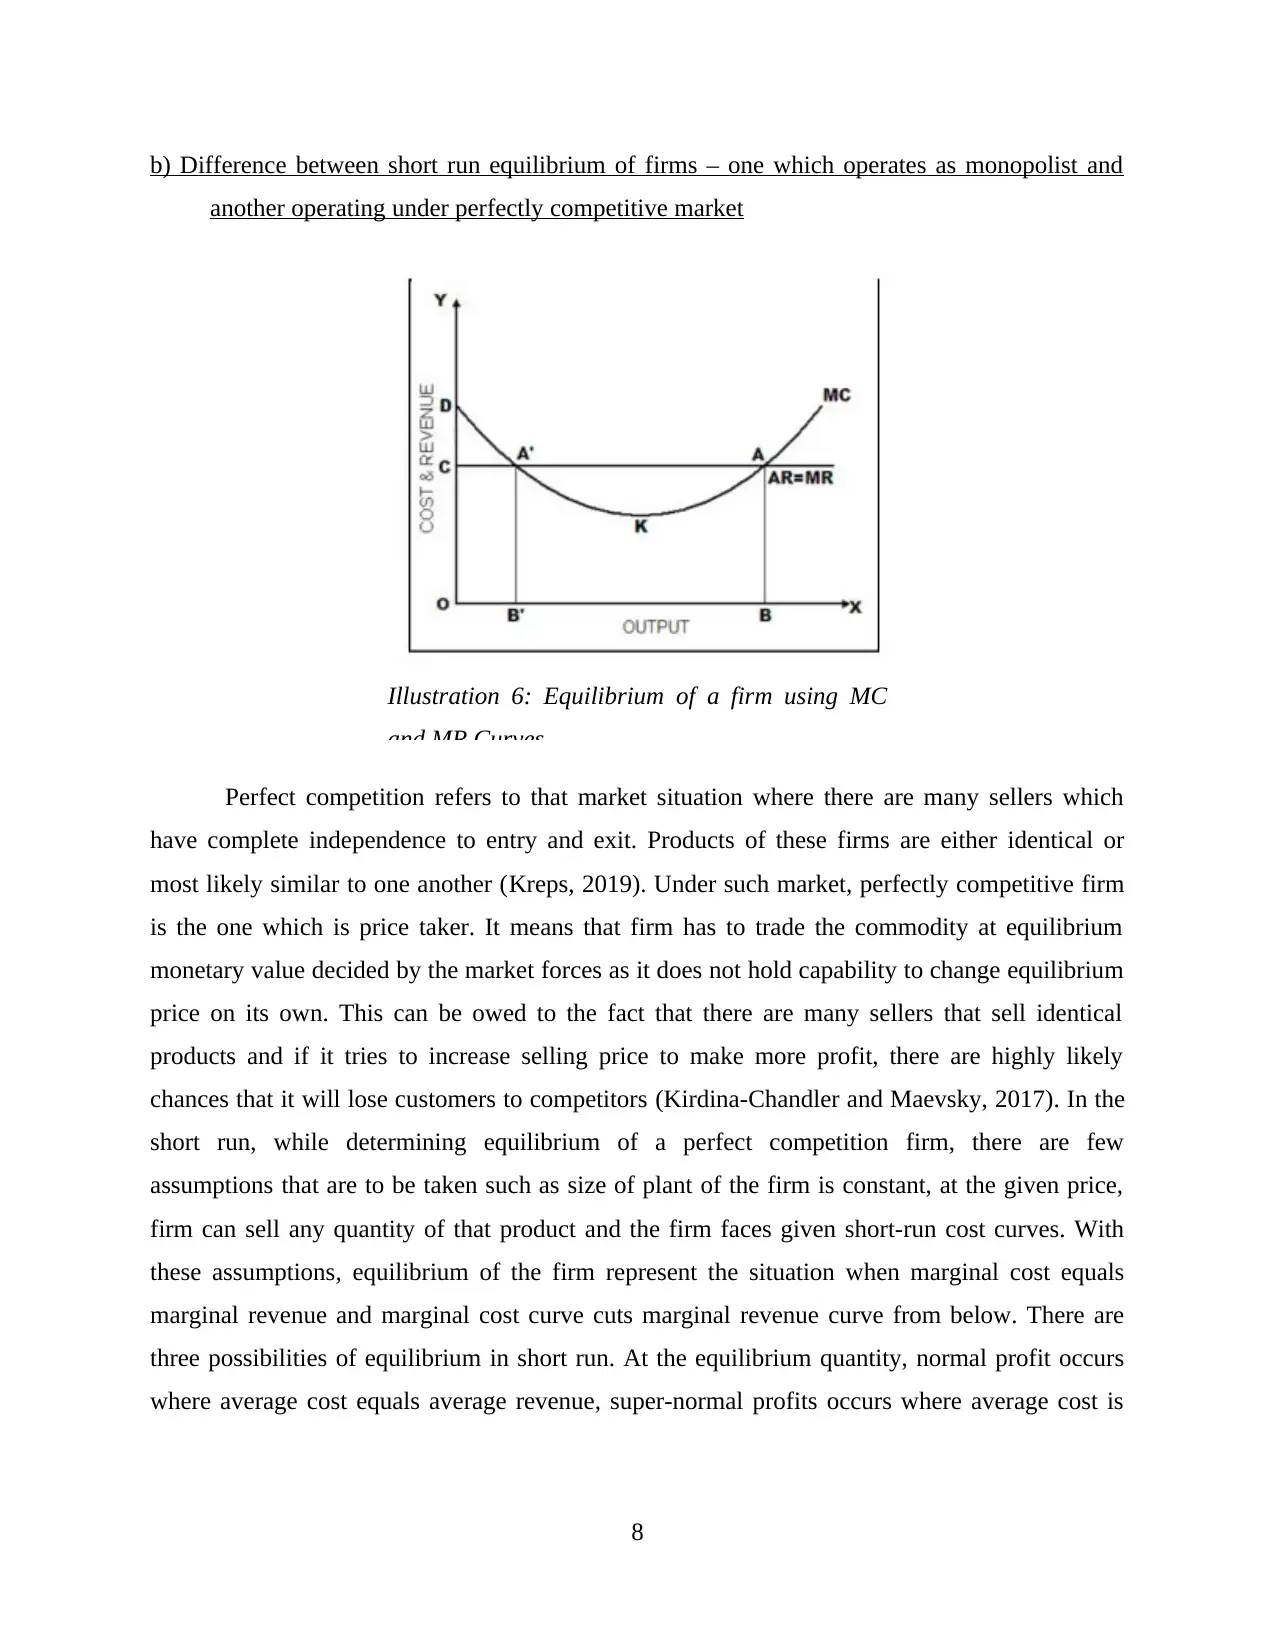
b) Difference between short run equilibrium of firms – one which operates as monopolist and
another operating under perfectly competitive market
Perfect competition refers to that market situation where there are many sellers which
have complete independence to entry and exit. Products of these firms are either identical or
most likely similar to one another (Kreps, 2019). Under such market, perfectly competitive firm
is the one which is price taker. It means that firm has to trade the commodity at equilibrium
monetary value decided by the market forces as it does not hold capability to change equilibrium
price on its own. This can be owed to the fact that there are many sellers that sell identical
products and if it tries to increase selling price to make more profit, there are highly likely
chances that it will lose customers to competitors (Kirdina-Chandler and Maevsky, 2017). In the
short run, while determining equilibrium of a perfect competition firm, there are few
assumptions that are to be taken such as size of plant of the firm is constant, at the given price,
firm can sell any quantity of that product and the firm faces given short-run cost curves. With
these assumptions, equilibrium of the firm represent the situation when marginal cost equals
marginal revenue and marginal cost curve cuts marginal revenue curve from below. There are
three possibilities of equilibrium in short run. At the equilibrium quantity, normal profit occurs
where average cost equals average revenue, super-normal profits occurs where average cost is
8
Illustration 6: Equilibrium of a firm using MC
and MR Curves
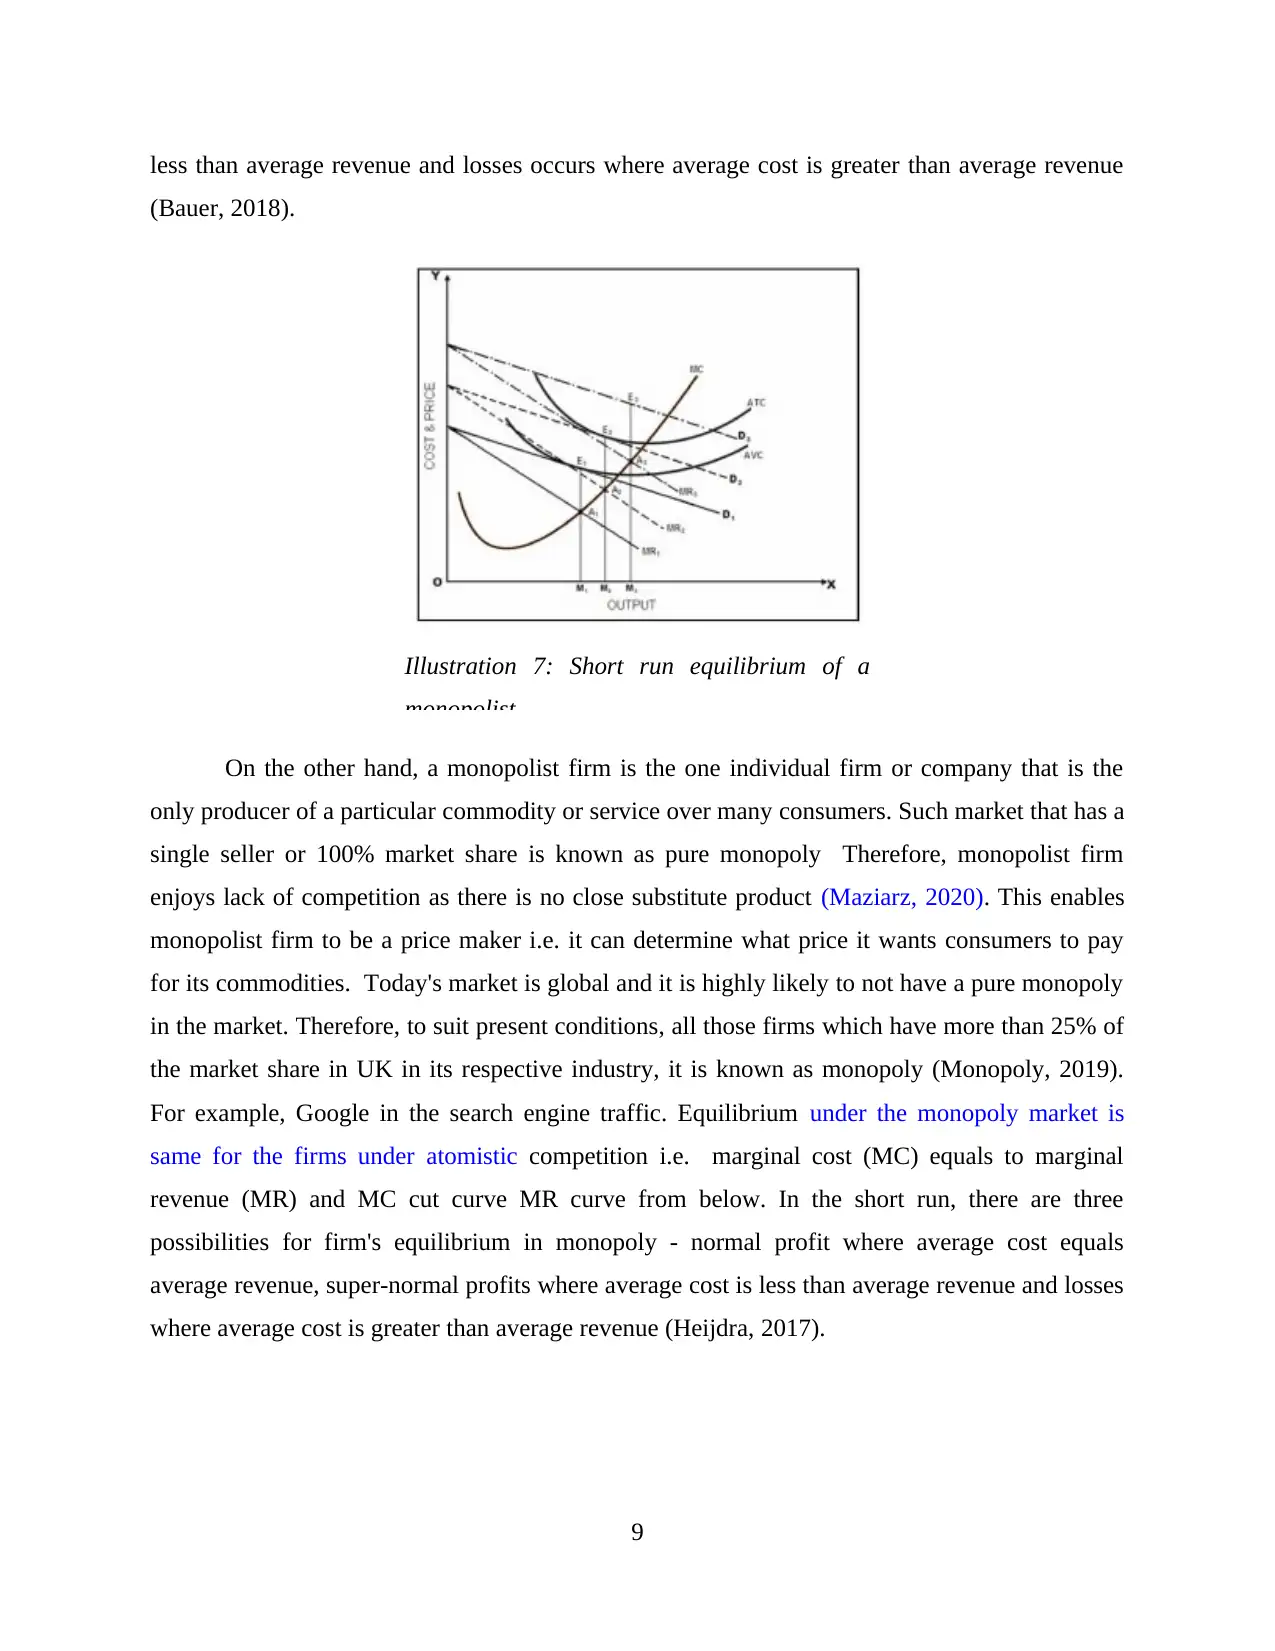
less than average revenue and losses occurs where average cost is greater than average revenue
(Bauer, 2018).
On the other hand, a monopolist firm is the one individual firm or company that is the
only producer of a particular commodity or service over many consumers. Such market that has a
single seller or 100% market share is known as pure monopoly Therefore, monopolist firm
enjoys lack of competition as there is no close substitute product (Maziarz, 2020). This enables
monopolist firm to be a price maker i.e. it can determine what price it wants consumers to pay
for its commodities. Today's market is global and it is highly likely to not have a pure monopoly
in the market. Therefore, to suit present conditions, all those firms which have more than 25% of
the market share in UK in its respective industry, it is known as monopoly (Monopoly, 2019).
For example, Google in the search engine traffic. Equilibrium under the monopoly market is
same for the firms under atomistic competition i.e. marginal cost (MC) equals to marginal
revenue (MR) and MC cut curve MR curve from below. In the short run, there are three
possibilities for firm's equilibrium in monopoly - normal profit where average cost equals
average revenue, super-normal profits where average cost is less than average revenue and losses
where average cost is greater than average revenue (Heijdra, 2017).
9
Illustration 7: Short run equilibrium of a
monopolist
⊘ This is a preview!⊘
Do you want full access?
Subscribe today to unlock all pages.
Trusted by 1+ million students worldwide
Macroeconomics - Question 4:
a) Domestic final demand and its components
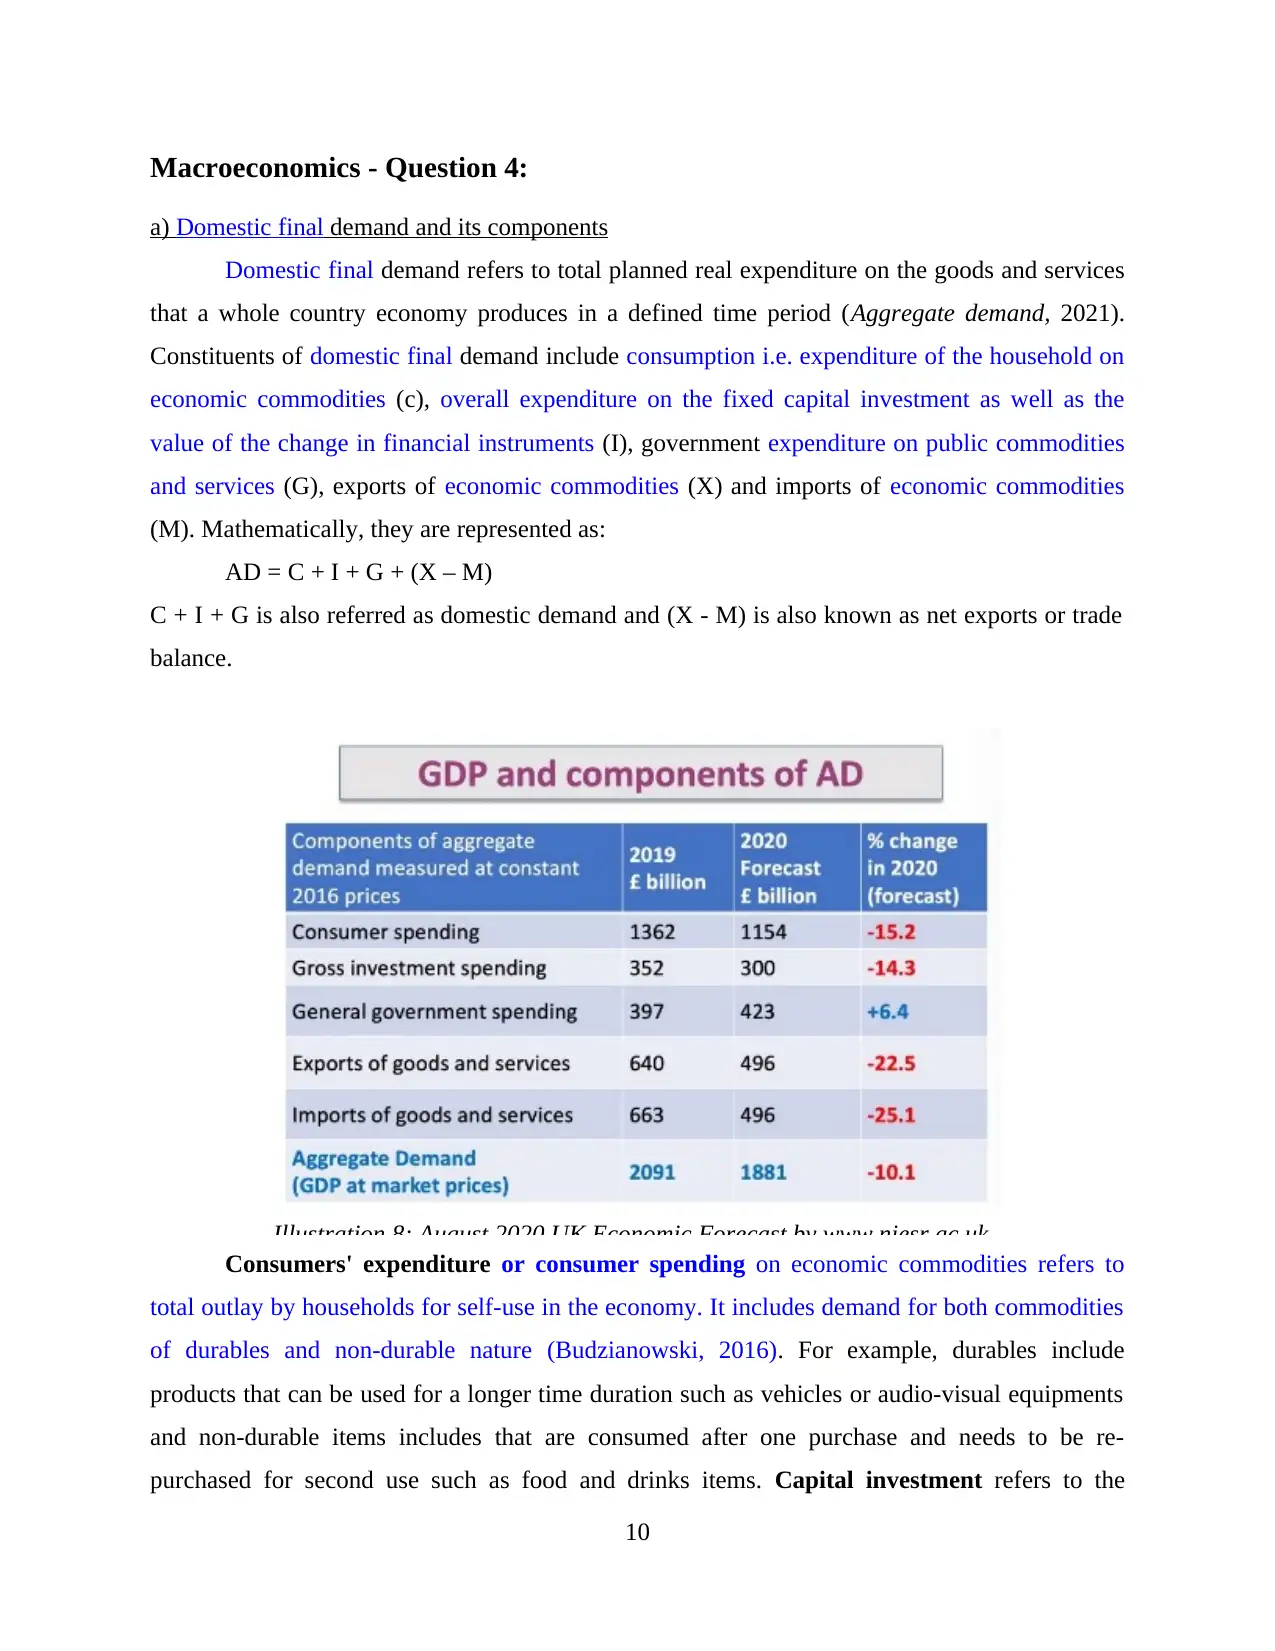
Domestic final demand refers to total planned real expenditure on the goods and services
that a whole country economy produces in a defined time period (Aggregate demand, 2021).
Constituents of domestic final demand include consumption i.e. expenditure of the household on
economic commodities (c), overall expenditure on the fixed capital investment as well as the
value of the change in financial instruments (I), government expenditure on public commodities
and services (G), exports of economic commodities (X) and imports of economic commodities
(M). Mathematically, they are represented as:
AD = C + I + G + (X – M)
C + I + G is also referred as domestic demand and (X - M) is also known as net exports or trade
balance.
Consumers' expenditure or consumer spending on economic commodities refers to
total outlay by households for self-use in the economy. It includes demand for both commodities
of durables and non-durable nature (Budzianowski, 2016). For example, durables include
products that can be used for a longer time duration such as vehicles or audio-visual equipments
and non-durable items includes that are consumed after one purchase and needs to be re-
purchased for second use such as food and drinks items. Capital investment refers to the
10
Illustration 8: August 2020 UK Economic Forecast by www.niesr.ac.uk
a) Domestic final demand and its components
Domestic final demand refers to total planned real expenditure on the goods and services
that a whole country economy produces in a defined time period (Aggregate demand, 2021).
Constituents of domestic final demand include consumption i.e. expenditure of the household on
economic commodities (c), overall expenditure on the fixed capital investment as well as the
value of the change in financial instruments (I), government expenditure on public commodities
and services (G), exports of economic commodities (X) and imports of economic commodities
(M). Mathematically, they are represented as:
AD = C + I + G + (X – M)
C + I + G is also referred as domestic demand and (X - M) is also known as net exports or trade
balance.
Consumers' expenditure or consumer spending on economic commodities refers to
total outlay by households for self-use in the economy. It includes demand for both commodities
of durables and non-durable nature (Budzianowski, 2016). For example, durables include
products that can be used for a longer time duration such as vehicles or audio-visual equipments
and non-durable items includes that are consumed after one purchase and needs to be re-
purchased for second use such as food and drinks items. Capital investment refers to the
10
Illustration 8: August 2020 UK Economic Forecast by www.niesr.ac.uk
Paraphrase This Document
Need a fresh take? Get an instant paraphrase of this document with our AI Paraphraser
expenditure on assets like machinery and equipment, land and building, etc. These investment
are generally made to produce more consumer goods in the future. It also includes spending on
working capital (Petrakis, 2020). For example, investment over the stock of finished and semi-
finished inventory. Investment expenditure results in changes in the value of stock. Suppose,
there are cases when production output is either lower than demand. Reacting to demand,
producer made investment expenditure in increasing the capacity of production. Investment
expenditure on plant and machinery will change the output to either equal to demand or more
than that in anticipation of further increase in demand. Government spending refers to the
expenditure made by government or government authorities on public goods and merit goods.
These decisions by government are generally reflected in the annual budget of the government
(Blanchard, 2017). It is the reflection of the government decision as to how much the
government is going to make expenditures that will be affecting developments in the economy of
the country. Each government has their political ideology and priories their agendas of public
spending accordingly. System expenditure on public economic commodities usually accounts
approximately 18-20%. However, government spending in economy fails to capture the accurate
size of the system expenditure in the economic system as only some expenditure of the
government is in the form of investment while a lot bigger size of quantity goes on in the
payment for providing welfare to the residents of the state. Spending in the form of transfer
payment welfare such as post retirement payments, allowances to those who are seeking jobs,
etc. are not to be included in present-day expenditure of the government as they do not represent
for any asset generation out of those investments rather they are transfer of amount from one
group to another. For example, people paying income taxes represents income of the government
while state pensioners are those who represent expenses of the government and payment to
pensioner is like transferring the amount from tax payers to pensioners. Exports of economic
commodities factor includes demand of those economic commodities that have to sell overseas.
It is like an influx of requests of economic commodities that injects into cyclical flow of capital
and revenue inflow and outflow added to the domestic influx of requests of economic
commodities to make aggregate-demand (Basole and Ramnarain, 2016). Imports of economic
commodities factor includes demand of those economic commodities which represents
withdrawal of demand, also known as leakage from the circular flow of income and expenditure.
Net exports refers to the value which represents relationship of export demand and import
11
demand. When there is surplus of export over import, it is known as trade surplus while there is
surplus of import over export, it is known as trade deficit. UK has been experiencing trade deficit
in its aggregate-demand in GDP since several years for now (Dosi and Mohnen, 2019).
b) GDP is not a perfect tool to measure welfare of people of a nation
GDP reflects a highlights of income earned in total in an economy along with the
aggregate spending on products and services. When gross domestic product of a country is
divided by its population, it gives out the information such as GDP attributable to citizens in the
economy as well as the earning and spending i.e. personal disposable income for an ordinary
resident of that specific economy. Since, earnings of higher level and outlay of higher level are
treated as symbol of being well-off, higher GDP per person is treated as natural measure to
account for the economic well-being of the average individual (Martins, 2017). However, there
are some points that act as critical to take it in as appropriate measure to treat it as a good
measure of well-being of a nation. For example, it ignores the income disparity among adult
citizens and disparity in quality of healthcare and education available to children. It ignores
social aspects such as fraternity among the society or integrity among the public officials. It
ignores importance of moral values such as courage, wisdom, devotion to country, etc. in the
citizens of the country. This shows that it only shows superficial information about the public of
the country and ignores the real benefactors that counts while measuring well-being of a nation.
GDP also leaves out factors that can lead to such leisure i.e. if people won't take rest and work
tirelessly, production would increase and GDP will rise but the people won't be well off as gain
from higher production would be offset by fatigue and reduced morale from reduced leisure
(Crespo, 2017). Also, it only takes into account commercial production and leaves out domestic
production such as in homes. For example, a dish prepared at a restaurant is counted in GDP
while same dish prepared at home is excluded. This shows incorrect production figures. Further,
it ignores affect of commercial production on the quality of the environment which can have
negative impact over health of citizens.
However, it cannot be said that GDP is a waste indicator to measure that whether citizens
of the country are living well-off or not. As for example, though higher GDP does not ensure
good health of the children, it can indicate the resources available with the country that can
provide for better infrastructure that can lead to improvement in the health of the children.
Therefore, children in the countries with the higher GDP often enjoys better healthcare and
12
⊘ This is a preview!⊘
Do you want full access?
Subscribe today to unlock all pages.
Trusted by 1+ million students worldwide
1 out of 15
Related Documents


Your All-in-One AI-Powered Toolkit for Academic Success.
+13062052269
info@desklib.com
Available 24*7 on WhatsApp / Email
![[object Object]](/_next/static/media/star-bottom.7253800d.svg)
Unlock your academic potential
Copyright © 2020–2026 A2Z Services. All Rights Reserved. Developed and managed by ZUCOL.