Comprehensive Financial Analysis of Amaysim Limited (ASX Listed)
VerifiedAdded on 2021/06/17
|21
|5033
|44
Report
AI Summary
This report provides a comprehensive financial analysis of Amaysim Limited, a company listed on the Australian Securities Exchange (ASX). It begins with an overview of the company's profile and corporate governance structure, followed by a detailed examination of key financial ratios, including liquidity, profitability, and efficiency ratios, to assess Amaysim's financial health and operational performance. The report also includes the computation of the Weighted Average Cost of Capital (WACC) and beta to evaluate the company's risk profile, along with a debt ratio analysis. The analysis covers the period from 2016 to 2017. The report concludes with recommendations based on the financial analysis, offering insights into Amaysim's strengths, weaknesses, and potential areas for improvement. The report also includes the substantial stakeholders and board relationships.

qwertyuiopasdfghjklzxcvbnmqwerty
uiopasdfghjklzxcvbnmqwertyuiopasd
fghjklzxcvbnmqwertyuiopasdfghjklzx
cvbnmqwertyuiopasdfghjklzxcvbnmq
wertyuiopasdfghjklzxcvbnmqwertyui
opasdfghjklzxcvbnmqwertyuiopasdfg
hjklzxcvbnmqwertyuiopasdfghjklzxc
vbnmqwertyuiopasdfghjklzxcvbnmq
wertyuiopasdfghjklzxcvbnmqwertyui
opasdfghjklzxcvbnmqwertyuiopasdfg
hjklzxcvbnmqwertyuiopasdfghjklzxc
vbnmqwertyuiopasdfghjklzxcvbnmq
wertyuiopasdfghjklzxcvbnmqwertyui
opasdfghjklzxcvbnmqwertyuiopasdfg
hjklzxcvbnmrtyuiopasdfghjklzxcvbn
mqwertyuiopasdfghjklzxcvbnmqwert
yuiopasdfghjklzxcvbnmqwertyuiopas
FINANCE
Paraphrase This Document
Need a fresh take? Get an instant paraphrase of this document with our AI Paraphraser
Amaysim
Executive Summary
To analyse the business it is important to have an in-depth evaluation of the business function
together with the financials. The performance of a business can be ascertained through the
business function and its performance in the share market. In this report, the analysis of
Amaysim is done that is listed on the ASX. The report initiates with the business function
followed by the corporate governance. Ratio analysis is being done to know the performance
of the company in terms of various parameters. Further, the WACC and beta is computed to
know the risk worthiness. Further, the debt ratio is computed to know the level of debt of the
company. It is then followed by the recommendation.
2
Amaysim
Contents
Introduction...........................................................................................................................................3
1. Company profile............................................................................................................................4
2. Corporate Governance..................................................................................................................5
Substantial stakeholders....................................................................................................................5
3. Calculation of Performance Ratios.................................................................................................6
Liquidity ratios...............................................................................................................................6
Profitability ratios..........................................................................................................................7
Efficiency ratios..............................................................................................................................8
Market value share........................................................................................................................8
4. Graphs...........................................................................................................................................9
5. Announcements..........................................................................................................................10
6. Beta computation........................................................................................................................10
8. Debt ratio.....................................................................................................................................12
9. Dividend.......................................................................................................................................12
Recommendation and Conclusion.......................................................................................................14
References...........................................................................................................................................15
Appendix.............................................................................................................................................17
3
⊘ This is a preview!⊘
Do you want full access?
Subscribe today to unlock all pages.
Trusted by 1+ million students worldwide
Amaysim
Introduction
In this report, AMAYSIM Limited listed on the ASX is selected for the purpose of study.
Before investing in a particular company it is important that the investors needs to have a
crystal clear view of the company’s functioning. This stretches from the ratio analysis to the
stock movement because one factor does not decide the functioning of the company.
Therefore, to understand the performance of the company, a comprehensive examination of
the various factors is evaluated. The scenario of the company depends on the acts of the
company. The company also tried to indulge into the business sector with the help of merging
with the Australian broadband services private limited in August 2016 which have helped
them a lot in order to accelerate the broadband services strategy and then create a leverage of
their status in the market. Also in the year 2017, the company have decided to use new
marketing techniques in order to enhance the broadband services by improvising new
unlimited data plans, no lock-in contracts, no activation fees and no expenses to be incurred
while switching plans.
4
Paraphrase This Document
Need a fresh take? Get an instant paraphrase of this document with our AI Paraphraser
Amaysim
1. Company profile
The AMAYSIM Limited Australia is a multiversity business that has been based on the
innovative technology and the main focus for them is to provide the best experience to their
customers. The company deals in the business of light and LED business model in which the
customer plays a very important role and no contracts are being taken so that the prices can
be transparent for the mobile devices, Broadband, and energy. After the company has
launched the BYO mobile services in the year 2010 it has observed use growth and the
mobile subscriber base have come up to approximately 1.07 million and those leading them
to become one of the largest mobile operators in Australia (Amaysim, 2017).
AMAYSIM Limited brand is powered by the Optus 4g+ network and is said to have one of
the best customer bases because of the top-notch service they have been providing them for
years. They make attractive offers to the customers by making simple and amazing mobile-
first customer experience platforms that are easy to understand and also very price efficient
so that major groups of the society can buy the product without hesitation (Parrino et. al,
2012). The customers have been given the service in which they are able to contact the care
service centre whenever they want so that the customer will not face any problem and also
give a good review for the product (Amaysim, 2017). The main focus of the company is to
improve the Technology and the customer base that will help them to grow with the help of
advancing new products and services regularly and keeping them involved in the process of
buying and selling. The strategy has made the form to a call from the mobile services
provider to become a big business that offers mobile phones, devices, broadband services,
and energy.
The company has also tried to improve the status of its energy providing branch by merging
with click energy group Holdings Private Limited which is an online Australian energy-
related retailer offering electricity and gas to the consumers. Also, it was observed that the
strategy of the firm was very similar to the merging company which will be helpful in
aligning their work with the management team and thus helps in enhancing the large-scale
operations that will be conducted by the firm in near future. It has been noticed that over
800,000 households have been indulged with the company in order to get the cross cell
potential at its best (Amaysim, 2017). The company has also made an execution team which
5
Amaysim
have made strategies in order to make progress in this field and this work hard in order to get
all these products in the market under the name of AMAYSIM Limited thus making this very
important step in order to gain future importance in the cross-selling potential which will be
unlocked by the application of these kind of strategies. The company has made it clear that it
will be enhancing the technology platform and thus making the trademark of the company-
centric approach so that it may prevail in almost all Australian household in any form of
energy or service (Merchant, 2012).
2. Corporate Governance
The Board of Directors of the company has the duty of putting the business on the right track.
The company referred to here is Amaysim Group. The Board dominates the functions a.ong
with the financial position and thus the output presented by the company. Board decides the
strategy to be followed so that the business gets stronger with time and also decides the
investment sector along with the amount to be invested (Amaysim, 2017). The core of the
Board is to raise the performance rate of the company so as to increase the share price and the
generated revenue. It is the Board who is to see the expansion of the Amaysim Group. It is
the duty of the company to see that all the presented information by the company is made
available to the customers as soon as possible. Rules associated to the timely delivering of
essential and fair information by the company must be made as per the ASX Listing Rules
and the Corporations Act. The policies followed by the company show that how the outlets
of the Amaysim should work and what kind of working atmosphere should exist. Legal
guidance is also necessary for the expansion so that the outlets carry on their duty under the
legal rules and regulations that are framed as per the policies of the company.
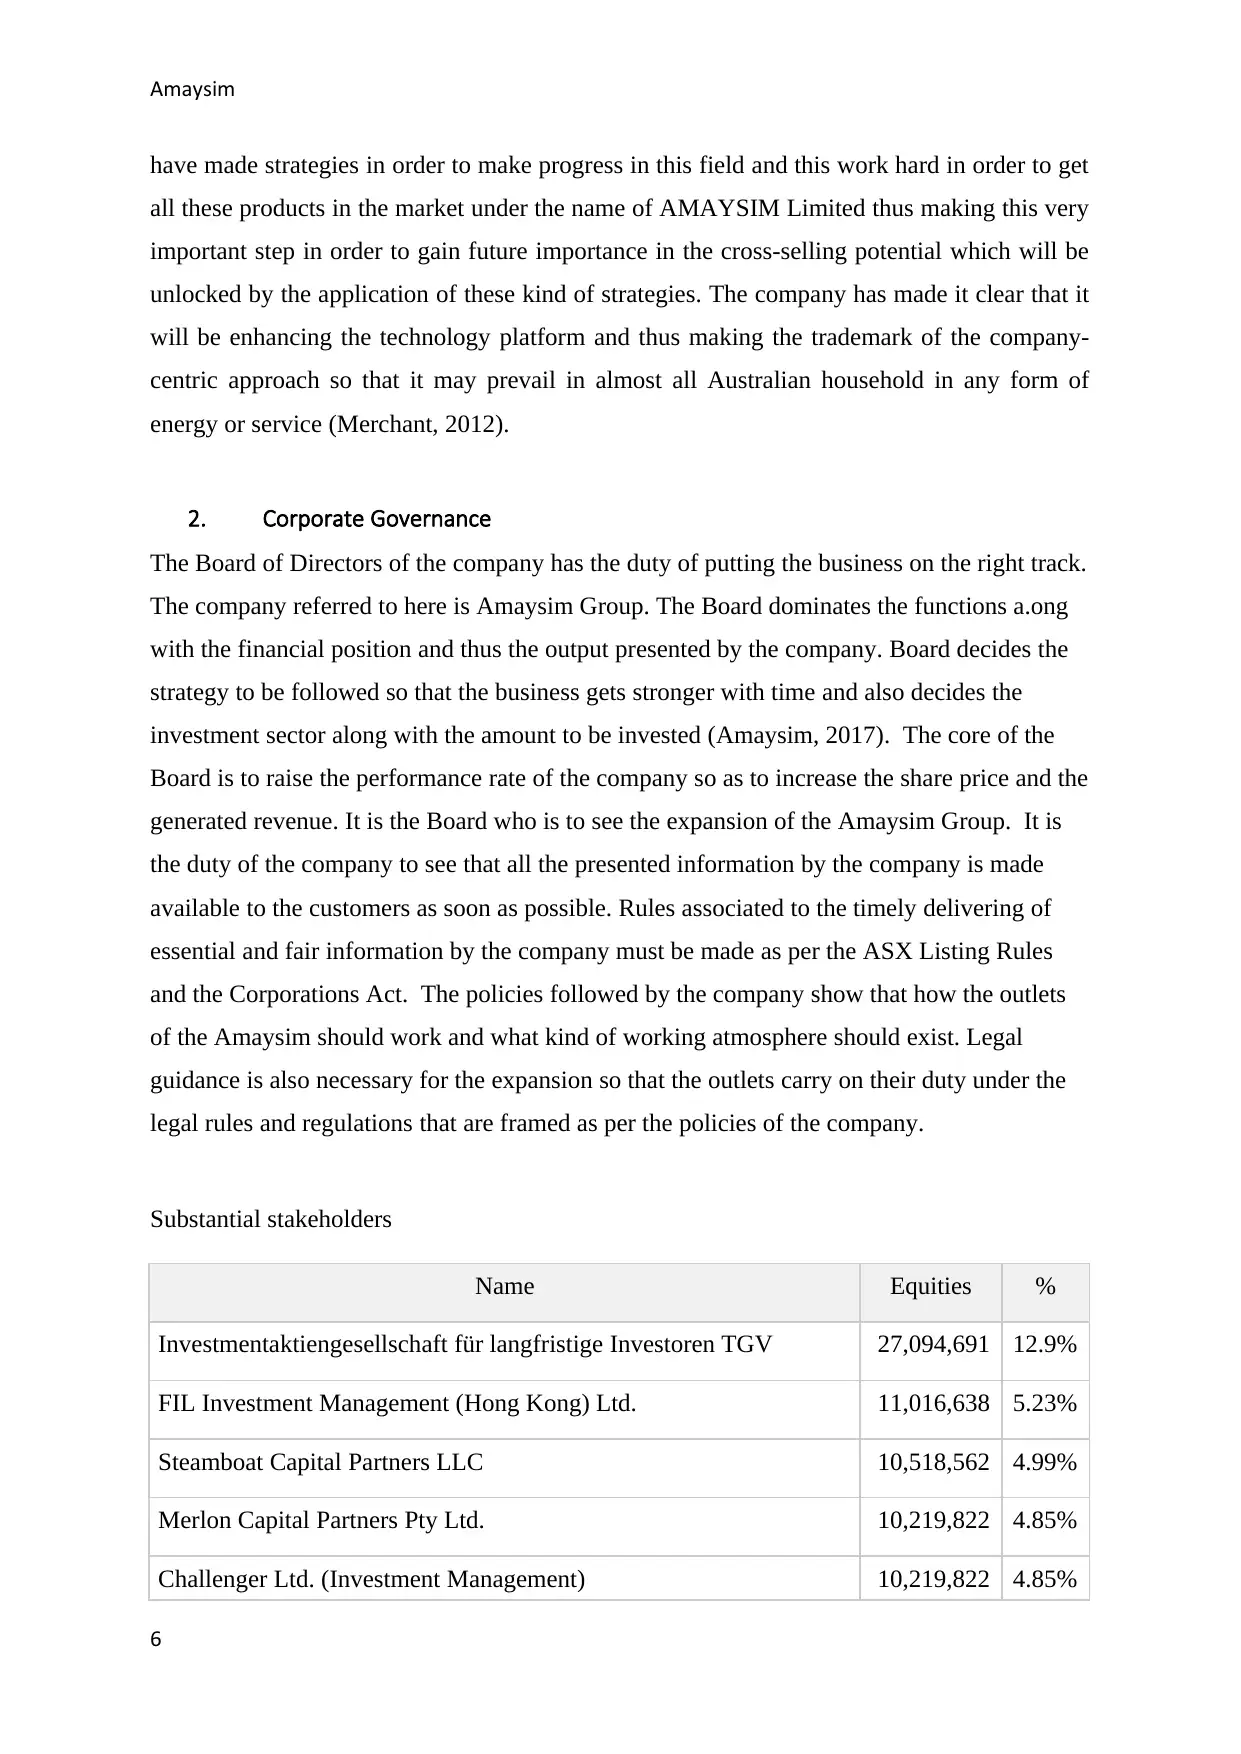
Substantial stakeholders
Name Equities %
Investmentaktiengesellschaft für langfristige Investoren TGV 27,094,691 12.9%
FIL Investment Management (Hong Kong) Ltd. 11,016,638 5.23%
Steamboat Capital Partners LLC 10,518,562 4.99%
Merlon Capital Partners Pty Ltd. 10,219,822 4.85%
Challenger Ltd. (Investment Management) 10,219,822 4.85%
6
have made strategies in order to make progress in this field and this work hard in order to get
all these products in the market under the name of AMAYSIM Limited thus making this very
important step in order to gain future importance in the cross-selling potential which will be
unlocked by the application of these kind of strategies. The company has made it clear that it
will be enhancing the technology platform and thus making the trademark of the company-
centric approach so that it may prevail in almost all Australian household in any form of
energy or service (Merchant, 2012).
2. Corporate Governance
The Board of Directors of the company has the duty of putting the business on the right track.
The company referred to here is Amaysim Group. The Board dominates the functions a.ong
with the financial position and thus the output presented by the company. Board decides the
strategy to be followed so that the business gets stronger with time and also decides the
investment sector along with the amount to be invested (Amaysim, 2017). The core of the
Board is to raise the performance rate of the company so as to increase the share price and the
generated revenue. It is the Board who is to see the expansion of the Amaysim Group. It is
the duty of the company to see that all the presented information by the company is made
available to the customers as soon as possible. Rules associated to the timely delivering of
essential and fair information by the company must be made as per the ASX Listing Rules
and the Corporations Act. The policies followed by the company show that how the outlets
of the Amaysim should work and what kind of working atmosphere should exist. Legal
guidance is also necessary for the expansion so that the outlets carry on their duty under the
legal rules and regulations that are framed as per the policies of the company.
Substantial stakeholders
Name Equities %
Investmentaktiengesellschaft für langfristige Investoren TGV 27,094,691 12.9%
FIL Investment Management (Hong Kong) Ltd. 11,016,638 5.23%
Steamboat Capital Partners LLC 10,518,562 4.99%
Merlon Capital Partners Pty Ltd. 10,219,822 4.85%
Challenger Ltd. (Investment Management) 10,219,822 4.85%
6
⊘ This is a preview!⊘
Do you want full access?
Subscribe today to unlock all pages.
Trusted by 1+ million students worldwide
Amaysim
VP Bank AG (Private Banking) 10,162,583 4.82%
Investors Mutual Ltd. 9,515,156 4.51%
Colonial First State Asset Management (Australia) Ltd. 9,423,658 4.47%
AustralianSuper Pty Ltd. 9,264,873 4.40%
Antares Capital Partners Ltd. 8,761,330 4.16%
Name Board Relationships
Andrew Reitzer 23 Relationships
Julian Ismet Ogrin 7 Relationships
Maria Anne Martin 7 Relationships
Peter J. O'Connell 9 Relationships
Jodie Sangster 5 Relationships
3. Calculation of Performance Ratios
Liquidity ratios
This type of ratios plays a key role when the company wants to analyze the Debt obligations.
It helped the company in order to analyze the type of investment it has which can be created
or turned into cash on a short-term basis. If the analysis of the liquidity ratio states that it is
not up to the mark then the company is not able to provide the debt obligations up to the
period of 1 year which states that the company is ineffective towards liquidity (Ross et. al,
2014). Also, the efficiency ratio plays an important role when the assessment of a company
takes place. This ratio helps to find the effectiveness of the firm and is more or less
equivalent to the liquidity ratio because of the method it uses to calculate the ratio. In the end,
7
Paraphrase This Document
Need a fresh take? Get an instant paraphrase of this document with our AI Paraphraser
Amaysim
it is clear that the management will be unable to use the funds and this will also be restricted
from earning profits (Petty et. al, 2012).
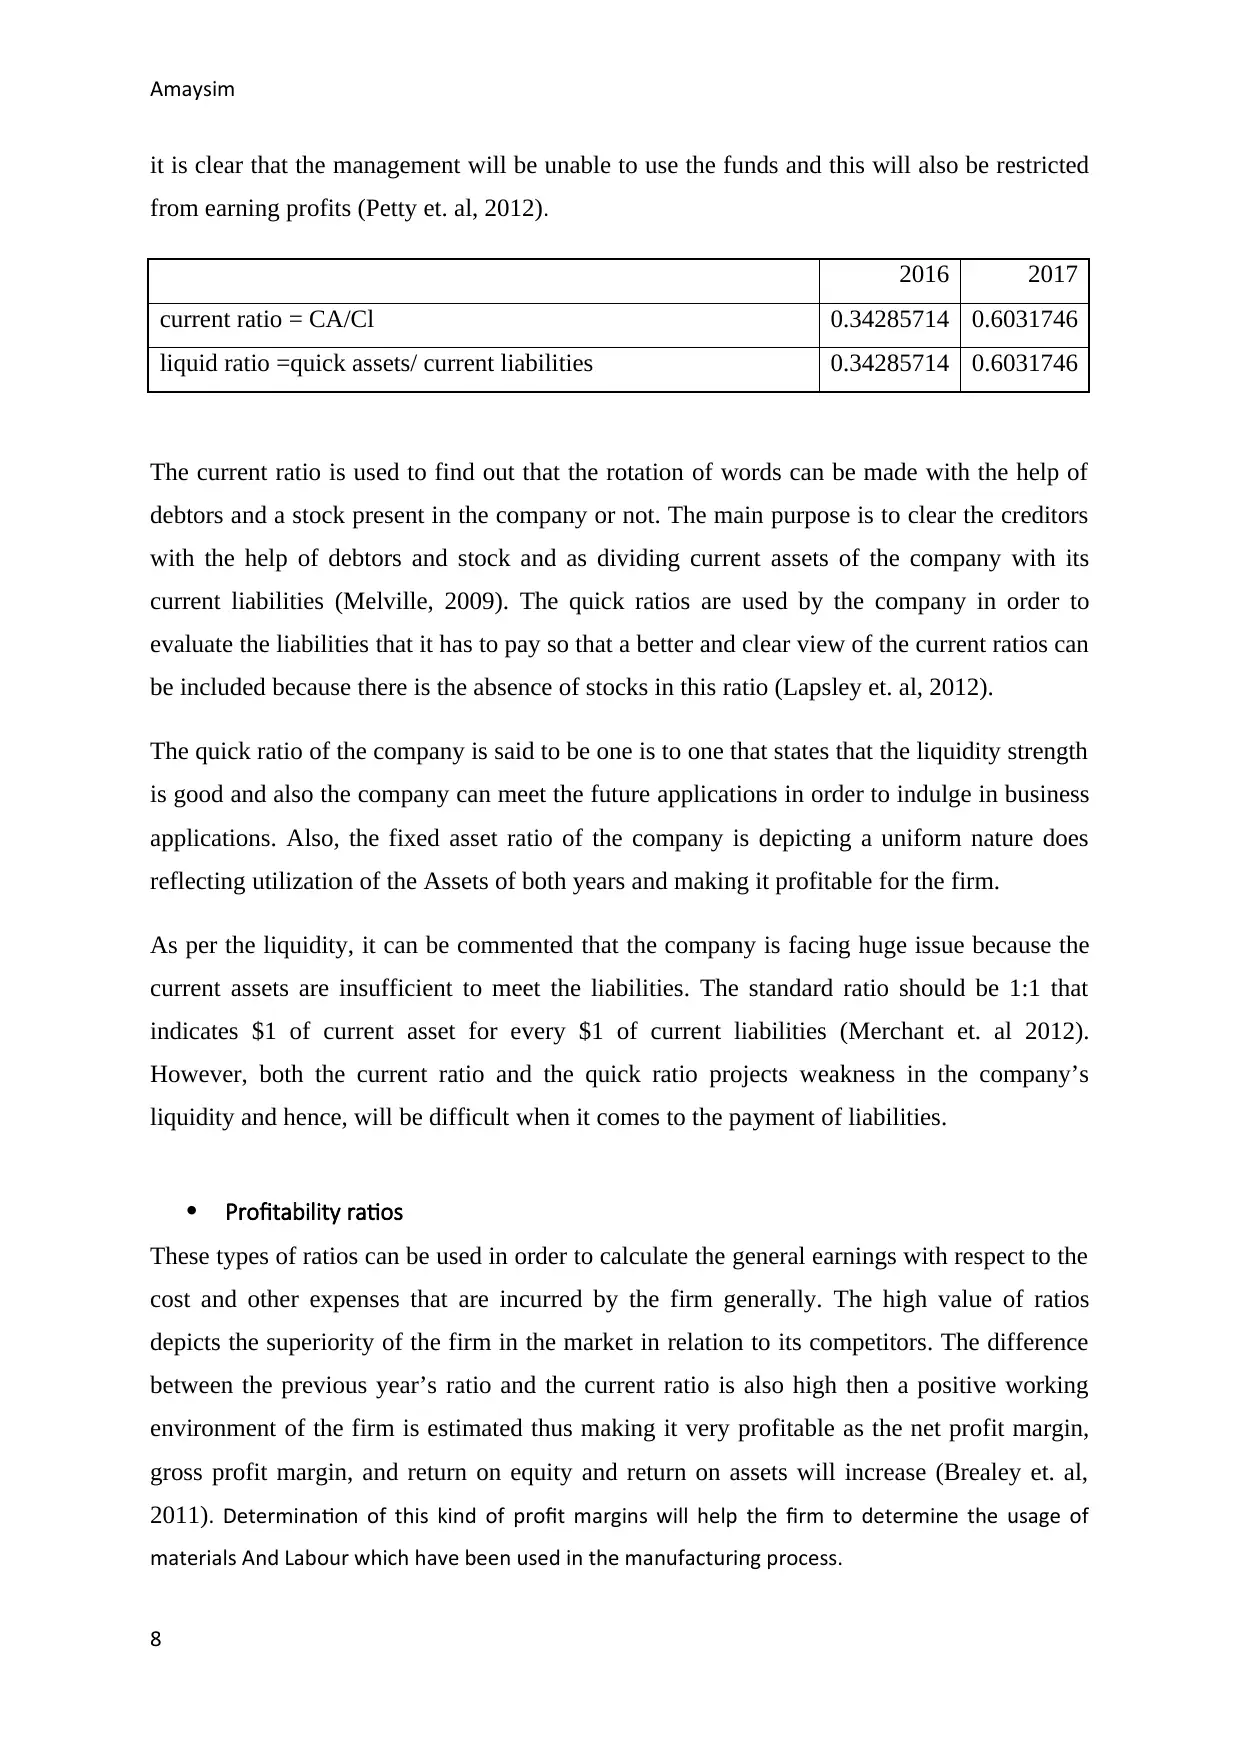
2016 2017
current ratio = CA/Cl 0.34285714 0.6031746
liquid ratio =quick assets/ current liabilities 0.34285714 0.6031746
The current ratio is used to find out that the rotation of words can be made with the help of
debtors and a stock present in the company or not. The main purpose is to clear the creditors
with the help of debtors and stock and as dividing current assets of the company with its
current liabilities (Melville, 2009). The quick ratios are used by the company in order to
evaluate the liabilities that it has to pay so that a better and clear view of the current ratios can
be included because there is the absence of stocks in this ratio (Lapsley et. al, 2012).
The quick ratio of the company is said to be one is to one that states that the liquidity strength
is good and also the company can meet the future applications in order to indulge in business
applications. Also, the fixed asset ratio of the company is depicting a uniform nature does
reflecting utilization of the Assets of both years and making it profitable for the firm.
As per the liquidity, it can be commented that the company is facing huge issue because the
current assets are insufficient to meet the liabilities. The standard ratio should be 1:1 that
indicates $1 of current asset for every $1 of current liabilities (Merchant et. al 2012).
However, both the current ratio and the quick ratio projects weakness in the company’s
liquidity and hence, will be difficult when it comes to the payment of liabilities.
Profitability ratios
These types of ratios can be used in order to calculate the general earnings with respect to the
cost and other expenses that are incurred by the firm generally. The high value of ratios
depicts the superiority of the firm in the market in relation to its competitors. The difference
between the previous year’s ratio and the current ratio is also high then a positive working
environment of the firm is estimated thus making it very profitable as the net profit margin,
gross profit margin, and return on equity and return on assets will increase (Brealey et. al,
2011). Determination of this kind of profit margins will help the firm to determine the usage of
materials And Labour which have been used in the manufacturing process.
8
it is clear that the management will be unable to use the funds and this will also be restricted
from earning profits (Petty et. al, 2012).
2016 2017
current ratio = CA/Cl 0.34285714 0.6031746
liquid ratio =quick assets/ current liabilities 0.34285714 0.6031746
The current ratio is used to find out that the rotation of words can be made with the help of
debtors and a stock present in the company or not. The main purpose is to clear the creditors
with the help of debtors and stock and as dividing current assets of the company with its
current liabilities (Melville, 2009). The quick ratios are used by the company in order to
evaluate the liabilities that it has to pay so that a better and clear view of the current ratios can
be included because there is the absence of stocks in this ratio (Lapsley et. al, 2012).
The quick ratio of the company is said to be one is to one that states that the liquidity strength
is good and also the company can meet the future applications in order to indulge in business
applications. Also, the fixed asset ratio of the company is depicting a uniform nature does
reflecting utilization of the Assets of both years and making it profitable for the firm.
As per the liquidity, it can be commented that the company is facing huge issue because the
current assets are insufficient to meet the liabilities. The standard ratio should be 1:1 that
indicates $1 of current asset for every $1 of current liabilities (Merchant et. al 2012).
However, both the current ratio and the quick ratio projects weakness in the company’s
liquidity and hence, will be difficult when it comes to the payment of liabilities.
Profitability ratios
These types of ratios can be used in order to calculate the general earnings with respect to the
cost and other expenses that are incurred by the firm generally. The high value of ratios
depicts the superiority of the firm in the market in relation to its competitors. The difference
between the previous year’s ratio and the current ratio is also high then a positive working
environment of the firm is estimated thus making it very profitable as the net profit margin,
gross profit margin, and return on equity and return on assets will increase (Brealey et. al,
2011). Determination of this kind of profit margins will help the firm to determine the usage of
materials And Labour which have been used in the manufacturing process.
8
Amaysim
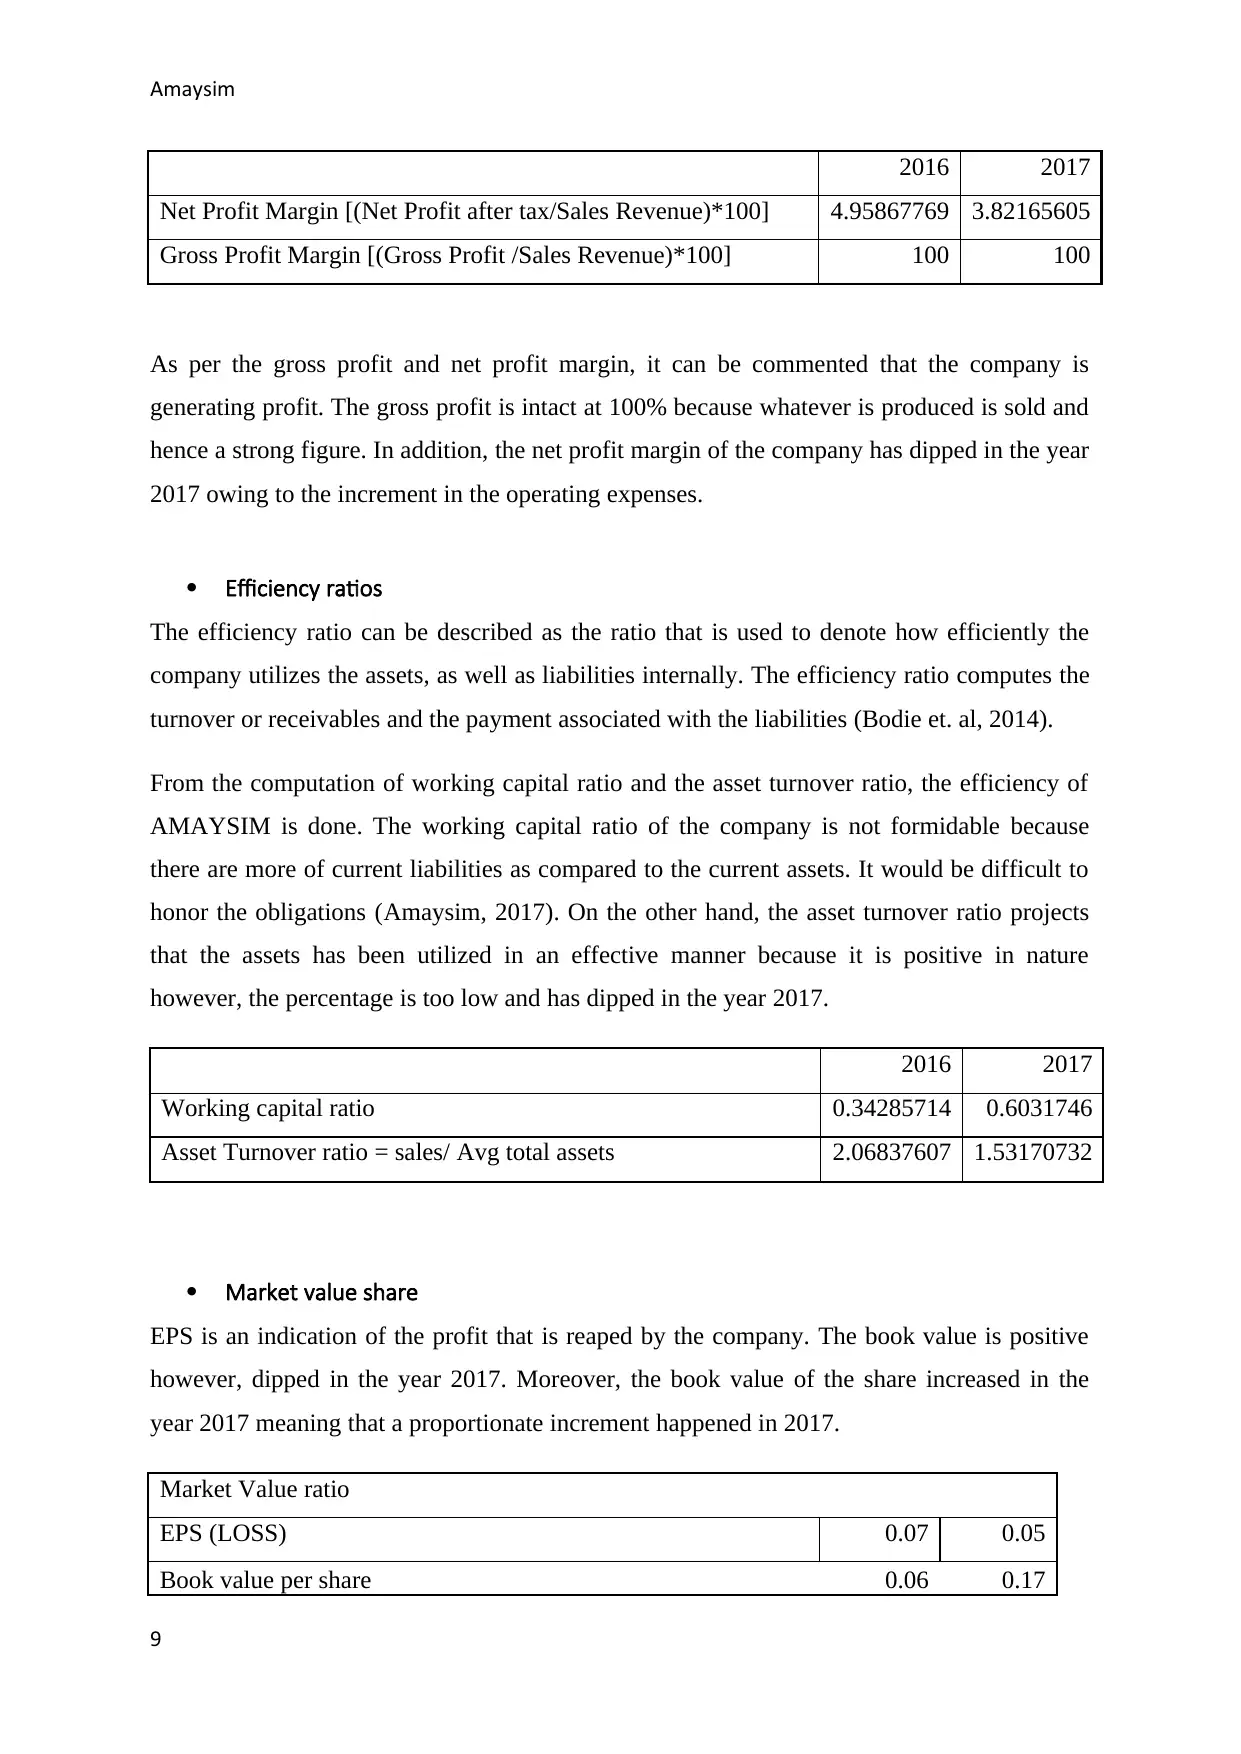
2016 2017
Net Profit Margin [(Net Profit after tax/Sales Revenue)*100] 4.95867769 3.82165605
Gross Profit Margin [(Gross Profit /Sales Revenue)*100] 100 100
As per the gross profit and net profit margin, it can be commented that the company is
generating profit. The gross profit is intact at 100% because whatever is produced is sold and
hence a strong figure. In addition, the net profit margin of the company has dipped in the year
2017 owing to the increment in the operating expenses.
Efficiency ratios
The efficiency ratio can be described as the ratio that is used to denote how efficiently the
company utilizes the assets, as well as liabilities internally. The efficiency ratio computes the
turnover or receivables and the payment associated with the liabilities (Bodie et. al, 2014).
From the computation of working capital ratio and the asset turnover ratio, the efficiency of
AMAYSIM is done. The working capital ratio of the company is not formidable because
there are more of current liabilities as compared to the current assets. It would be difficult to
honor the obligations (Amaysim, 2017). On the other hand, the asset turnover ratio projects
that the assets has been utilized in an effective manner because it is positive in nature
however, the percentage is too low and has dipped in the year 2017.
2016 2017
Working capital ratio 0.34285714 0.6031746
Asset Turnover ratio = sales/ Avg total assets 2.06837607 1.53170732
Market value share
EPS is an indication of the profit that is reaped by the company. The book value is positive
however, dipped in the year 2017. Moreover, the book value of the share increased in the
year 2017 meaning that a proportionate increment happened in 2017.
Market Value ratio
EPS (LOSS) 0.07 0.05
Book value per share 0.06 0.17
9
2016 2017
Net Profit Margin [(Net Profit after tax/Sales Revenue)*100] 4.95867769 3.82165605
Gross Profit Margin [(Gross Profit /Sales Revenue)*100] 100 100
As per the gross profit and net profit margin, it can be commented that the company is
generating profit. The gross profit is intact at 100% because whatever is produced is sold and
hence a strong figure. In addition, the net profit margin of the company has dipped in the year
2017 owing to the increment in the operating expenses.
Efficiency ratios
The efficiency ratio can be described as the ratio that is used to denote how efficiently the
company utilizes the assets, as well as liabilities internally. The efficiency ratio computes the
turnover or receivables and the payment associated with the liabilities (Bodie et. al, 2014).
From the computation of working capital ratio and the asset turnover ratio, the efficiency of
AMAYSIM is done. The working capital ratio of the company is not formidable because
there are more of current liabilities as compared to the current assets. It would be difficult to
honor the obligations (Amaysim, 2017). On the other hand, the asset turnover ratio projects
that the assets has been utilized in an effective manner because it is positive in nature
however, the percentage is too low and has dipped in the year 2017.
2016 2017
Working capital ratio 0.34285714 0.6031746
Asset Turnover ratio = sales/ Avg total assets 2.06837607 1.53170732
Market value share
EPS is an indication of the profit that is reaped by the company. The book value is positive
however, dipped in the year 2017. Moreover, the book value of the share increased in the
year 2017 meaning that a proportionate increment happened in 2017.
Market Value ratio
EPS (LOSS) 0.07 0.05
Book value per share 0.06 0.17
9
⊘ This is a preview!⊘
Do you want full access?
Subscribe today to unlock all pages.
Trusted by 1+ million students worldwide
Amaysim
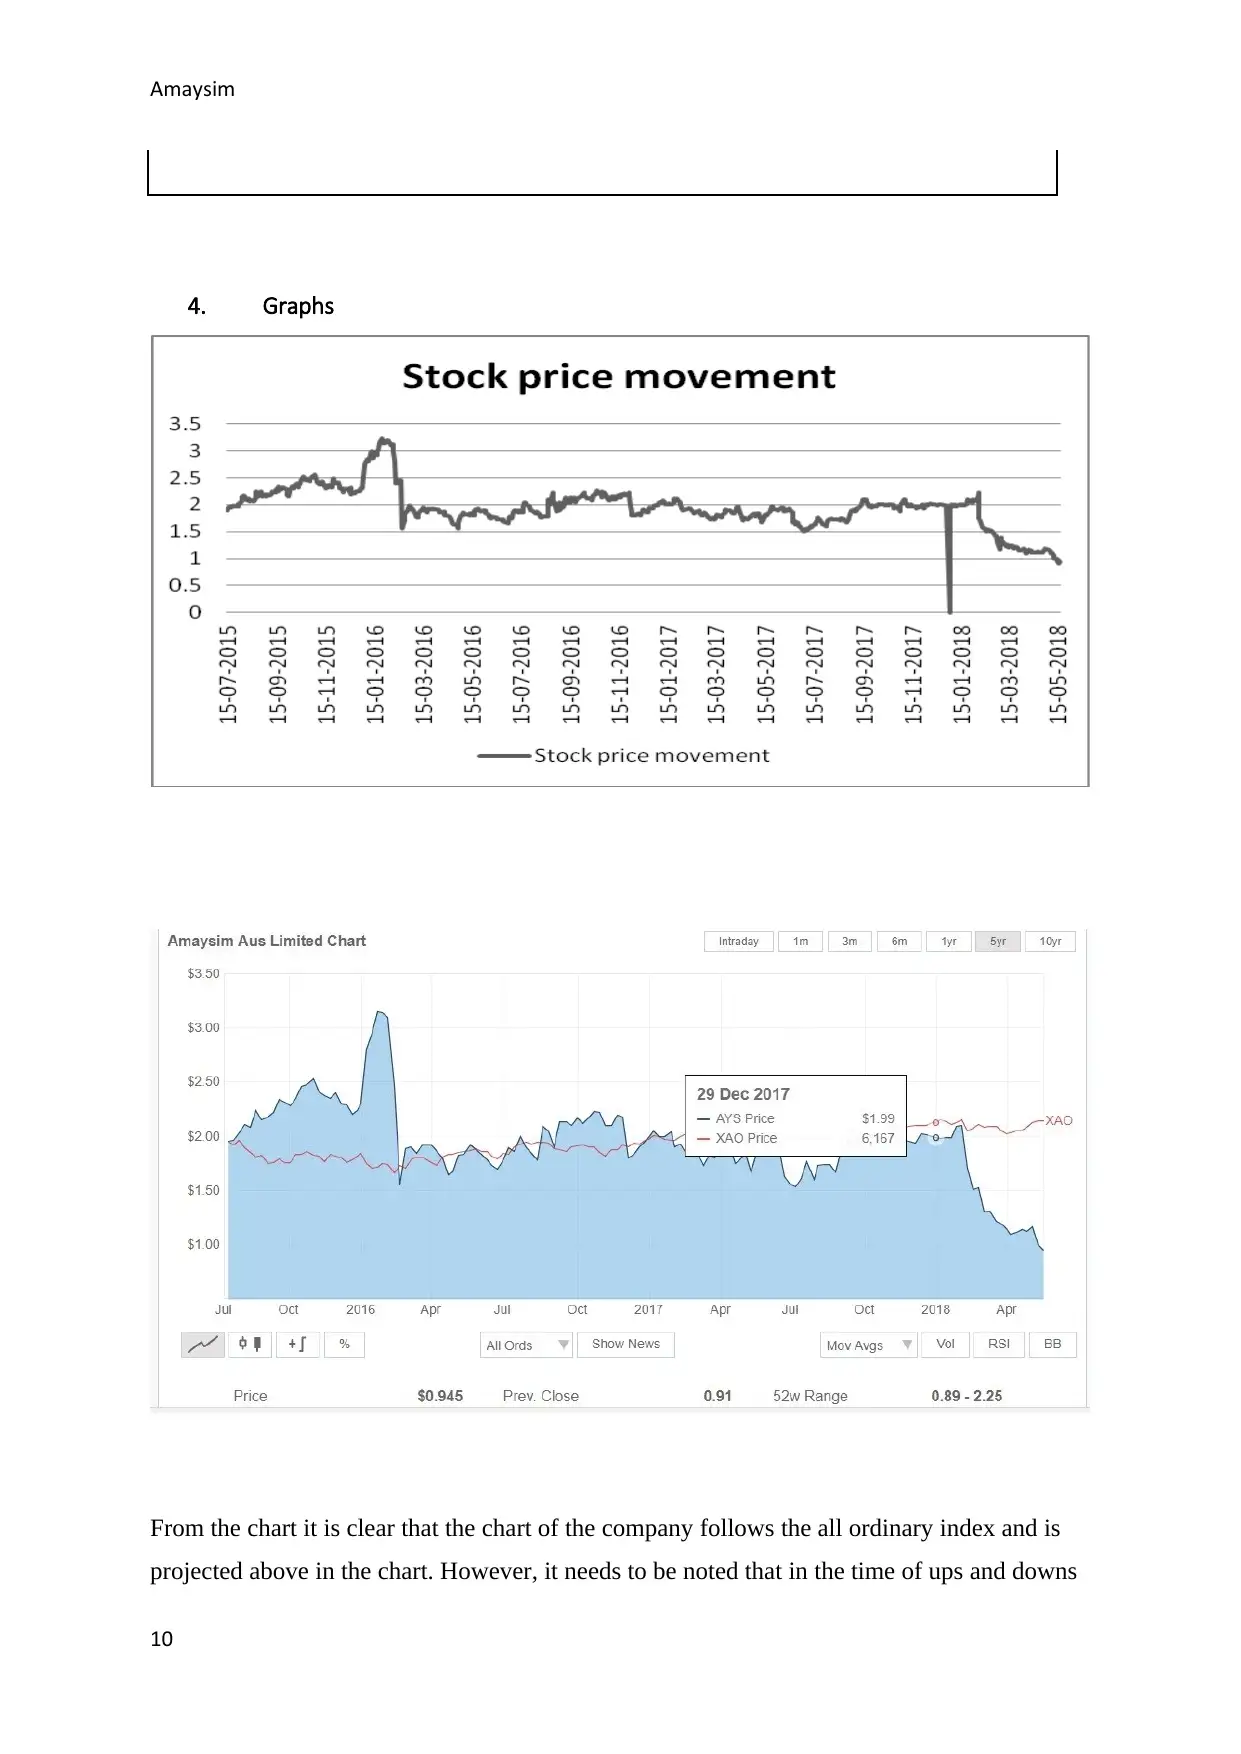
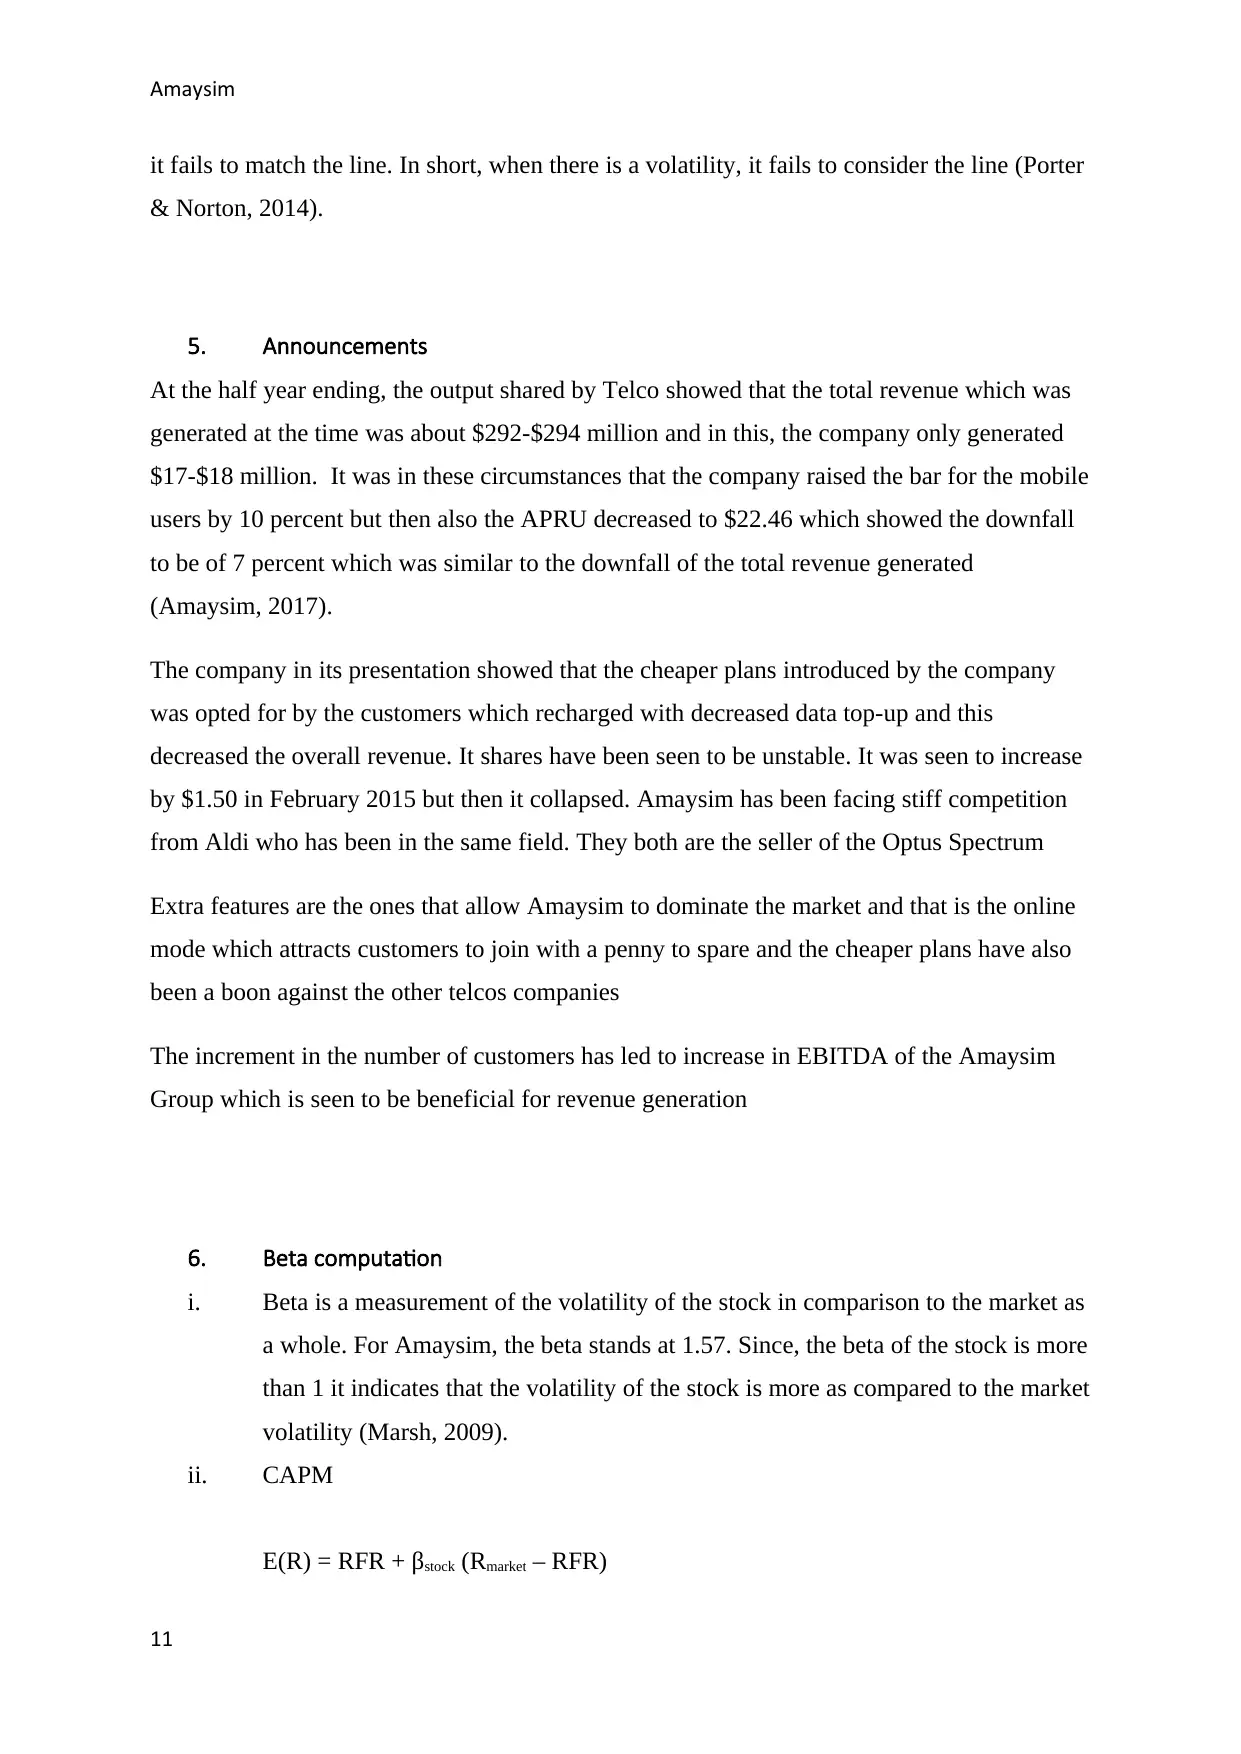
4. Graphs
From the chart it is clear that the chart of the company follows the all ordinary index and is
projected above in the chart. However, it needs to be noted that in the time of ups and downs
10
4. Graphs
From the chart it is clear that the chart of the company follows the all ordinary index and is
projected above in the chart. However, it needs to be noted that in the time of ups and downs
10
Paraphrase This Document
Need a fresh take? Get an instant paraphrase of this document with our AI Paraphraser
Amaysim
it fails to match the line. In short, when there is a volatility, it fails to consider the line (Porter
& Norton, 2014).
5. Announcements
At the half year ending, the output shared by Telco showed that the total revenue which was
generated at the time was about $292-$294 million and in this, the company only generated
$17-$18 million. It was in these circumstances that the company raised the bar for the mobile
users by 10 percent but then also the APRU decreased to $22.46 which showed the downfall
to be of 7 percent which was similar to the downfall of the total revenue generated
(Amaysim, 2017).
The company in its presentation showed that the cheaper plans introduced by the company
was opted for by the customers which recharged with decreased data top-up and this
decreased the overall revenue. It shares have been seen to be unstable. It was seen to increase
by $1.50 in February 2015 but then it collapsed. Amaysim has been facing stiff competition
from Aldi who has been in the same field. They both are the seller of the Optus Spectrum
Extra features are the ones that allow Amaysim to dominate the market and that is the online
mode which attracts customers to join with a penny to spare and the cheaper plans have also
been a boon against the other telcos companies
The increment in the number of customers has led to increase in EBITDA of the Amaysim
Group which is seen to be beneficial for revenue generation
6. Beta computation
i. Beta is a measurement of the volatility of the stock in comparison to the market as
a whole. For Amaysim, the beta stands at 1.57. Since, the beta of the stock is more
than 1 it indicates that the volatility of the stock is more as compared to the market
volatility (Marsh, 2009).
ii. CAPM
E(R) = RFR + βstock (Rmarket – RFR)
11
Amaysim
= 0.04 + 1.57 ( 6-4 )
=3.18
iii. Amaysim cannot be said to be a safe or an investment that is conservative in
nature because the stock has the beta of more than 1 meaning huge volatility will
be faced by the stock in comparison to the market.
WACC
i. Weight of equity = E/ (E+D)
= 76/(76+216)
= 76/292
=0.26
Weight of debt = D/(E+D)
= 216(76+216)
=0.73
Cost of equity = 0.04+ 1.57 * (6-4) = 3.14%
Cost of debt = 787/ = 3.868%
WAC = E(E + D) * Cost of equity + D/ (E+D)* Cot of debt* (1- tax rate)
= 0.26 * 0.031 + 0.73* 360 * (1- 40%)
=0.008 + 157.68
=157.688%
iv. Implications of higher WACC
The increase weighted average cost of capital in relation to a firm's business signifies the
tendency to encounter a loss or risk based on the announcement in the affairs of the
12
⊘ This is a preview!⊘
Do you want full access?
Subscribe today to unlock all pages.
Trusted by 1+ million students worldwide
1 out of 21
Related Documents


Your All-in-One AI-Powered Toolkit for Academic Success.
+13062052269
info@desklib.com
Available 24*7 on WhatsApp / Email
![[object Object]](/_next/static/media/star-bottom.7253800d.svg)
Unlock your academic potential
Copyright © 2020–2026 A2Z Services. All Rights Reserved. Developed and managed by ZUCOL.