Financial Statement Analysis Report: Amazon Inc. Performance
VerifiedAdded on 2022/08/14
|23
|3479
|25
Report
AI Summary
This report provides a detailed financial statement analysis of Amazon Inc., examining its performance from 2014 to 2018. It begins with a background of the company, its role in the international marketplace, and a SWOT analysis, highlighting its strengths, weaknesses, opportunities, and threats. The core of the report focuses on ratio analysis, including liquidity (current, quick, and cash ratios), solvency (debt-equity, total debt, and equity multiplier), activity (inventory turnover, receivables turnover, payables turnover, and total asset turnover), profitability (net profit margin, return on assets, return on equity, and return on capital employed), and market value ratios (price-earnings and gearing ratio). The analysis reveals Amazon's financial health, including its ability to manage short-term obligations, financial leverage, and revenue generation from assets, and concludes with recommendations based on the findings. The report uses financial statements like income statements and balance sheets to conduct the ratio analysis. The analysis also takes into consideration the company's market share and the impact of market competitors. The report helps in determining the financial position of Amazon Inc. and its ability to meet its debt obligations.
Running head: FINANCIAL STATEMENT ANALYSIS
FINANCIAL STATEMENT ANALYSIS
Name of Student
Name of University
Author’s Note
FINANCIAL STATEMENT ANALYSIS
Name of Student
Name of University
Author’s Note
Paraphrase This Document
Need a fresh take? Get an instant paraphrase of this document with our AI Paraphraser
1FINANCIAL STATEMENT ANALYSIS
Table of Contents
BACKGROUND OF THE COMPANY:............................................................................3
ROLE OF AMAZON INC. IN INTERNATIONAL MARKETPLACE:...........................3
MARKET COMPETITOR:.................................................................................................3
SWOT ANALYSIS:............................................................................................................4
Strength:...........................................................................................................................5
Weakness:........................................................................................................................5
Opportunity:.....................................................................................................................5
Threat:..............................................................................................................................5
FINANCIAL STATEMENT ANALYSIS:.........................................................................5
Liquidity Ratio:................................................................................................................6
Current Ratio:..............................................................................................................6
Quick Ratio:.................................................................................................................7
Cash Ratio:...................................................................................................................8
Solvency Ratio:................................................................................................................9
Debt Equity Ratio:.......................................................................................................9
Total Debt Ratio:.......................................................................................................10
Equity Multiplier:......................................................................................................11
Activity Ratio:...............................................................................................................12
Inventory Turnover Ratio:.........................................................................................12
2FINANCIAL STATEMENT ANALYSIS
Receivables Turnover:...............................................................................................13
Payables Turnover:....................................................................................................14
Total Asset Turnover:................................................................................................15
Profitability Ratio:.........................................................................................................16
Net Profit Margin Ratio:............................................................................................16
Return on Asset:........................................................................................................17
Return on Equity:.......................................................................................................18
Return on Capital Employed:........................................................................................18
Market Value Ratios:.....................................................................................................19
Price Earnings Ratio:.................................................................................................19
Gearing Ratio:................................................................................................................20
CONCLUSIONS:..............................................................................................................21
RECOMMENDATION:....................................................................................................21
REFERENCES:.................................................................................................................23
APPENDIXES:..................................................................................................................24
⊘ This is a preview!⊘
Do you want full access?
Subscribe today to unlock all pages.
Trusted by 1+ million students worldwide
3FINANCIAL STATEMENT ANALYSIS
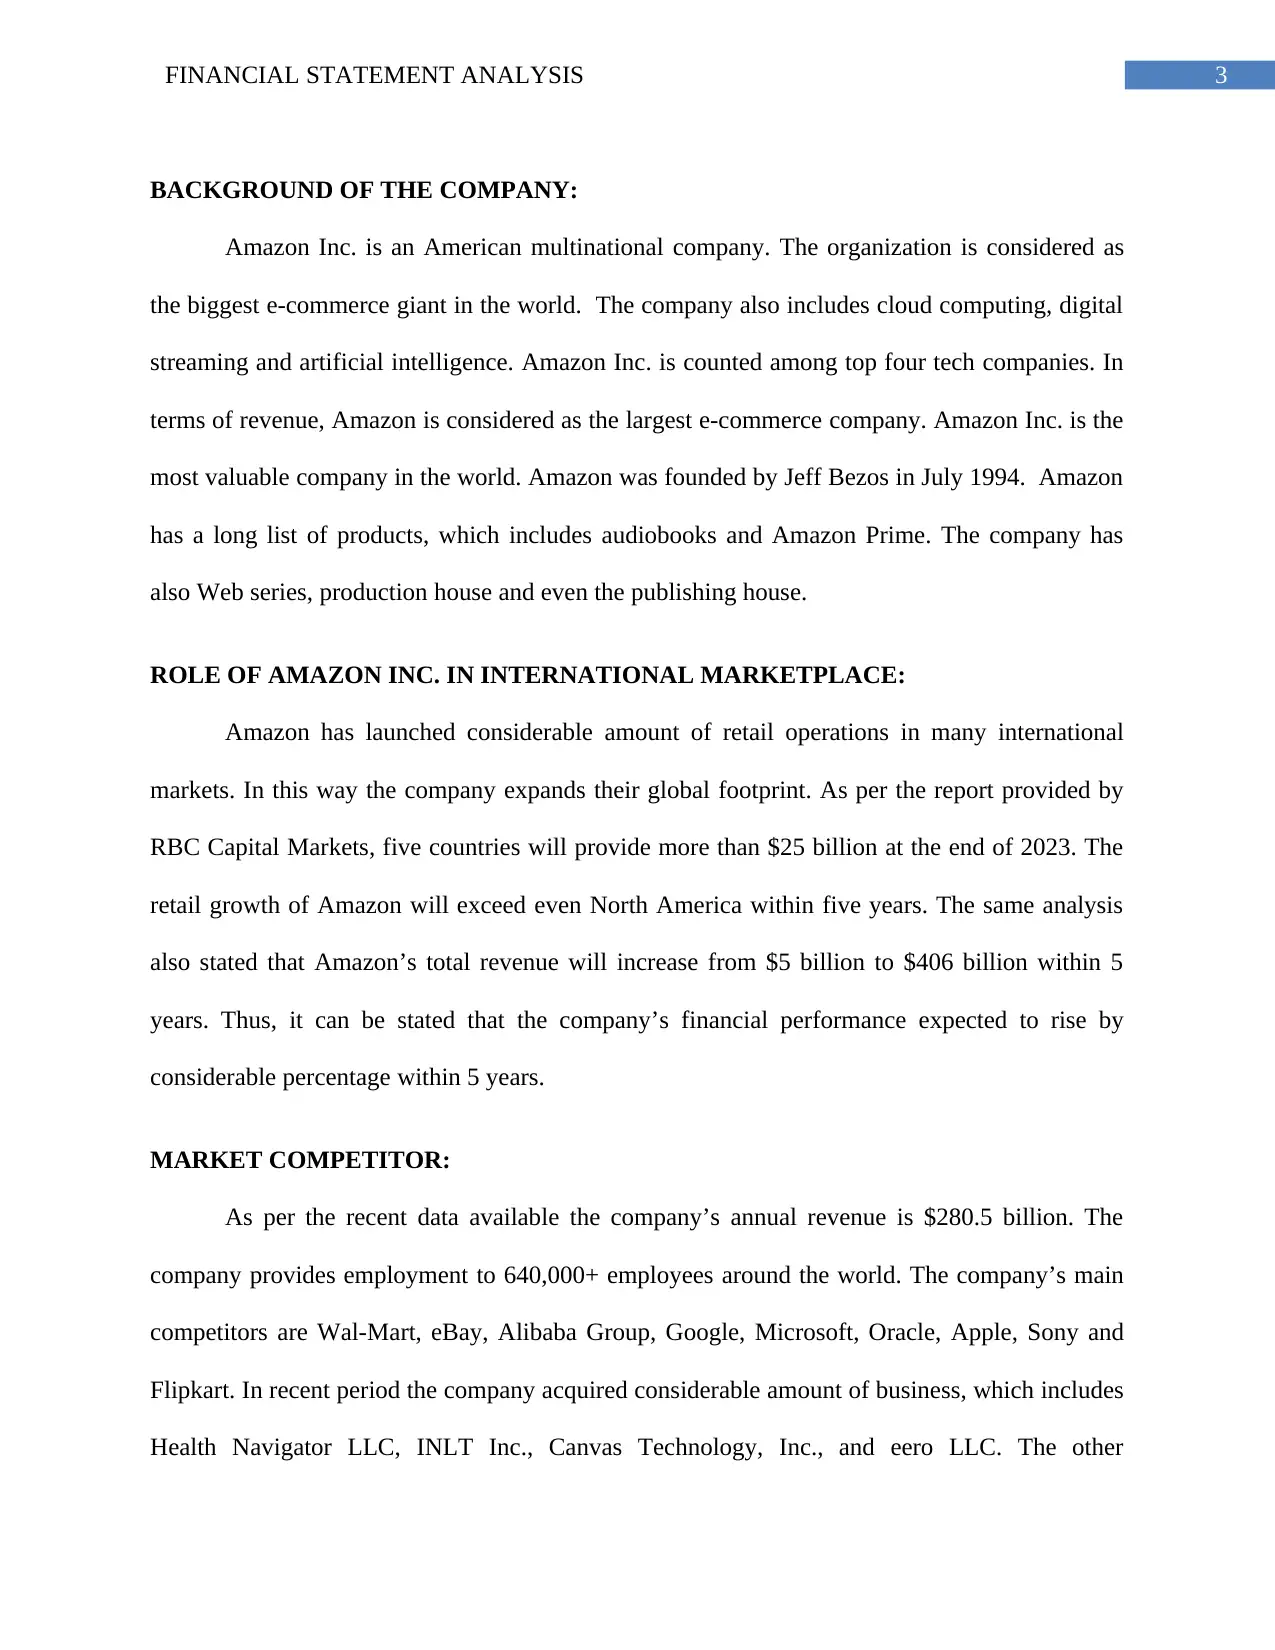
BACKGROUND OF THE COMPANY:
Amazon Inc. is an American multinational company. The organization is considered as
the biggest e-commerce giant in the world. The company also includes cloud computing, digital
streaming and artificial intelligence. Amazon Inc. is counted among top four tech companies. In
terms of revenue, Amazon is considered as the largest e-commerce company. Amazon Inc. is the
most valuable company in the world. Amazon was founded by Jeff Bezos in July 1994. Amazon
has a long list of products, which includes audiobooks and Amazon Prime. The company has
also Web series, production house and even the publishing house.
ROLE OF AMAZON INC. IN INTERNATIONAL MARKETPLACE:
Amazon has launched considerable amount of retail operations in many international
markets. In this way the company expands their global footprint. As per the report provided by
RBC Capital Markets, five countries will provide more than $25 billion at the end of 2023. The
retail growth of Amazon will exceed even North America within five years. The same analysis
also stated that Amazon’s total revenue will increase from $5 billion to $406 billion within 5
years. Thus, it can be stated that the company’s financial performance expected to rise by
considerable percentage within 5 years.
MARKET COMPETITOR:
As per the recent data available the company’s annual revenue is $280.5 billion. The
company provides employment to 640,000+ employees around the world. The company’s main
competitors are Wal-Mart, eBay, Alibaba Group, Google, Microsoft, Oracle, Apple, Sony and
Flipkart. In recent period the company acquired considerable amount of business, which includes
Health Navigator LLC, INLT Inc., Canvas Technology, Inc., and eero LLC. The other
Paraphrase This Document
Need a fresh take? Get an instant paraphrase of this document with our AI Paraphraser
4FINANCIAL STATEMENT ANALYSIS
competitor of Amazon includes all physical stores present in various parts of the world. The
proper managing of funds and proper decision making assists the company to gain considerable
amount of revenue, which increases the financial health of the company. As per the market
analysis Amazon holds 78%, eBay holds 10%, Apple holds 6%, Wal-Mart holds 6% in e-
commerce market.
MARKET ANALYSIS OF E-COMMERCE
INDUSTRY (2018)
SWOT ANALYSIS:
STRENGTH
1. Strong Brand
2. High business diversification
3. Capability to develop themselves
OPPURTUNITY
1. Expansions in developing markets
2. New partnerships with other firms
5FINANCIAL STATEMENT ANALYSIS
according to the trend
WEAKNESS
1. Limited business model
2. Limited penetration in markets
THREAT
1. Aggressive competition in industry
2. Increase the rate of cybercrime
3. World recession
Strength:
It can be observed that the net profit ratio of the company is at par, which on the other
hand, increases the financial health of the company. The better financial performance of the
company increases the brand value of the company and high diversification of the company.
Weakness:
Due to the high percentage of debt the company faces some serious problems, Due to this
the company have limited penetration in the market.
Opportunity:
As per the analysis it can be determined that the company have high asset turnover ratio,
which will actually assists the company to develop more and can enter into new agreement.
Threat:
Due to the high competition in the market the company losses considerable amount of
customers that may affect the company’s financial health in future.
FINANCIAL STATEMENT ANALYSIS:
The financial position of Amazon Inc. is considered after determining the annual report
of 2018, 2017, 2016, 2015 and 2014. The ratio analysis is being used to determine and
⊘ This is a preview!⊘
Do you want full access?
Subscribe today to unlock all pages.
Trusted by 1+ million students worldwide
6FINANCIAL STATEMENT ANALYSIS
differentiate the financial health of Amazon Inc. As per the financial statements of the company,
total current asset of the company has increased by 42% within 5 years period. The total current
assets of the company is high than the total current liabilities of the company (Nepstad, Daniel, et
al. 2014). It can also be seen that the total revenue of the company has increased by 38% within
5 years period. This shows that the company’s financial position has increased by considerable
means within 5 years. The ratio analysis based on the financial statements like income statement
and balance sheet of the company being conducted. The market share of Amazon Inc. considered
while performing the ratio analysis. To conduct the ratio analysis liquidity ratio, solvency ratio,
activity ratio, profitability ratio and market position analysis has been considered.
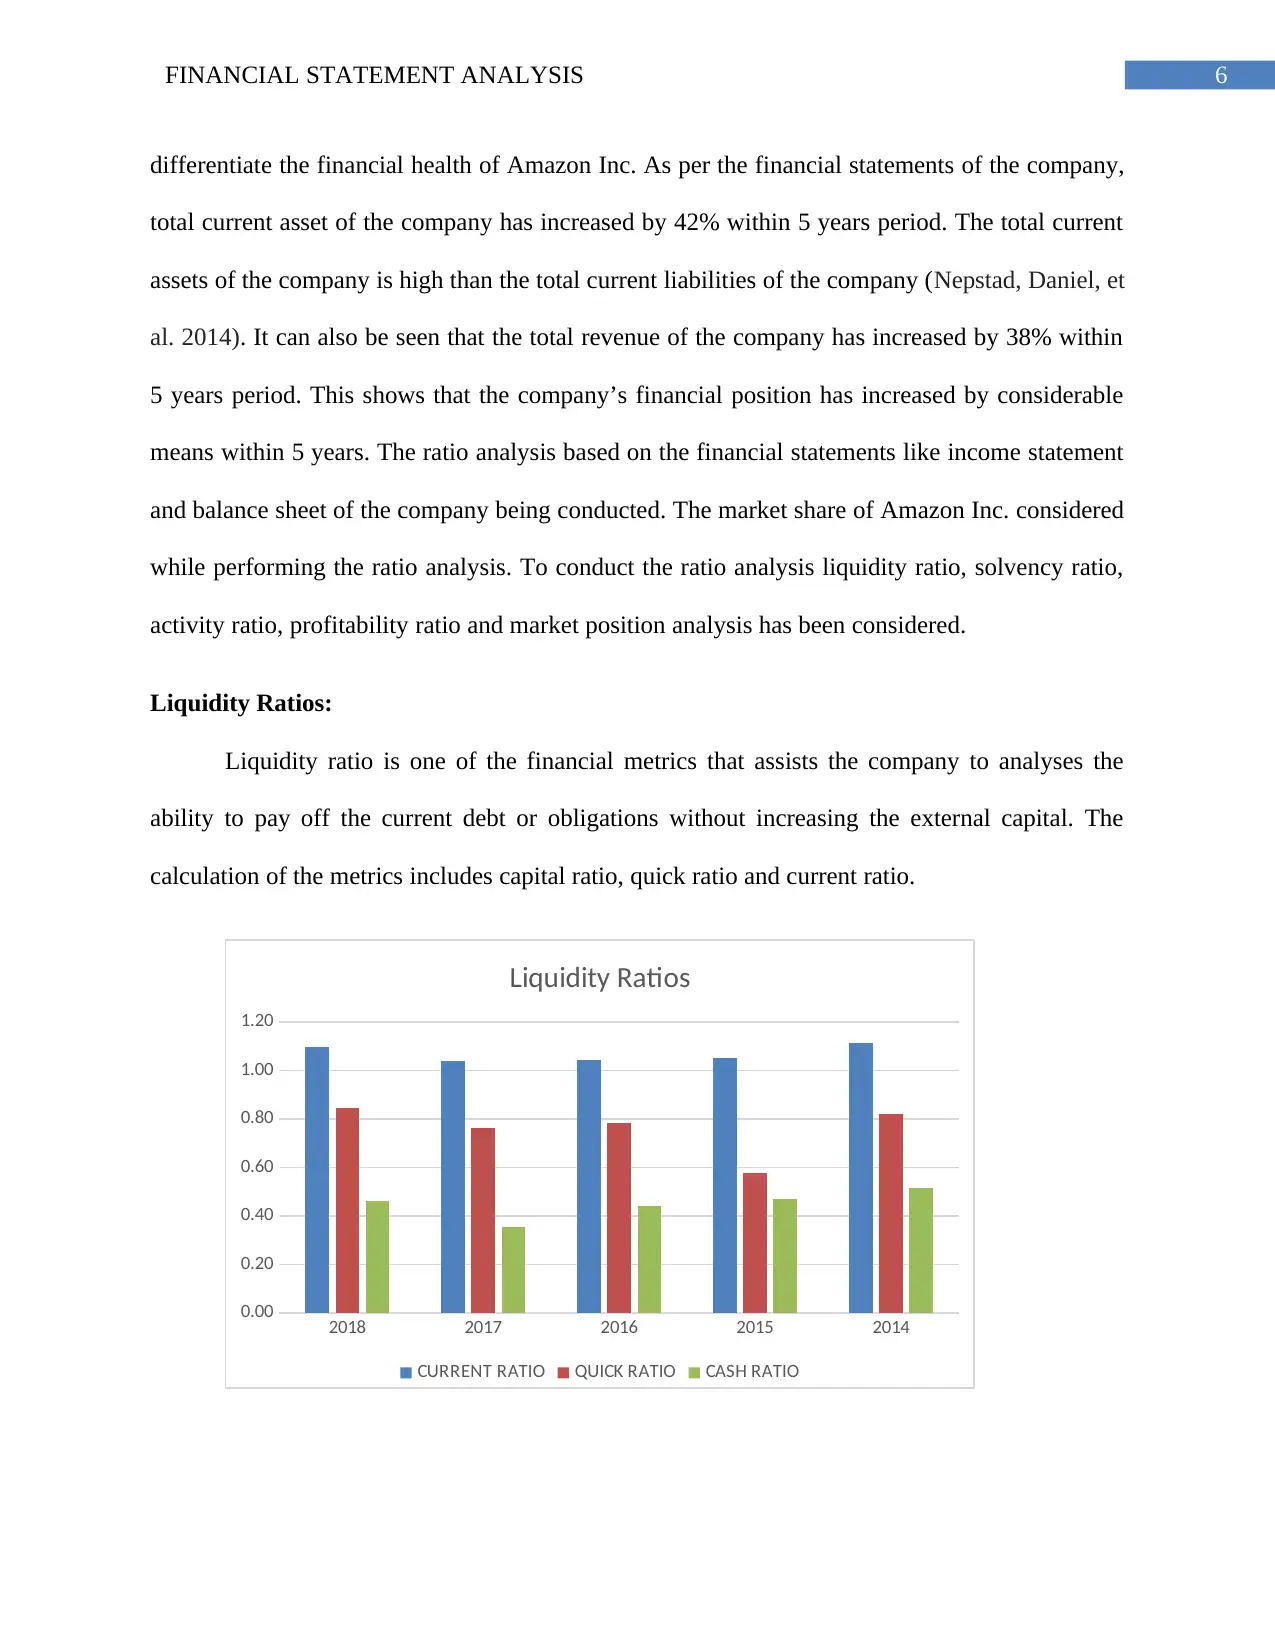
Liquidity Ratios:
Liquidity ratio is one of the financial metrics that assists the company to analyses the
ability to pay off the current debt or obligations without increasing the external capital. The
calculation of the metrics includes capital ratio, quick ratio and current ratio.
2018 2017 2016 2015 2014
0.00
0.20
0.40
0.60
0.80
1.00
1.20
Liquidity Ratios
CURRENT RATIO QUICK RATIO CASH RATIO
differentiate the financial health of Amazon Inc. As per the financial statements of the company,
total current asset of the company has increased by 42% within 5 years period. The total current
assets of the company is high than the total current liabilities of the company (Nepstad, Daniel, et
al. 2014). It can also be seen that the total revenue of the company has increased by 38% within
5 years period. This shows that the company’s financial position has increased by considerable
means within 5 years. The ratio analysis based on the financial statements like income statement
and balance sheet of the company being conducted. The market share of Amazon Inc. considered
while performing the ratio analysis. To conduct the ratio analysis liquidity ratio, solvency ratio,
activity ratio, profitability ratio and market position analysis has been considered.
Liquidity Ratios:
Liquidity ratio is one of the financial metrics that assists the company to analyses the
ability to pay off the current debt or obligations without increasing the external capital. The
calculation of the metrics includes capital ratio, quick ratio and current ratio.
2018 2017 2016 2015 2014
0.00
0.20
0.40
0.60
0.80
1.00
1.20
Liquidity Ratios
CURRENT RATIO QUICK RATIO CASH RATIO
Paraphrase This Document
Need a fresh take? Get an instant paraphrase of this document with our AI Paraphraser
7FINANCIAL STATEMENT ANALYSIS
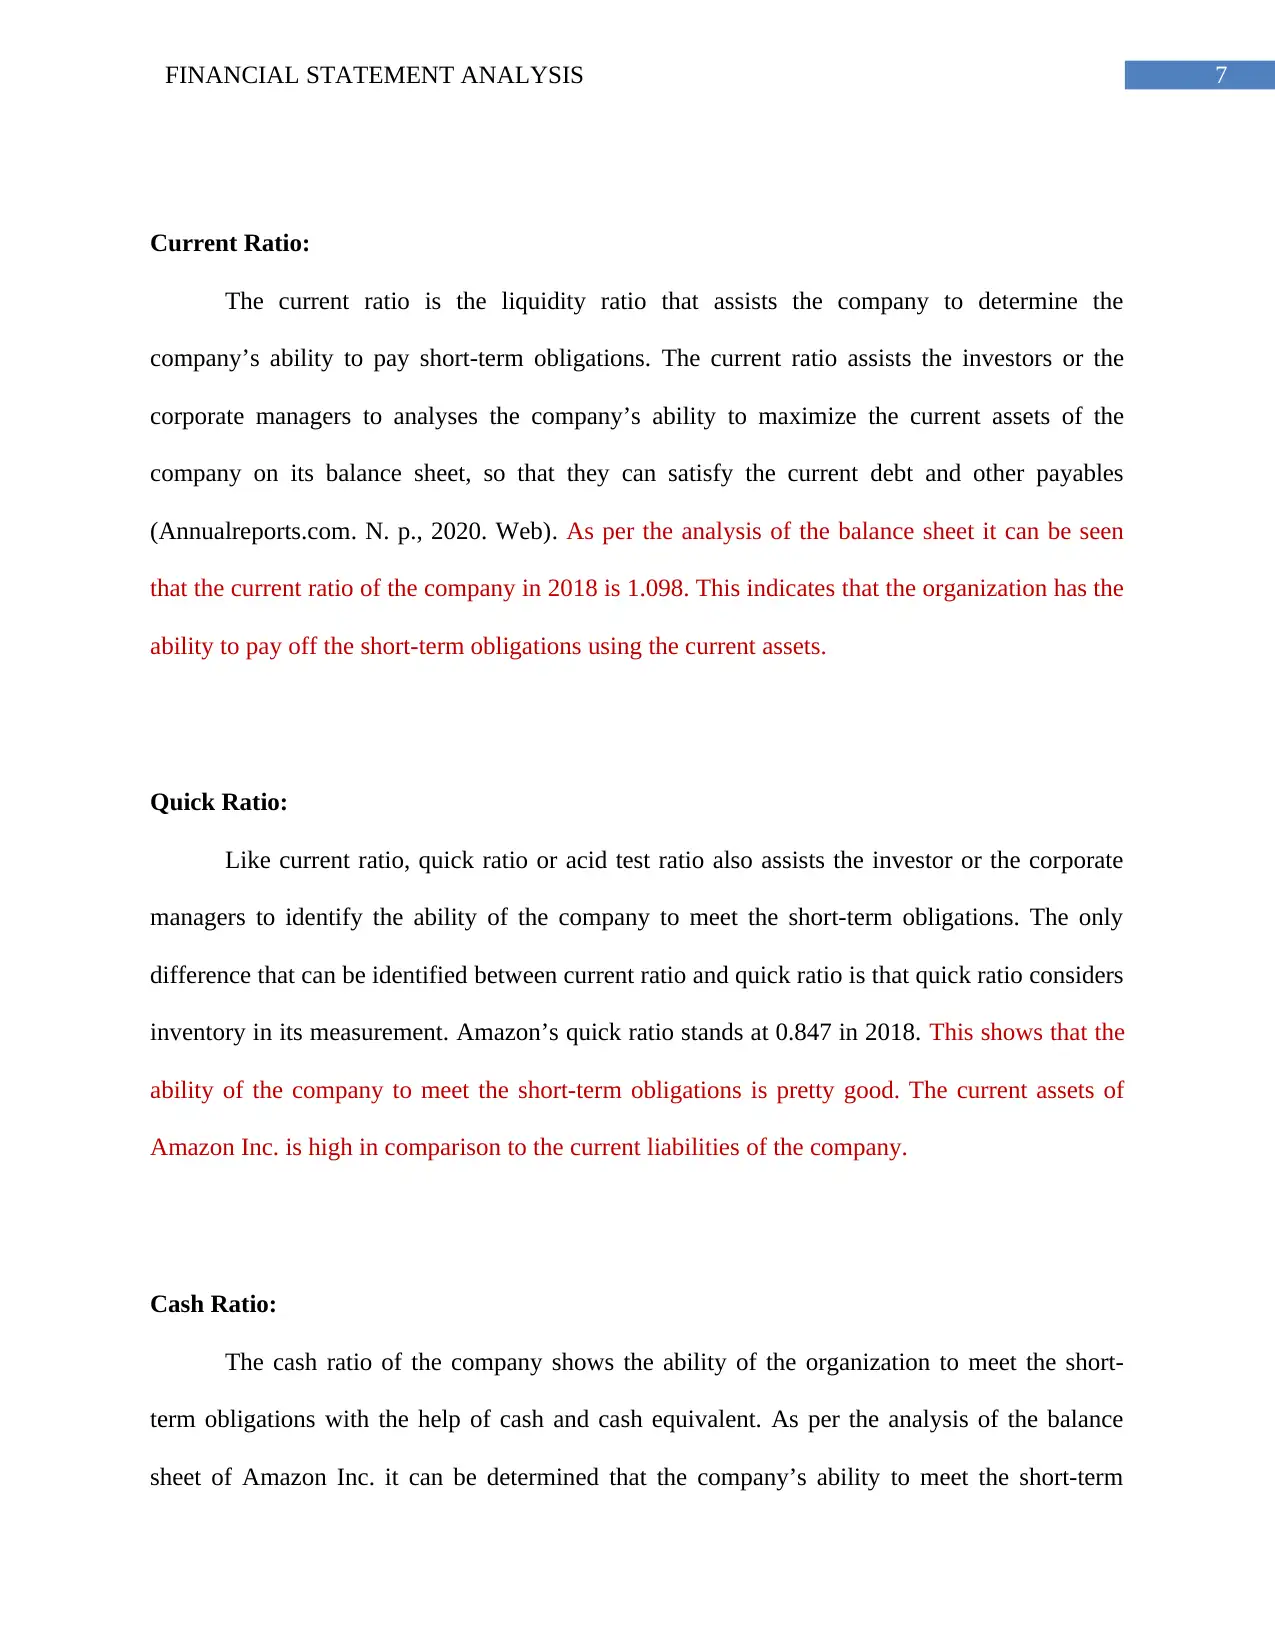
Current Ratio:
The current ratio is the liquidity ratio that assists the company to determine the
company’s ability to pay short-term obligations. The current ratio assists the investors or the
corporate managers to analyses the company’s ability to maximize the current assets of the
company on its balance sheet, so that they can satisfy the current debt and other payables
(Annualreports.com. N. p., 2020. Web). As per the analysis of the balance sheet it can be seen
that the current ratio of the company in 2018 is 1.098. This indicates that the organization has the
ability to pay off the short-term obligations using the current assets.
Quick Ratio:
Like current ratio, quick ratio or acid test ratio also assists the investor or the corporate
managers to identify the ability of the company to meet the short-term obligations. The only
difference that can be identified between current ratio and quick ratio is that quick ratio considers
inventory in its measurement. Amazon’s quick ratio stands at 0.847 in 2018. This shows that the
ability of the company to meet the short-term obligations is pretty good. The current assets of
Amazon Inc. is high in comparison to the current liabilities of the company.
Cash Ratio:
The cash ratio of the company shows the ability of the organization to meet the short-
term obligations with the help of cash and cash equivalent. As per the analysis of the balance
sheet of Amazon Inc. it can be determined that the company’s ability to meet the short-term
8FINANCIAL STATEMENT ANALYSIS
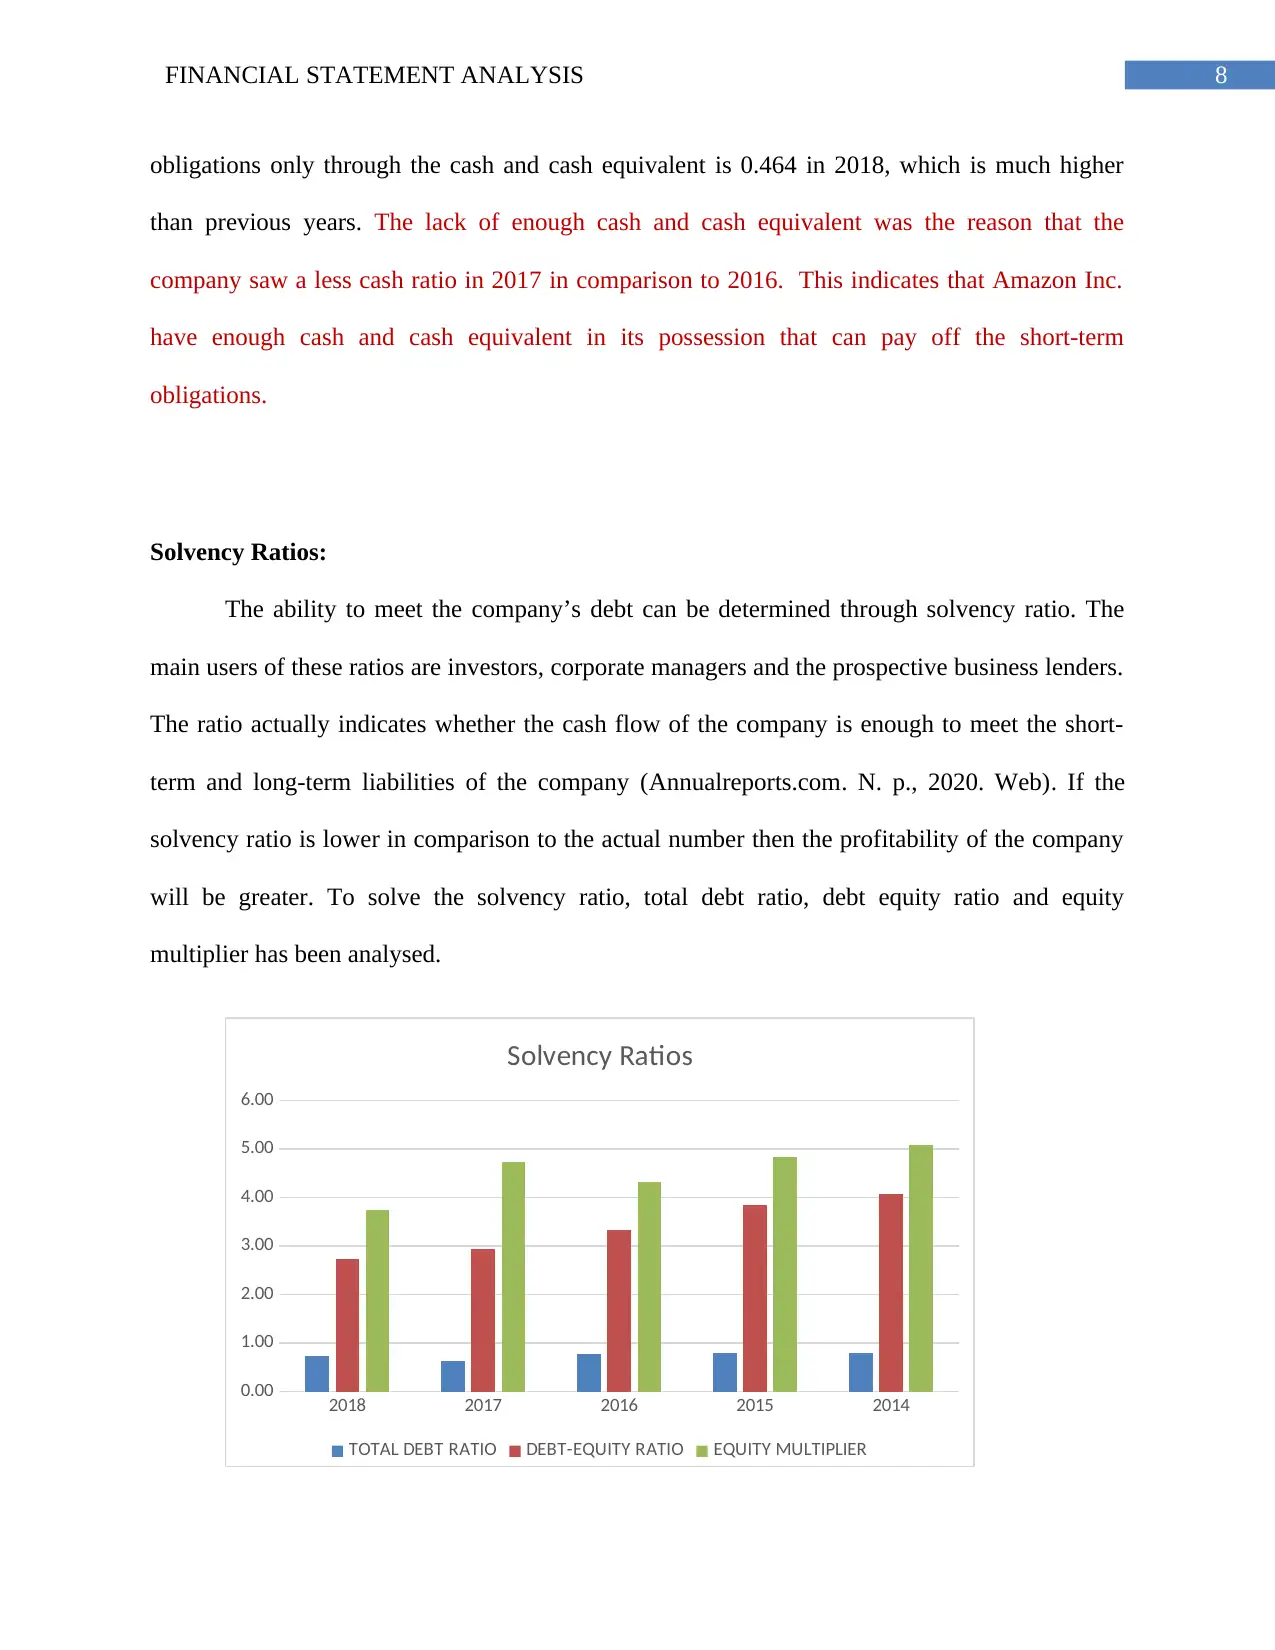
obligations only through the cash and cash equivalent is 0.464 in 2018, which is much higher
than previous years. The lack of enough cash and cash equivalent was the reason that the
company saw a less cash ratio in 2017 in comparison to 2016. This indicates that Amazon Inc.
have enough cash and cash equivalent in its possession that can pay off the short-term
obligations.
Solvency Ratios:
The ability to meet the company’s debt can be determined through solvency ratio. The
main users of these ratios are investors, corporate managers and the prospective business lenders.
The ratio actually indicates whether the cash flow of the company is enough to meet the short-
term and long-term liabilities of the company (Annualreports.com. N. p., 2020. Web). If the
solvency ratio is lower in comparison to the actual number then the profitability of the company
will be greater. To solve the solvency ratio, total debt ratio, debt equity ratio and equity
multiplier has been analysed.
2018 2017 2016 2015 2014
0.00
1.00
2.00
3.00
4.00
5.00
6.00
Solvency Ratios
TOTAL DEBT RATIO DEBT-EQUITY RATIO EQUITY MULTIPLIER
⊘ This is a preview!⊘
Do you want full access?
Subscribe today to unlock all pages.
Trusted by 1+ million students worldwide
9FINANCIAL STATEMENT ANALYSIS
Debt Equity Ratio:
This ratio is used by the investors and corporate managers of the company to determine
the company’s financial leverage. The debt ratio assists the company managers or the investors
to calculate the number of equity that the company holds in comparison to the outstanding debt
of the company. As per the analysis it can be determined that the debt-equity ratio is 2.735 in
2018. This indicates that company’s equity cannot cover the debt or financial leverage of the
company.
Total Debt Ratio:
Debt ratio indicates the company’s extent of financial leverage. The total debt ratio can
also be understood as the part of the company’s assets that are mainly financed by debt. The debt
ratio of the company stands at 0.732, which shows that the company’s debt is higher in
comparison to the asset.
Equity Multiplier:
Equity Multiplier ratio is the financial leverage ratio that calculates the part of the assets
of the company that are mainly funded by the shareholder’s equity. This indicates the debt
proportion of the company is increasing in comparison to the total assets of the company. The
equity multiplier of Amazon Inc. is 3.735 in 2018. As per the analysis equity multiplier of the
company is on increasing terms and hence the company’s financial performance is not on the
good terms (Annualreports.com. N. p., 2020. Web). Thus, the financial leverage of the company
Paraphrase This Document
Need a fresh take? Get an instant paraphrase of this document with our AI Paraphraser
10FINANCIAL STATEMENT ANALYSIS
needs to be checked, so that the company’s financial position becomes stable and the total assets
can cover up all the debts.
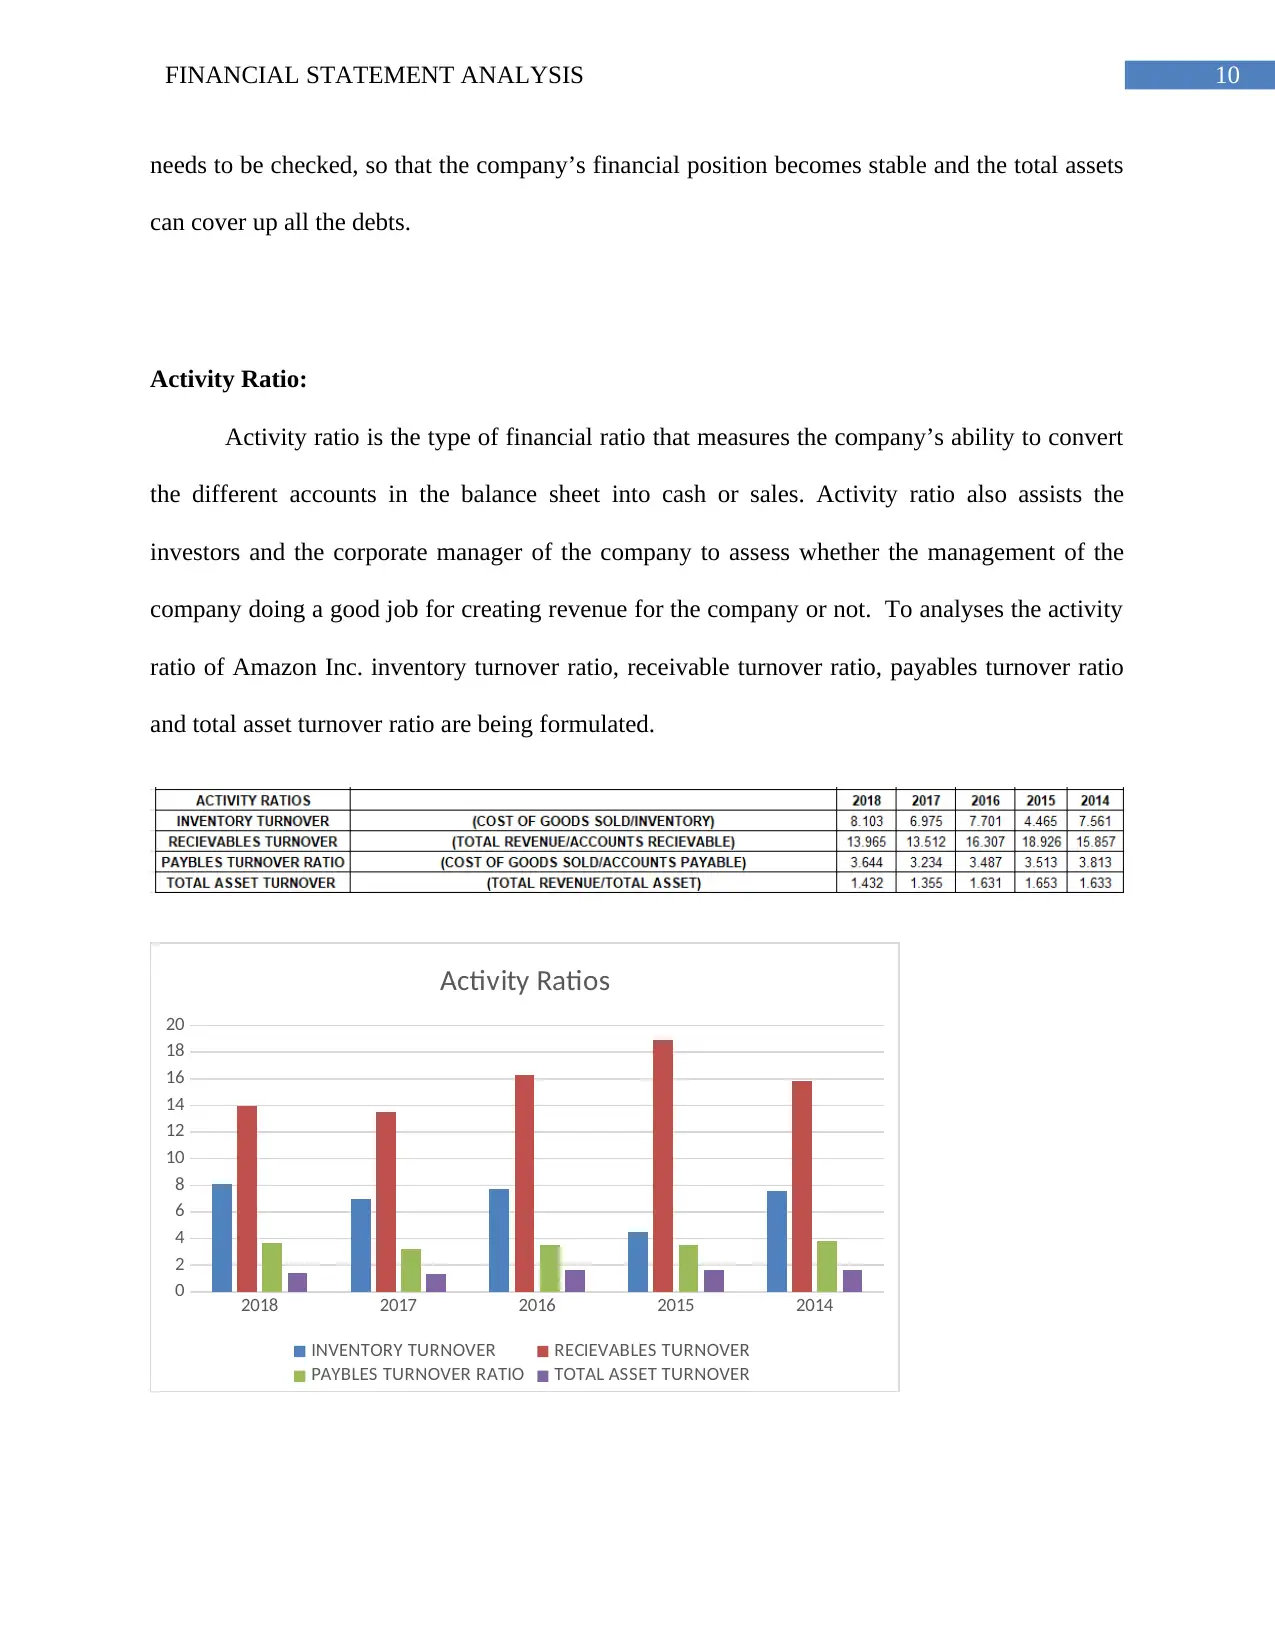
Activity Ratio:
Activity ratio is the type of financial ratio that measures the company’s ability to convert
the different accounts in the balance sheet into cash or sales. Activity ratio also assists the
investors and the corporate manager of the company to assess whether the management of the
company doing a good job for creating revenue for the company or not. To analyses the activity
ratio of Amazon Inc. inventory turnover ratio, receivable turnover ratio, payables turnover ratio
and total asset turnover ratio are being formulated.
2018 2017 2016 2015 2014
0
2
4
6
8
10
12
14
16
18
20
Activity Ratios
INVENTORY TURNOVER RECIEVABLES TURNOVER
PAYBLES TURNOVER RATIO TOTAL ASSET TURNOVER
needs to be checked, so that the company’s financial position becomes stable and the total assets
can cover up all the debts.
Activity Ratio:
Activity ratio is the type of financial ratio that measures the company’s ability to convert
the different accounts in the balance sheet into cash or sales. Activity ratio also assists the
investors and the corporate manager of the company to assess whether the management of the
company doing a good job for creating revenue for the company or not. To analyses the activity
ratio of Amazon Inc. inventory turnover ratio, receivable turnover ratio, payables turnover ratio
and total asset turnover ratio are being formulated.
2018 2017 2016 2015 2014
0
2
4
6
8
10
12
14
16
18
20
Activity Ratios
INVENTORY TURNOVER RECIEVABLES TURNOVER
PAYBLES TURNOVER RATIO TOTAL ASSET TURNOVER
11FINANCIAL STATEMENT ANALYSIS
Inventory Turnover Ratio:
Inventory turnover ratio is the financial indicator that assists the investors and the
corporate managers of the company to find the ability of the company to generate the sales from
inventory (Annualreports.com. N. p., 2020. Web). As per the analysis, inventory turnover ratio
of Amazon Inc. the ratio fell down due to the decrease in sales and pilling up of inventory in
2015 led to the low inventory turnover ratio. This was not the case in next few years, as the sales
of the company increased by considerable means. Thus, in 2018 the inventory turnover ratio
increased and stands at 8.103, which is much higher in comparison to the previous year. This
states that the company’s ability to transfer the inventory into sales is immense.
Receivables Turnover:
Receivables turnover ratio assists the corporate manager of the company or the investors
to determine the company’s ability to calculate the company’s effectiveness in collecting the
receivables that are owned by the clients. As per the analysis of the receivables turnover of the
Amazon Inc. is 13.965, which means Amazon Inc. can easily gain access to the lending amount.
Payables Turnover:
Payables turnover of the company assists the investors and the corporate managers of the
company to determine the company’s ability to quantify the rate at which the company pay off to
the supplier. Due to the decrease in sales the ability of the company to pay-off debt to the
supplier decreased in 2017. The payables turnover for Amazon Inc. is 3.644 in 2018. As per the
⊘ This is a preview!⊘
Do you want full access?
Subscribe today to unlock all pages.
Trusted by 1+ million students worldwide
1 out of 23
Related Documents


Your All-in-One AI-Powered Toolkit for Academic Success.
+13062052269
info@desklib.com
Available 24*7 on WhatsApp / Email
![[object Object]](/_next/static/media/star-bottom.7253800d.svg)
Unlock your academic potential
Copyright © 2020–2026 A2Z Services. All Rights Reserved. Developed and managed by ZUCOL.