Financial Analysis of Amazon Inc.: Performance and Investor Insights
VerifiedAdded on 2022/10/02
|11
|2211
|249
Report
AI Summary
This report presents a comprehensive financial analysis of Amazon Inc., utilizing its 2017 annual report. The analysis employs three key techniques: trend analysis (ratio analysis), common size financial statement analysis, and percentage change financial statement analysis. The report delves into liquidity, profitability, and efficiency ratios, providing insights into Amazon's financial health. It examines key trends in the income statement and balance sheet, including research and development expenses, selling expenses, and changes in assets and liabilities. Furthermore, the analysis considers the impact of interest rate changes and financial market trends on Amazon's risk-return characteristics from an investor's perspective. The report concludes with an overall assessment of Amazon's financial position, highlighting key strengths and areas for improvement, and emphasizes the reliability of the findings for future growth and sustainability. References from academic journals and financial resources are included to support the analysis.
Running Head: FINANCIAL ANALYSIS 1
FINANCIAL ANALYSIS
FINANCIAL ANALYSIS
Paraphrase This Document
Need a fresh take? Get an instant paraphrase of this document with our AI Paraphraser
Running Head: FINANCIAL ANALYSIS
Table of Contents
Introduction.................................................................................................................................................3
Trend Analysis............................................................................................................................................3
Liquidity Ratios.......................................................................................................................................3
Profitability..............................................................................................................................................4
Efficiency ratios......................................................................................................................................6
Common Size financial statement analysis..................................................................................................7
Key Insights.............................................................................................................................................7
Income statement.................................................................................................................................7
Balance sheet.......................................................................................................................................7
Percentage change financial statements.......................................................................................................8
Key Insights.............................................................................................................................................8
Conclusion...................................................................................................................................................9
References.................................................................................................................................................10
Running Head: FINANCIAL ANALYSIS
Introduction
The financial analysis is the analysis which is conducted by the organizations using the
different techniques and the tools. The tools and the techniques can be bifurcated as the trend
analysis also known as the ratio analysis, the common size financial statement analysis as well as
percentage change financial statements. In this report a detailed analysis of these three
techniques have been undertaken keeping an alignment with the Amazon Inc. which is one of the
largest flagship based in the America having the headquarters at Seattle Washington, Arlignton,
Virginia and United States. This company was formerly known as Cadabra Inc (Amazon, Inc.
2017).
Trend Analysis
Trend analysis is the techniques which are used by the corporates to get an in-depth
understanding of the financial performance of the company alongside different parameters. The
parameters are liquidity, solvency, profitability, efficiency and the market trends of the company.
In this section, a detailed analysis of the ratios for the period of the two years have been
conducted in detail to analyze the performance from the point of view of the investors (Eckhaus,
2016).
Liquidity Ratios
Liquidity Ratios 2016 2017 2016 2017
Current Ratio Current Assets 45781 60197 1.04 1.04
Current Liabilities 43816 57883
Quick Ratio Quick Assets 25981 30986 0.59 0.54
Current Liabilities 43816 57883
⊘ This is a preview!⊘
Do you want full access?
Subscribe today to unlock all pages.
Trusted by 1+ million students worldwide
Running Head: FINANCIAL ANALYSIS
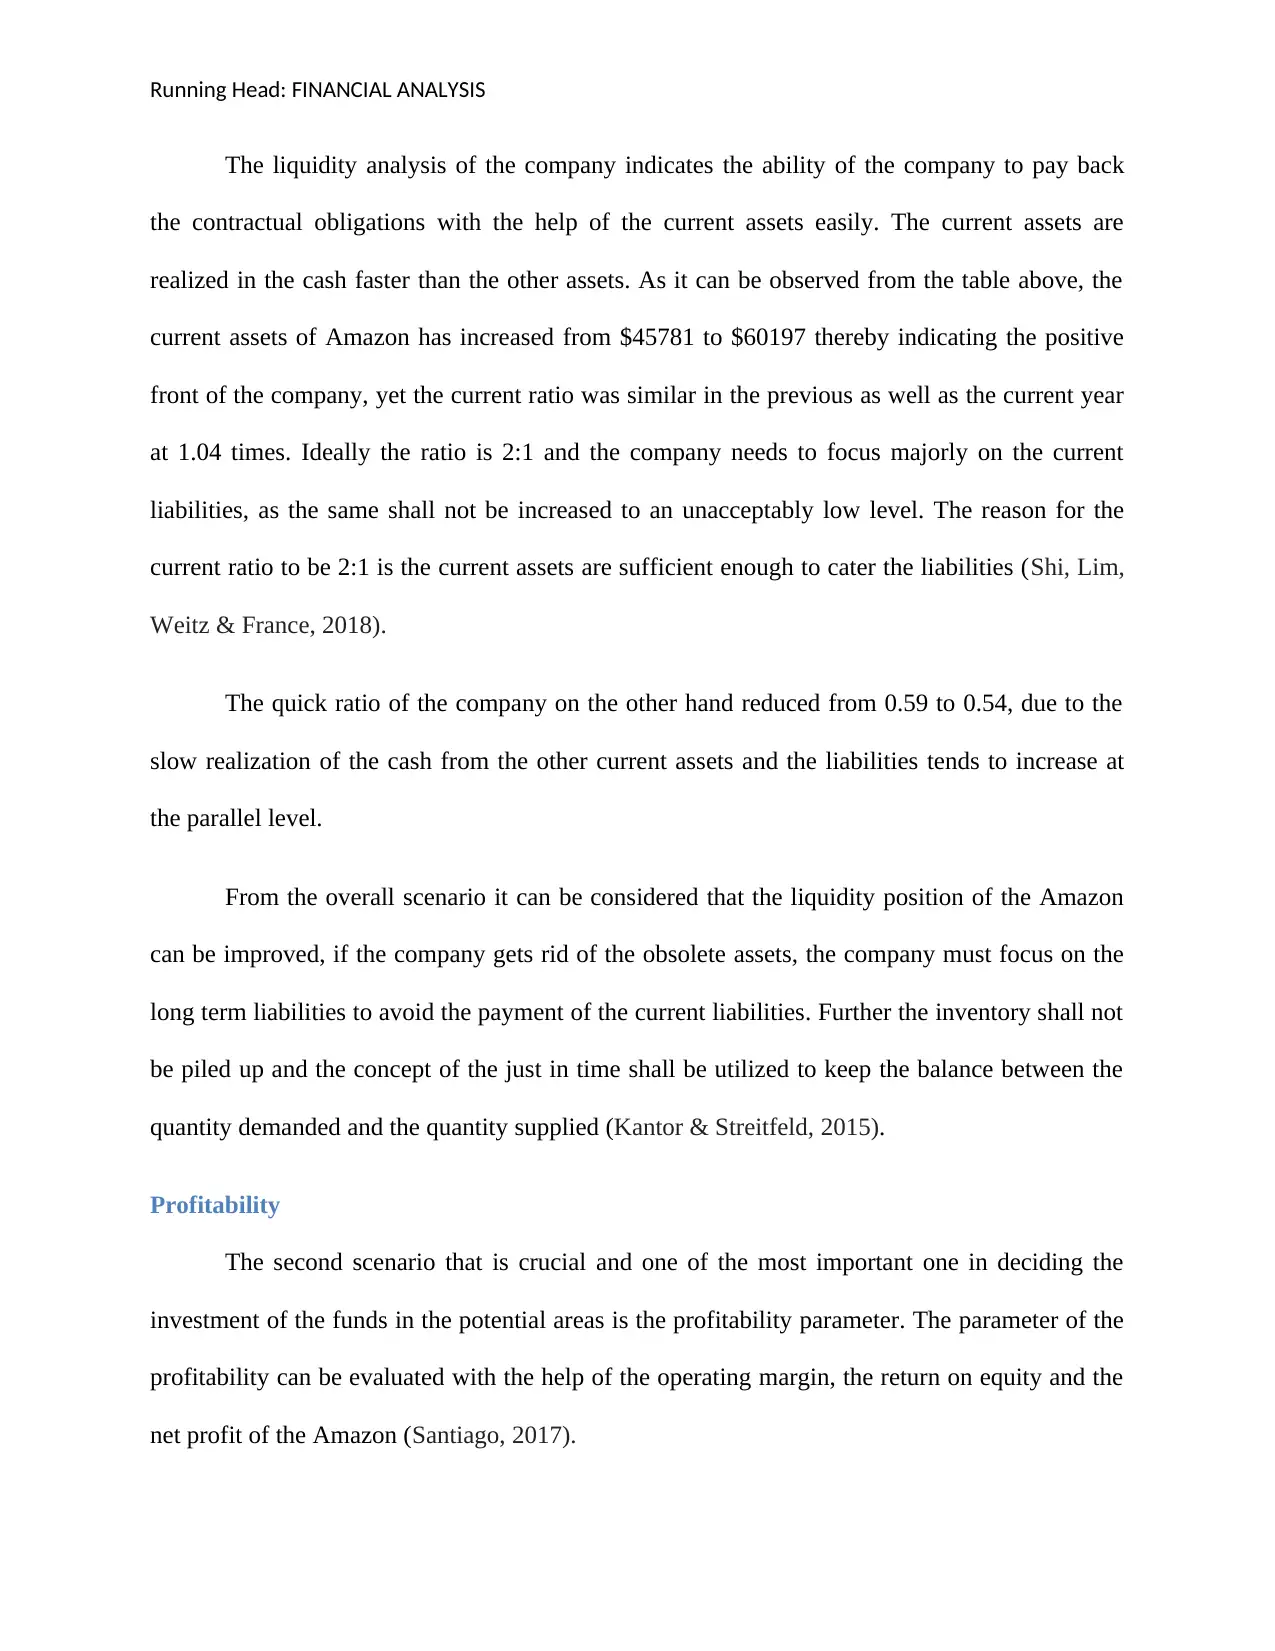
The liquidity analysis of the company indicates the ability of the company to pay back
the contractual obligations with the help of the current assets easily. The current assets are
realized in the cash faster than the other assets. As it can be observed from the table above, the
current assets of Amazon has increased from $45781 to $60197 thereby indicating the positive
front of the company, yet the current ratio was similar in the previous as well as the current year
at 1.04 times. Ideally the ratio is 2:1 and the company needs to focus majorly on the current
liabilities, as the same shall not be increased to an unacceptably low level. The reason for the
current ratio to be 2:1 is the current assets are sufficient enough to cater the liabilities (Shi, Lim,
Weitz & France, 2018).
The quick ratio of the company on the other hand reduced from 0.59 to 0.54, due to the
slow realization of the cash from the other current assets and the liabilities tends to increase at
the parallel level.
From the overall scenario it can be considered that the liquidity position of the Amazon
can be improved, if the company gets rid of the obsolete assets, the company must focus on the
long term liabilities to avoid the payment of the current liabilities. Further the inventory shall not
be piled up and the concept of the just in time shall be utilized to keep the balance between the
quantity demanded and the quantity supplied (Kantor & Streitfeld, 2015).
Profitability
The second scenario that is crucial and one of the most important one in deciding the
investment of the funds in the potential areas is the profitability parameter. The parameter of the
profitability can be evaluated with the help of the operating margin, the return on equity and the
net profit of the Amazon (Santiago, 2017).
Paraphrase This Document
Need a fresh take? Get an instant paraphrase of this document with our AI Paraphraser
Running Head: FINANCIAL ANALYSIS
2016 2017
0.00%
2.00%
4.00%
6.00%
8.00%
10.00%
12.00%
14.00%
16.00%
18.00%
Profitability Ratios
Operating profit margin
Return on Equity
Net Profit
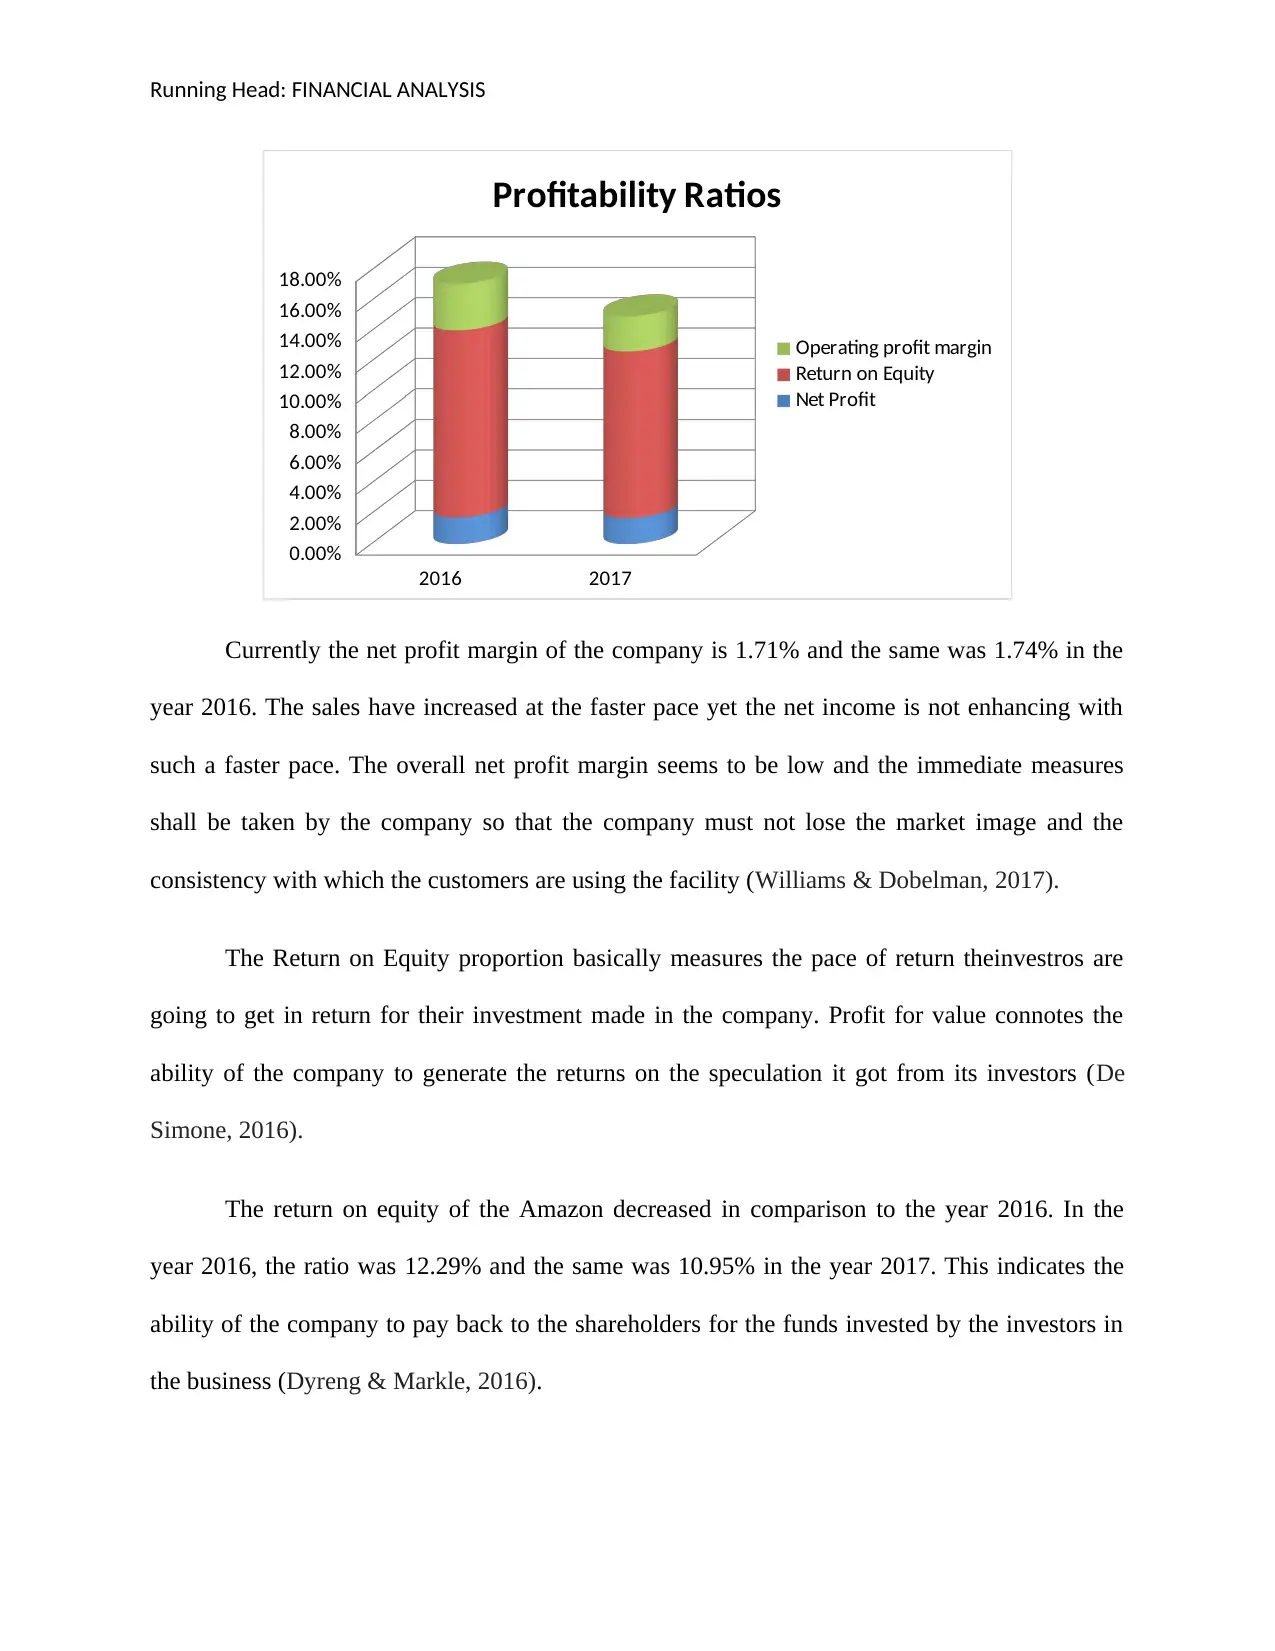
Currently the net profit margin of the company is 1.71% and the same was 1.74% in the
year 2016. The sales have increased at the faster pace yet the net income is not enhancing with
such a faster pace. The overall net profit margin seems to be low and the immediate measures
shall be taken by the company so that the company must not lose the market image and the
consistency with which the customers are using the facility (Williams & Dobelman, 2017).
The Return on Equity proportion basically measures the pace of return theinvestros are
going to get in return for their investment made in the company. Profit for value connotes the
ability of the company to generate the returns on the speculation it got from its investors (De
Simone, 2016).
The return on equity of the Amazon decreased in comparison to the year 2016. In the
year 2016, the ratio was 12.29% and the same was 10.95% in the year 2017. This indicates the
ability of the company to pay back to the shareholders for the funds invested by the investors in
the business (Dyreng & Markle, 2016).
2016 2017
0.00%
2.00%
4.00%
6.00%
8.00%
10.00%
12.00%
14.00%
16.00%
18.00%
Profitability Ratios
Operating profit margin
Return on Equity
Net Profit
Currently the net profit margin of the company is 1.71% and the same was 1.74% in the
year 2016. The sales have increased at the faster pace yet the net income is not enhancing with
such a faster pace. The overall net profit margin seems to be low and the immediate measures
shall be taken by the company so that the company must not lose the market image and the
consistency with which the customers are using the facility (Williams & Dobelman, 2017).
The Return on Equity proportion basically measures the pace of return theinvestros are
going to get in return for their investment made in the company. Profit for value connotes the
ability of the company to generate the returns on the speculation it got from its investors (De
Simone, 2016).
The return on equity of the Amazon decreased in comparison to the year 2016. In the
year 2016, the ratio was 12.29% and the same was 10.95% in the year 2017. This indicates the
ability of the company to pay back to the shareholders for the funds invested by the investors in
the business (Dyreng & Markle, 2016).
Running Head: FINANCIAL ANALYSIS
The operating margin of the company is ratio that determines the raw profit with respect
to the net sales. The operating margin also decreased from 3.08% to 2.31% due to the increase of
the operating expenditure and the raw costs. The immediate reduction in the labor costs is
required to enhance the overall performance of the business (Chen, et al 2018).
The overall profitability of the company has been reduced only and the company needs
the immediate actions to resolve the situation.
Efficiency ratios
Efficiency Ratios 2016 2017 2016 2017
Days Inventory Outstanding Inventory * 365
419472
6
585715
5
47.52 52.33
Cost of goods sold 88265 111934
Days Receivable
Outstanding
Accounts receivable *
365
305207
4
480486
0
22.44 27.01
Credit sales 135987 177866
Total Asset turnover Net Sales 135987 177866 1.57 1.66
Average total Assets 86574 107356
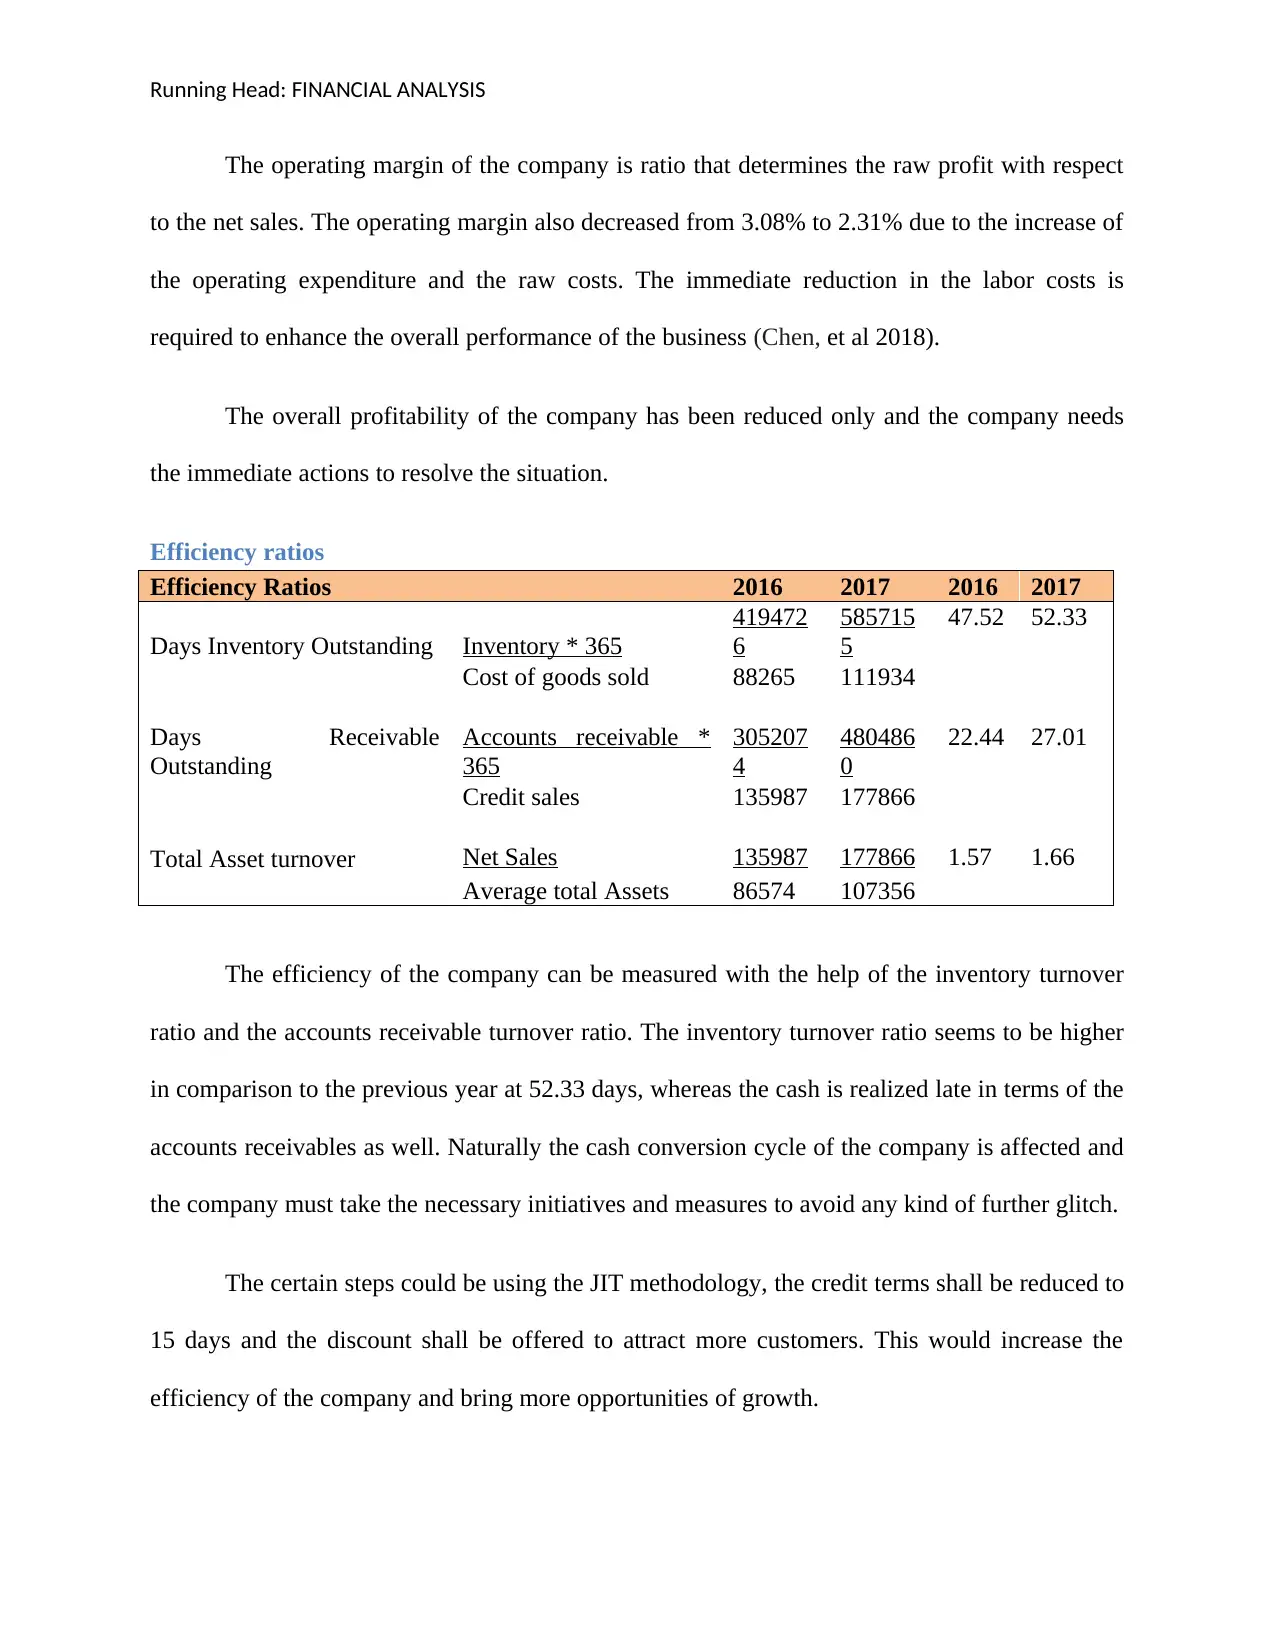
The efficiency of the company can be measured with the help of the inventory turnover
ratio and the accounts receivable turnover ratio. The inventory turnover ratio seems to be higher
in comparison to the previous year at 52.33 days, whereas the cash is realized late in terms of the
accounts receivables as well. Naturally the cash conversion cycle of the company is affected and
the company must take the necessary initiatives and measures to avoid any kind of further glitch.
The certain steps could be using the JIT methodology, the credit terms shall be reduced to
15 days and the discount shall be offered to attract more customers. This would increase the
efficiency of the company and bring more opportunities of growth.
The operating margin of the company is ratio that determines the raw profit with respect
to the net sales. The operating margin also decreased from 3.08% to 2.31% due to the increase of
the operating expenditure and the raw costs. The immediate reduction in the labor costs is
required to enhance the overall performance of the business (Chen, et al 2018).
The overall profitability of the company has been reduced only and the company needs
the immediate actions to resolve the situation.
Efficiency ratios
Efficiency Ratios 2016 2017 2016 2017
Days Inventory Outstanding Inventory * 365
419472
6
585715
5
47.52 52.33
Cost of goods sold 88265 111934
Days Receivable
Outstanding
Accounts receivable *
365
305207
4
480486
0
22.44 27.01
Credit sales 135987 177866
Total Asset turnover Net Sales 135987 177866 1.57 1.66
Average total Assets 86574 107356
The efficiency of the company can be measured with the help of the inventory turnover
ratio and the accounts receivable turnover ratio. The inventory turnover ratio seems to be higher
in comparison to the previous year at 52.33 days, whereas the cash is realized late in terms of the
accounts receivables as well. Naturally the cash conversion cycle of the company is affected and
the company must take the necessary initiatives and measures to avoid any kind of further glitch.
The certain steps could be using the JIT methodology, the credit terms shall be reduced to
15 days and the discount shall be offered to attract more customers. This would increase the
efficiency of the company and bring more opportunities of growth.
⊘ This is a preview!⊘
Do you want full access?
Subscribe today to unlock all pages.
Trusted by 1+ million students worldwide
Running Head: FINANCIAL ANALYSIS
Common Size financial statement analysis
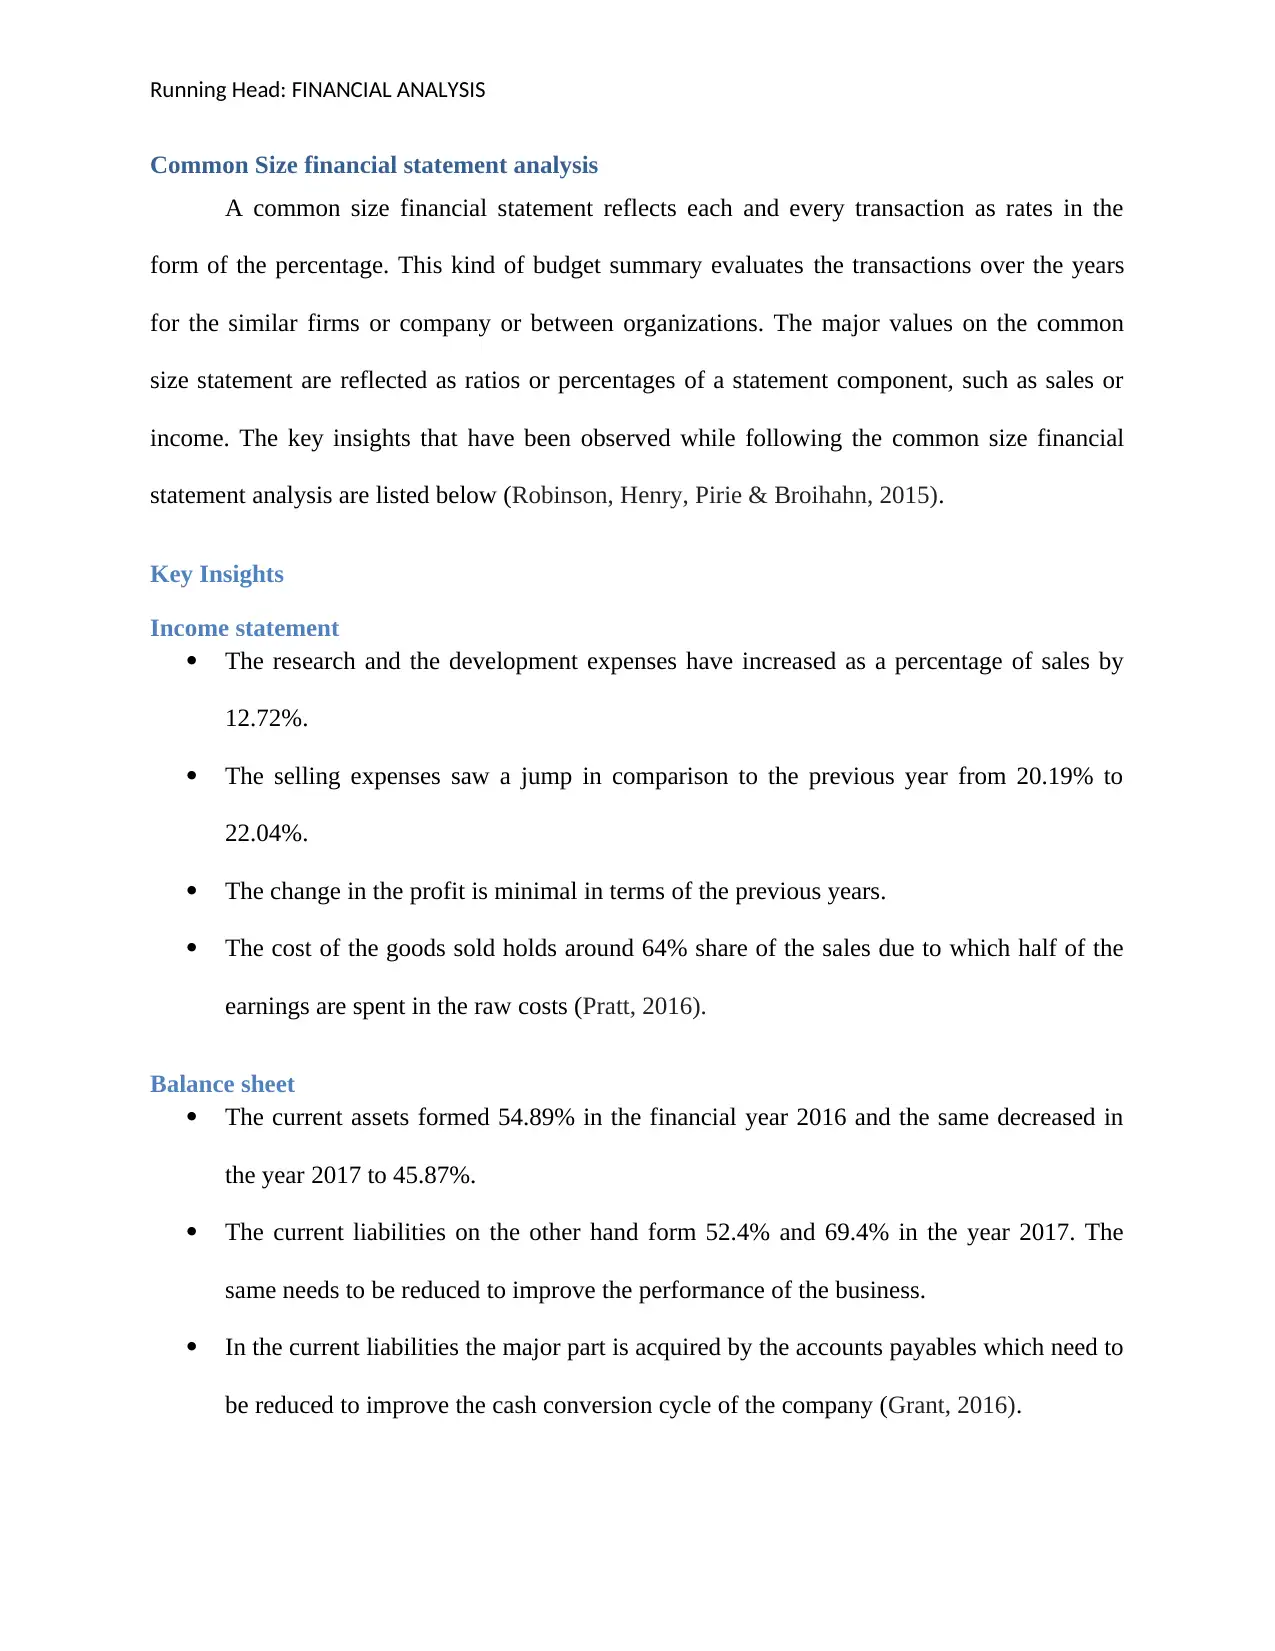
A common size financial statement reflects each and every transaction as rates in the
form of the percentage. This kind of budget summary evaluates the transactions over the years
for the similar firms or company or between organizations. The major values on the common
size statement are reflected as ratios or percentages of a statement component, such as sales or
income. The key insights that have been observed while following the common size financial
statement analysis are listed below (Robinson, Henry, Pirie & Broihahn, 2015).
Key Insights
Income statement
The research and the development expenses have increased as a percentage of sales by
12.72%.
The selling expenses saw a jump in comparison to the previous year from 20.19% to
22.04%.
The change in the profit is minimal in terms of the previous years.
The cost of the goods sold holds around 64% share of the sales due to which half of the
earnings are spent in the raw costs (Pratt, 2016).
Balance sheet
The current assets formed 54.89% in the financial year 2016 and the same decreased in
the year 2017 to 45.87%.
The current liabilities on the other hand form 52.4% and 69.4% in the year 2017. The
same needs to be reduced to improve the performance of the business.
In the current liabilities the major part is acquired by the accounts payables which need to
be reduced to improve the cash conversion cycle of the company (Grant, 2016).
Common Size financial statement analysis
A common size financial statement reflects each and every transaction as rates in the
form of the percentage. This kind of budget summary evaluates the transactions over the years
for the similar firms or company or between organizations. The major values on the common
size statement are reflected as ratios or percentages of a statement component, such as sales or
income. The key insights that have been observed while following the common size financial
statement analysis are listed below (Robinson, Henry, Pirie & Broihahn, 2015).
Key Insights
Income statement
The research and the development expenses have increased as a percentage of sales by
12.72%.
The selling expenses saw a jump in comparison to the previous year from 20.19% to
22.04%.
The change in the profit is minimal in terms of the previous years.
The cost of the goods sold holds around 64% share of the sales due to which half of the
earnings are spent in the raw costs (Pratt, 2016).
Balance sheet
The current assets formed 54.89% in the financial year 2016 and the same decreased in
the year 2017 to 45.87%.
The current liabilities on the other hand form 52.4% and 69.4% in the year 2017. The
same needs to be reduced to improve the performance of the business.
In the current liabilities the major part is acquired by the accounts payables which need to
be reduced to improve the cash conversion cycle of the company (Grant, 2016).
Paraphrase This Document
Need a fresh take? Get an instant paraphrase of this document with our AI Paraphraser

Running Head: FINANCIAL ANALYSIS
Percentage change financial statements
Percentage change evaluates the change in financial report that accounts for more than
two years. For the purpose of the income statement it can uncover if expenses are staying in
accordance with deals income; for the balance sheet, this sort of investigation can reveal if (and
how) singular resource and risk records have changed in respect to the earlier year. The key
insights that have been observed while following the common size financial statement analysis
are listed below (Edwards, Schwab & Shevlin, 2015).
Key Insights
While the consolidated statements of the last two years are evaluated in terms of the
percentage change financial statements several changes have been noticed in the income
statement as well as in the balance sheet of the Amazon Company.
The net sales saw an increase of 31% whereas on the contrary the operating margin
reflected a decrease by 2%.
The interest costs have increased by 75%, which is a critical situation for the company.
The positive things that can be observed from the income statement are the reduction in
the income tax expense.
The negative thing is the increase in the costs by 27% of the direct nature and by 43% in
case of the selling and the administrative expenses.
In case of the times of the balance sheet the liabilities saw a huge jump of 225% and so is
seen by the goodwill of the company at 252%. This indicates that no matter what, the
brand image of the company is strong (De Simone, 2016).
The other increase that was seen was on the part of the inventory and the trade
receivables, which is a good sign only until the cash is realized in the fastest manner.
Running Head: FINANCIAL ANALYSIS
Conclusion
From the overall analysis it can be stated that the overall position of the Amazon Inc. is
satisfactory and the key issues that have been listed above if could be solved can help Amazon
can beat any competitor. Further the three techniques have been used to analyze and get an in-
depth understanding and hence, this indicates that the results are quite reliable and fruitful for
future growth and sustainability.
⊘ This is a preview!⊘
Do you want full access?
Subscribe today to unlock all pages.
Trusted by 1+ million students worldwide
Running Head: FINANCIAL ANALYSIS
References
Amazon, Inc. (2017). Annual Report. Retrieved from
file:///C:/Users/System04087/Downloads/3550119_1363368414_AnnualReportofAmazo
nforassessm%20(1).PDF
Chen, C. W., Collins, D. W., Kravet, T. D., & Mergenthaler, R. D. (2018). Financial statement
comparability and the efficiency of acquisition decisions. Contemporary Accounting
Research, 35(1), 164-202.
De Simone, L. (2016). Does a common set of accounting standards affect tax-motivated income
shifting for multinational firms?. Journal of Accounting and Economics, 61(1), 145-165.
Dyreng, S. D., & Markle, K. S. (2016). The effect of financial constraints on income shifting by
US multinationals. The Accounting Review, 91(6), 1601-1627.
Eckhaus, E. (2016). Corporate transformational leadership's effect on financial
performance. Journal of Leadership, Accountability and Ethics, 13(1).
Edwards, A., Schwab, C., & Shevlin, T. (2015). Financial constraints and cash tax savings. The
Accounting Review, 91(3), 859-881.
Kantor, J., & Streitfeld, D. (2015). Inside Amazon: Wrestling big ideas in a bruising
workplace. New York Times, 15, 74-80.
Santiago, D. R. (2017). The role of FSC certification to maintain sustainability: the case of
Precious Woods Amazon Company. REBRAE, 10(1), 8-35.
Shi, Y., Lim, J. M., Weitz, B. A., & France, S. L. (2018). The impact of retail format
diversification on retailers’ financial performance. Journal of the Academy of Marketing
Science, 46(1), 147-167.
Williams, E. E., & Dobelman, J. A. (2017). Financial statement analysis. World Scientific Book
Chapters, 109-169.
Paraphrase This Document
Need a fresh take? Get an instant paraphrase of this document with our AI Paraphraser
Running Head: FINANCIAL ANALYSIS
Robinson, T. R., Henry, E., Pirie, W. L., & Broihahn, M. A. (2015). International financial
statement analysis. John Wiley & Sons.
Pratt, J. (2016). Financial accounting in an economic context. John Wiley & Sons.
Grant, R. M. (2016). Contemporary strategy analysis: Text and cases edition. John Wiley &
Sons.
1 out of 11
Related Documents


Your All-in-One AI-Powered Toolkit for Academic Success.
+13062052269
info@desklib.com
Available 24*7 on WhatsApp / Email
![[object Object]](/_next/static/media/star-bottom.7253800d.svg)
Unlock your academic potential
Copyright © 2020–2026 A2Z Services. All Rights Reserved. Developed and managed by ZUCOL.