Impact of Microeconomic and Macroeconomic Environment on Amazon
VerifiedAdded on 2022/12/30
|22
|5649
|1
Report
AI Summary
This report provides a comprehensive analysis of Amazon's performance within the context of the microeconomic and macroeconomic environments. It begins with an overview of Amazon's market position and its key competitors, particularly Walmart, examining their financial performance, growth strategies, and stock performance over time. The report then delves into the application of economic theory and data to explore Amazon's macroeconomic exposure, including the impact of GDP, exchange rates, and minimum wage legislation. It also investigates non-economic exposures such as political dependency and tax shaming, comparing Amazon's strategies with those of its competitors. The analysis includes an assessment of Amazon's strategic effectiveness in the face of economic shocks, particularly focusing on the 2008/2009 financial crisis and its preparedness for future global economic challenges, such as the 2020 economic shock.
Impact of the Microeconomic
and Macroeconomic
Environment
Table of Contents
and Macroeconomic
Environment
Table of Contents
Paraphrase This Document
Need a fresh take? Get an instant paraphrase of this document with our AI Paraphraser
INTRODUCTION ..........................................................................................................................3
MAIN BODY...................................................................................................................................3
1. Performance of the organization in relation to its main competitors.......................................3
2. Use of economic theory and data to explore Amazon macroeconomic, market and cost
vulnerability by comparing with another organisation................................................................5
Effectiveness of Amazon Strategy.............................................................................................15
Amazon Preparation for economic shock in the year 2020.......................................................17
CONCLUSION..............................................................................................................................19
REFERENCES..............................................................................................................................20
INTRODUCTION
Microeconomic environment is defined as the things that affect the individual of the
company along with its internal company structure. Microeconomic environment consists of all
the aspects that fall into the category of the company within which its operations work
(Guoqiang, 2016). Amazon being the biggest online retail store has managed with the
microeconomic environment to be considered in more precise form.
Macroeconomic environment is defined as the things that affect the organization on its
outskirts, that is, the external environment consisting of its market structure, its competitors etc.
which directly are linked with the organization (Safonov and Sheremet, 2017). The external
environment of organization affects the whole organization largely on the basis of GDP growth,
taxes, unemployment, inflation, etc. Amazon has also responded efficiently towards changes in
its macroeconomic environment.
This report will analyse the performance of Amazon in relation to its competitors. This is
done with the economic theory and data to explore the firm's macroeconomic exposure and its
cost vulnerabilities including comparisons with an appropriate comparator organization. The
effectiveness of business strategy of Amazon in 2008/2009 and how well equipped is Amazon to
handle any global economic shocks from 2020 onwards is also measured in this report.
MAIN BODY
1. Performance of the organization in relation to its main competitors
Amazon is an online retailer which provides its services and products to cater supply to
its customers. Amazon has created vast market size in terms of outsourcing its commodities from
making available all the products that are necessary in day to day life consisting from selling
books, music, movies, housewares, electronics, clothes etc (Debter, 2019). Due to theses
competitors in market Amazon has greatly achieved and progressed its products and services to
be better in the market structure. The main competitors of Amazon in retail services is Walmart.
For subscription service Amazon competes with Google, Netflix and Apple. In the web services
Amazon has main competition with IBM, Microsoft. From past 2006-2019 Amazon has broken
down the part from which they have received major revenue. They have major earning from
Online stores, Physical stores, Third-party seller services, Subscription services Amazon Web
Services (AWS). One of the most significant competitor of Amazon is Alibaba. E-commerce
represented 14.3% of total retail sales in 2018, and Amazon accounts for 40% of U.S. online
retail. Walmart was being founded in year 1962 while Amazon was founded in the year 1994.
The growth strategy of Amazon has been far more ahead.
⊘ This is a preview!⊘
Do you want full access?
Subscribe today to unlock all pages.
Trusted by 1+ million students worldwide
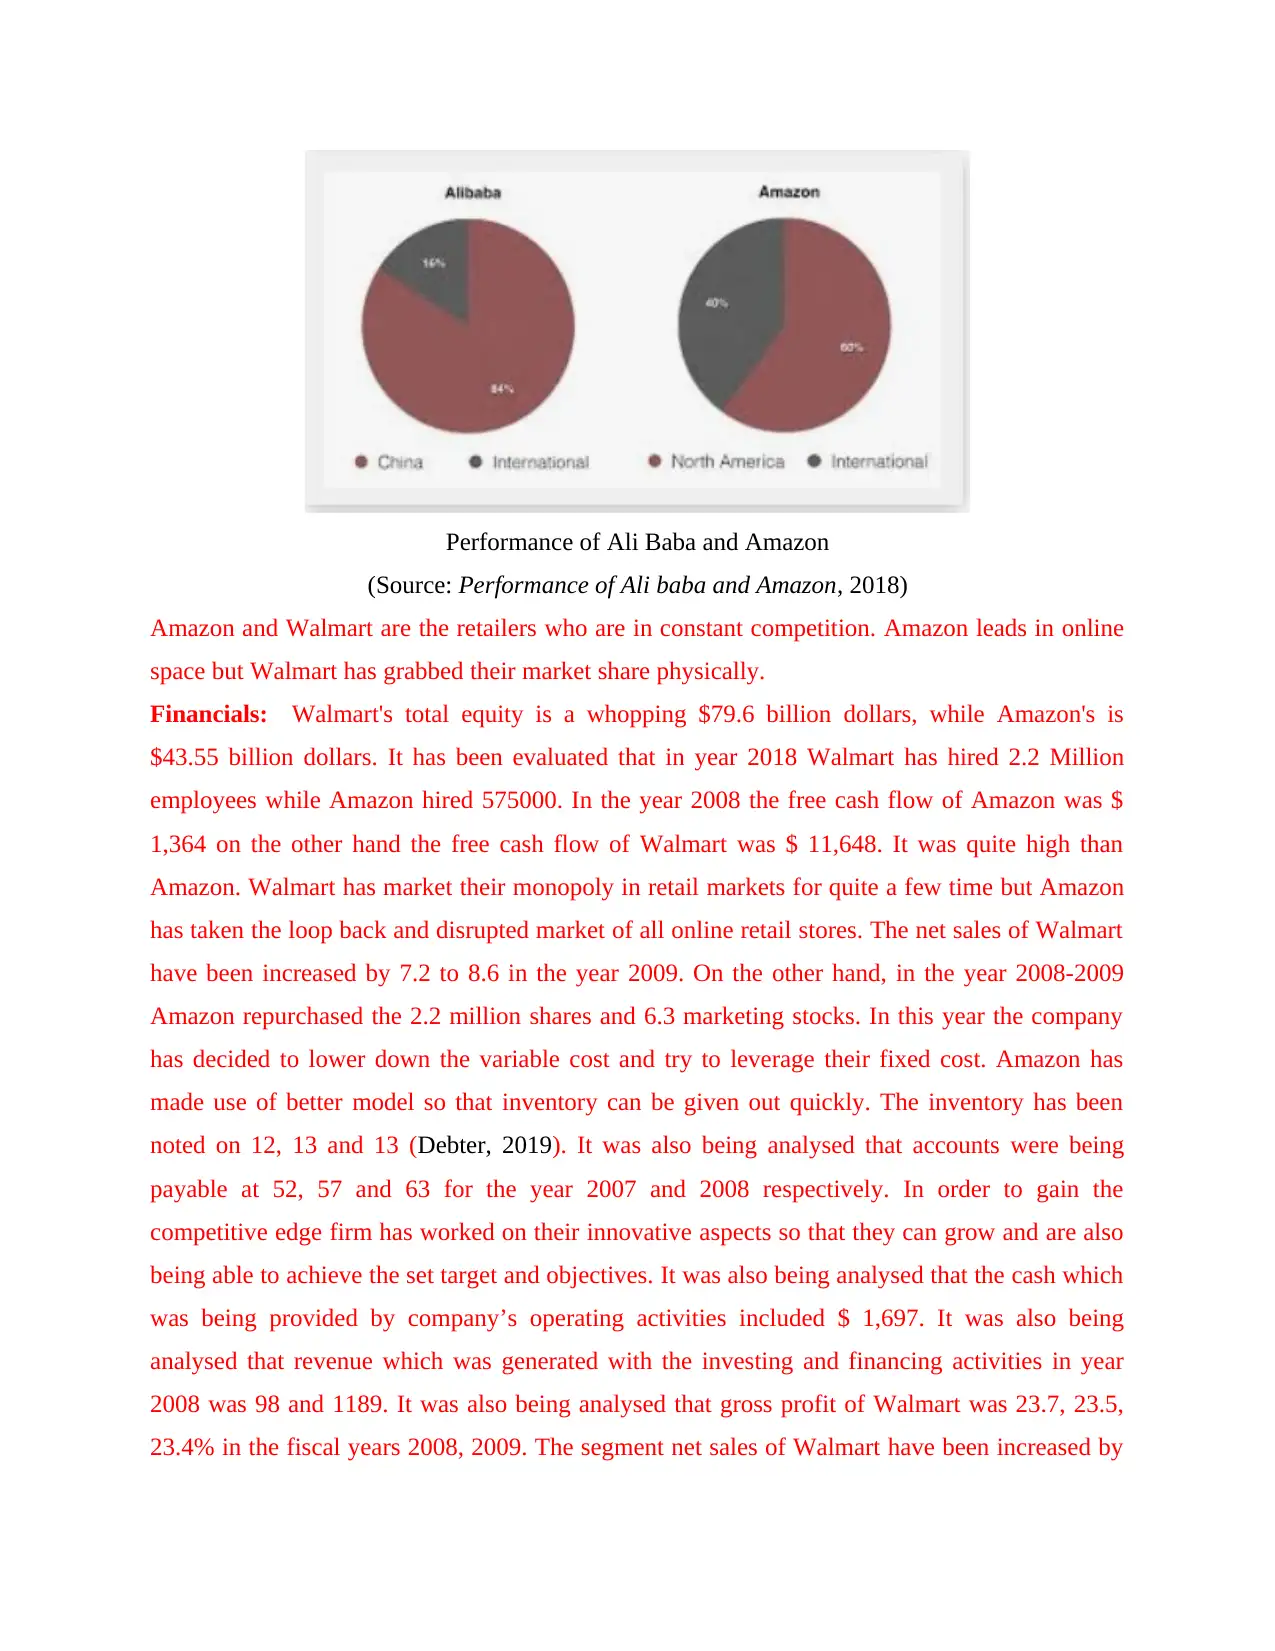
Performance of Ali Baba and Amazon
(Source: Performance of Ali baba and Amazon, 2018)
Amazon and Walmart are the retailers who are in constant competition. Amazon leads in online
space but Walmart has grabbed their market share physically.
Financials: Walmart's total equity is a whopping $79.6 billion dollars, while Amazon's is
$43.55 billion dollars. It has been evaluated that in year 2018 Walmart has hired 2.2 Million
employees while Amazon hired 575000. In the year 2008 the free cash flow of Amazon was $
1,364 on the other hand the free cash flow of Walmart was $ 11,648. It was quite high than
Amazon. Walmart has market their monopoly in retail markets for quite a few time but Amazon
has taken the loop back and disrupted market of all online retail stores. The net sales of Walmart
have been increased by 7.2 to 8.6 in the year 2009. On the other hand, in the year 2008-2009
Amazon repurchased the 2.2 million shares and 6.3 marketing stocks. In this year the company
has decided to lower down the variable cost and try to leverage their fixed cost. Amazon has
made use of better model so that inventory can be given out quickly. The inventory has been
noted on 12, 13 and 13 (Debter, 2019). It was also being analysed that accounts were being
payable at 52, 57 and 63 for the year 2007 and 2008 respectively. In order to gain the
competitive edge firm has worked on their innovative aspects so that they can grow and are also
being able to achieve the set target and objectives. It was also being analysed that the cash which
was being provided by company’s operating activities included $ 1,697. It was also being
analysed that revenue which was generated with the investing and financing activities in year
2008 was 98 and 1189. It was also being analysed that gross profit of Walmart was 23.7, 23.5,
23.4% in the fiscal years 2008, 2009. The segment net sales of Walmart have been increased by
Paraphrase This Document
Need a fresh take? Get an instant paraphrase of this document with our AI Paraphraser
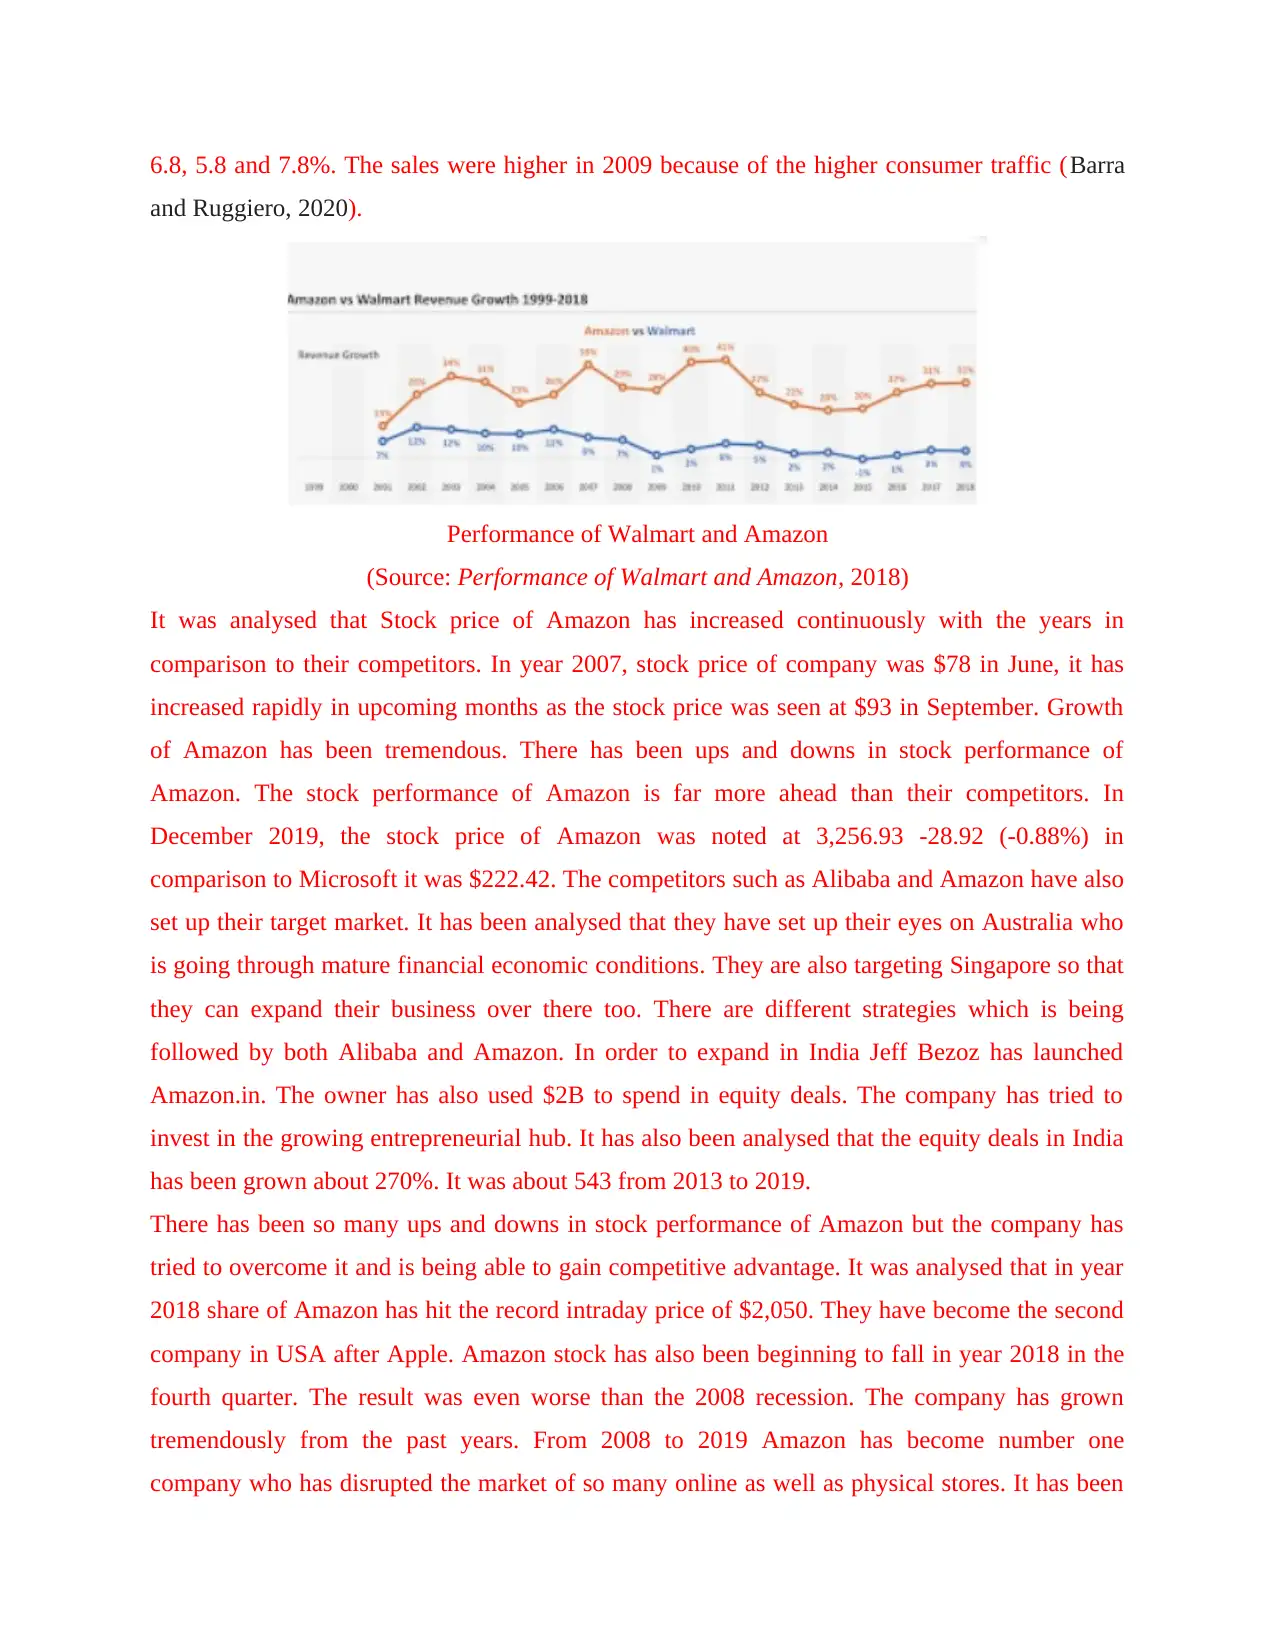
6.8, 5.8 and 7.8%. The sales were higher in 2009 because of the higher consumer traffic (Barra
and Ruggiero, 2020).
Performance of Walmart and Amazon
(Source: Performance of Walmart and Amazon, 2018)
It was analysed that Stock price of Amazon has increased continuously with the years in
comparison to their competitors. In year 2007, stock price of company was $78 in June, it has
increased rapidly in upcoming months as the stock price was seen at $93 in September. Growth
of Amazon has been tremendous. There has been ups and downs in stock performance of
Amazon. The stock performance of Amazon is far more ahead than their competitors. In
December 2019, the stock price of Amazon was noted at 3,256.93 -28.92 (-0.88%) in
comparison to Microsoft it was $222.42. The competitors such as Alibaba and Amazon have also
set up their target market. It has been analysed that they have set up their eyes on Australia who
is going through mature financial economic conditions. They are also targeting Singapore so that
they can expand their business over there too. There are different strategies which is being
followed by both Alibaba and Amazon. In order to expand in India Jeff Bezoz has launched
Amazon.in. The owner has also used $2B to spend in equity deals. The company has tried to
invest in the growing entrepreneurial hub. It has also been analysed that the equity deals in India
has been grown about 270%. It was about 543 from 2013 to 2019.
There has been so many ups and downs in stock performance of Amazon but the company has
tried to overcome it and is being able to gain competitive advantage. It was analysed that in year
2018 share of Amazon has hit the record intraday price of $2,050. They have become the second
company in USA after Apple. Amazon stock has also been beginning to fall in year 2018 in the
fourth quarter. The result was even worse than the 2008 recession. The company has grown
tremendously from the past years. From 2008 to 2019 Amazon has become number one
company who has disrupted the market of so many online as well as physical stores. It has been
analysed that in year 2019 Amazon has provided 1500 new opportunities in new areas and
market. They will also open a new office in Manhattan till 2021.
The Gross domestic product has been increased to 33.4 % to $21,170 billion in the third quarter
of 2019. It was being increased from the $21,157 from the second quarter. Consumer spending
has also been increased by 41.0%. It means it was doubled. Spending on U.S. made Goods
increased by 31.1 %, where consumption of Durable Goods grew by 82.7 %. The final sales of
goods and services has been increased to 25.9% to July to September period in the year 2019.
The economy has grown because of it (Burke, Stern and Bruns, 2018).
2. Use of economic theory and data to explore Amazon macroeconomic, market and cost
vulnerability by comparing with another organisation
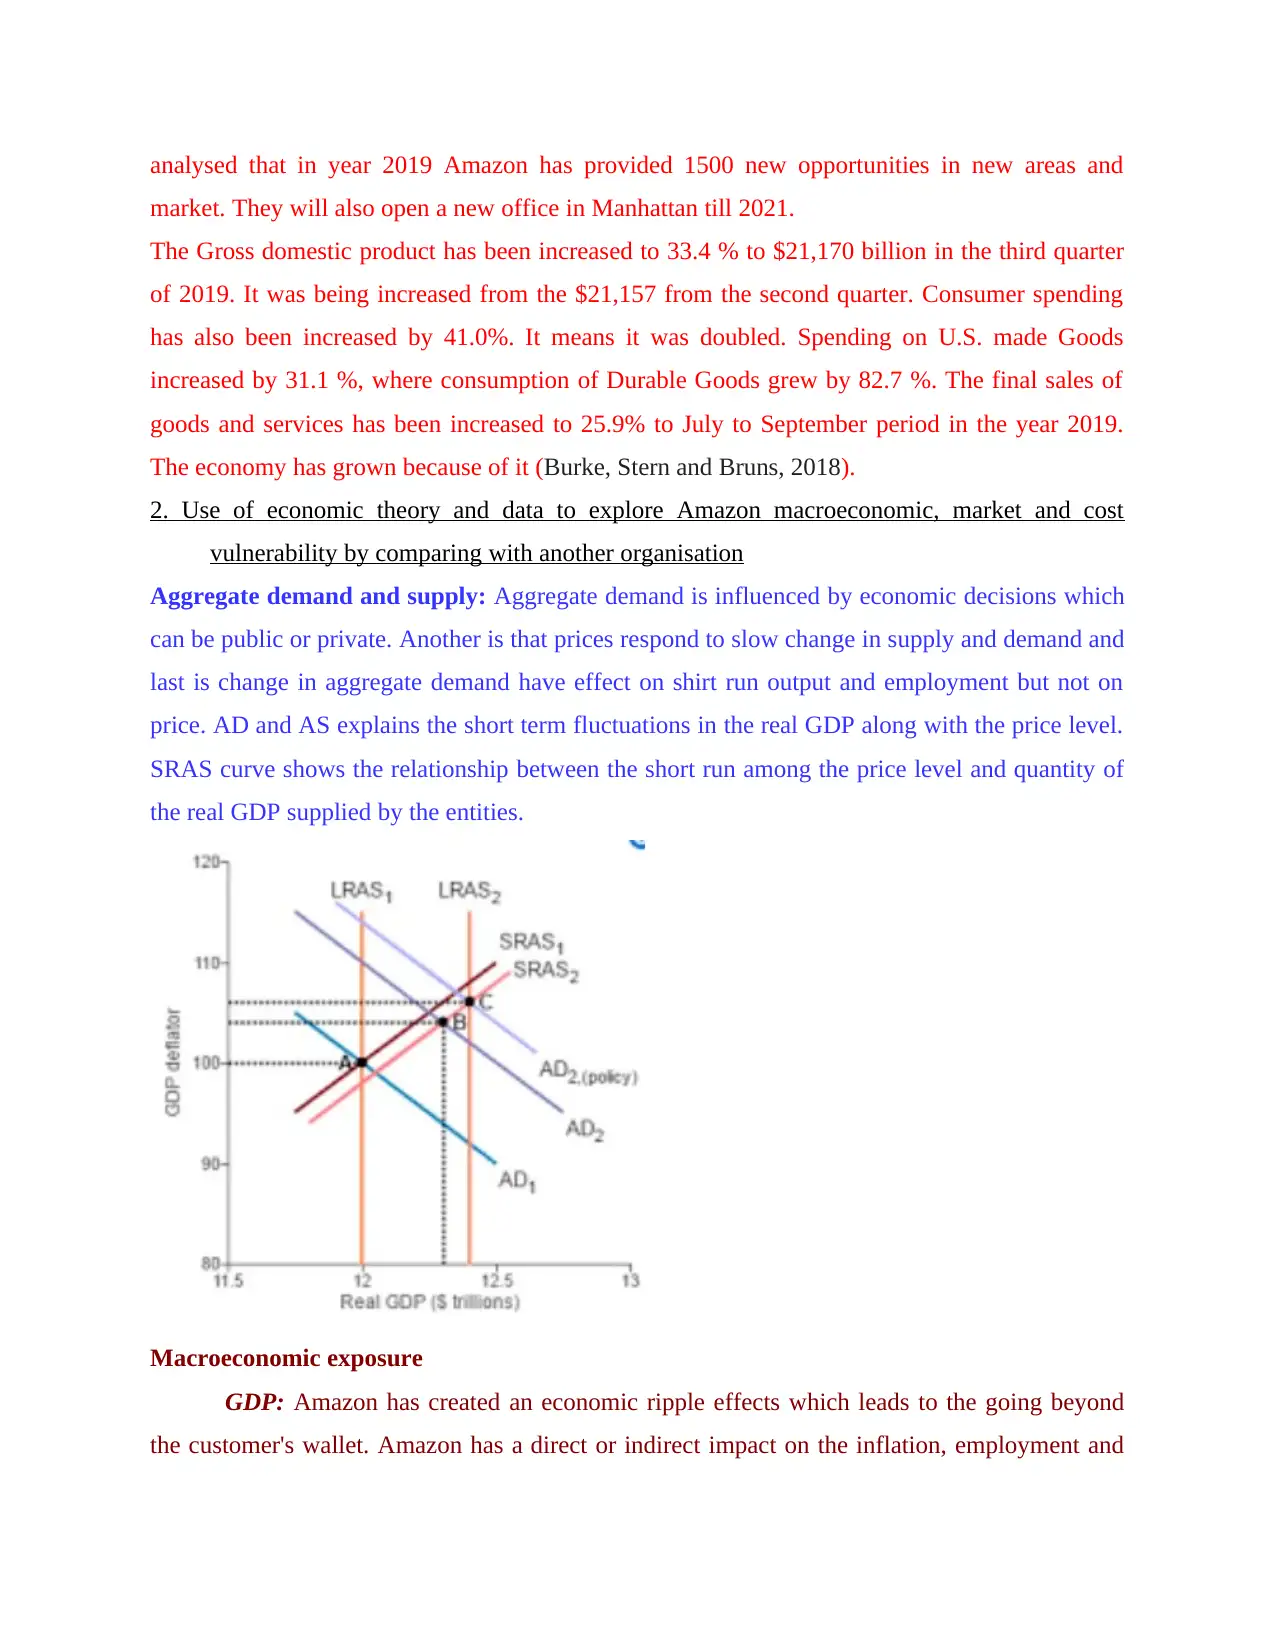
Aggregate demand and supply: Aggregate demand is influenced by economic decisions which
can be public or private. Another is that prices respond to slow change in supply and demand and
last is change in aggregate demand have effect on shirt run output and employment but not on
price. AD and AS explains the short term fluctuations in the real GDP along with the price level.
SRAS curve shows the relationship between the short run among the price level and quantity of
the real GDP supplied by the entities.
Macroeconomic exposure
GDP: Amazon has created an economic ripple effects which leads to the going beyond
the customer's wallet. Amazon has a direct or indirect impact on the inflation, employment and
market. They will also open a new office in Manhattan till 2021.
The Gross domestic product has been increased to 33.4 % to $21,170 billion in the third quarter
of 2019. It was being increased from the $21,157 from the second quarter. Consumer spending
has also been increased by 41.0%. It means it was doubled. Spending on U.S. made Goods
increased by 31.1 %, where consumption of Durable Goods grew by 82.7 %. The final sales of
goods and services has been increased to 25.9% to July to September period in the year 2019.
The economy has grown because of it (Burke, Stern and Bruns, 2018).
2. Use of economic theory and data to explore Amazon macroeconomic, market and cost
vulnerability by comparing with another organisation
Aggregate demand and supply: Aggregate demand is influenced by economic decisions which
can be public or private. Another is that prices respond to slow change in supply and demand and
last is change in aggregate demand have effect on shirt run output and employment but not on
price. AD and AS explains the short term fluctuations in the real GDP along with the price level.
SRAS curve shows the relationship between the short run among the price level and quantity of
the real GDP supplied by the entities.
Macroeconomic exposure
GDP: Amazon has created an economic ripple effects which leads to the going beyond
the customer's wallet. Amazon has a direct or indirect impact on the inflation, employment and
⊘ This is a preview!⊘
Do you want full access?
Subscribe today to unlock all pages.
Trusted by 1+ million students worldwide
the investment. From the macro side, the higher the consumer spendings is a good sign as it
results into contributing towards the GDP. On the consumer spending on Amazon is currently
not a significant enough to tip the GDP scale but it can be possible in the future. In the 2017, the
Amazon's market share of 37% in the US retail e-commerce business segment. Aggregate supply
(AS), refers to the total quantity of output the firm will produce or sell which is considered as the
real GDP.
Exchange rate: The cost of shipping of products from one place to another is the major
cost that is being incurred to Amazon. The net sales which is being generated from its
subsidiaries makes use of its local currencies as their functional currencies. Therefore, this
results into fluctuations as the financial outcomes of the foreign subsidiaries is translated into
the US dollars while doing consolidation. Thus, as the exchange rate varies the overall outcome
of the net sales and other operating outcomes may differ materially in comparison to the
expectations. Therefore, this is one of the exposure being faced by Amazon.
Minimum wage legislation: As per the federal minimum wage for the non-exempt
employees is $7.25 on hourly basis. But many also have minimum wage legislation, in case
where the employee is subject to the state as well as the federal laws, then in that case, that
employee is subjected yo the higher of the two minimum wages. This results into looking at the
rise in the wages of the Amazon employees which results into Amazon working on cutting its
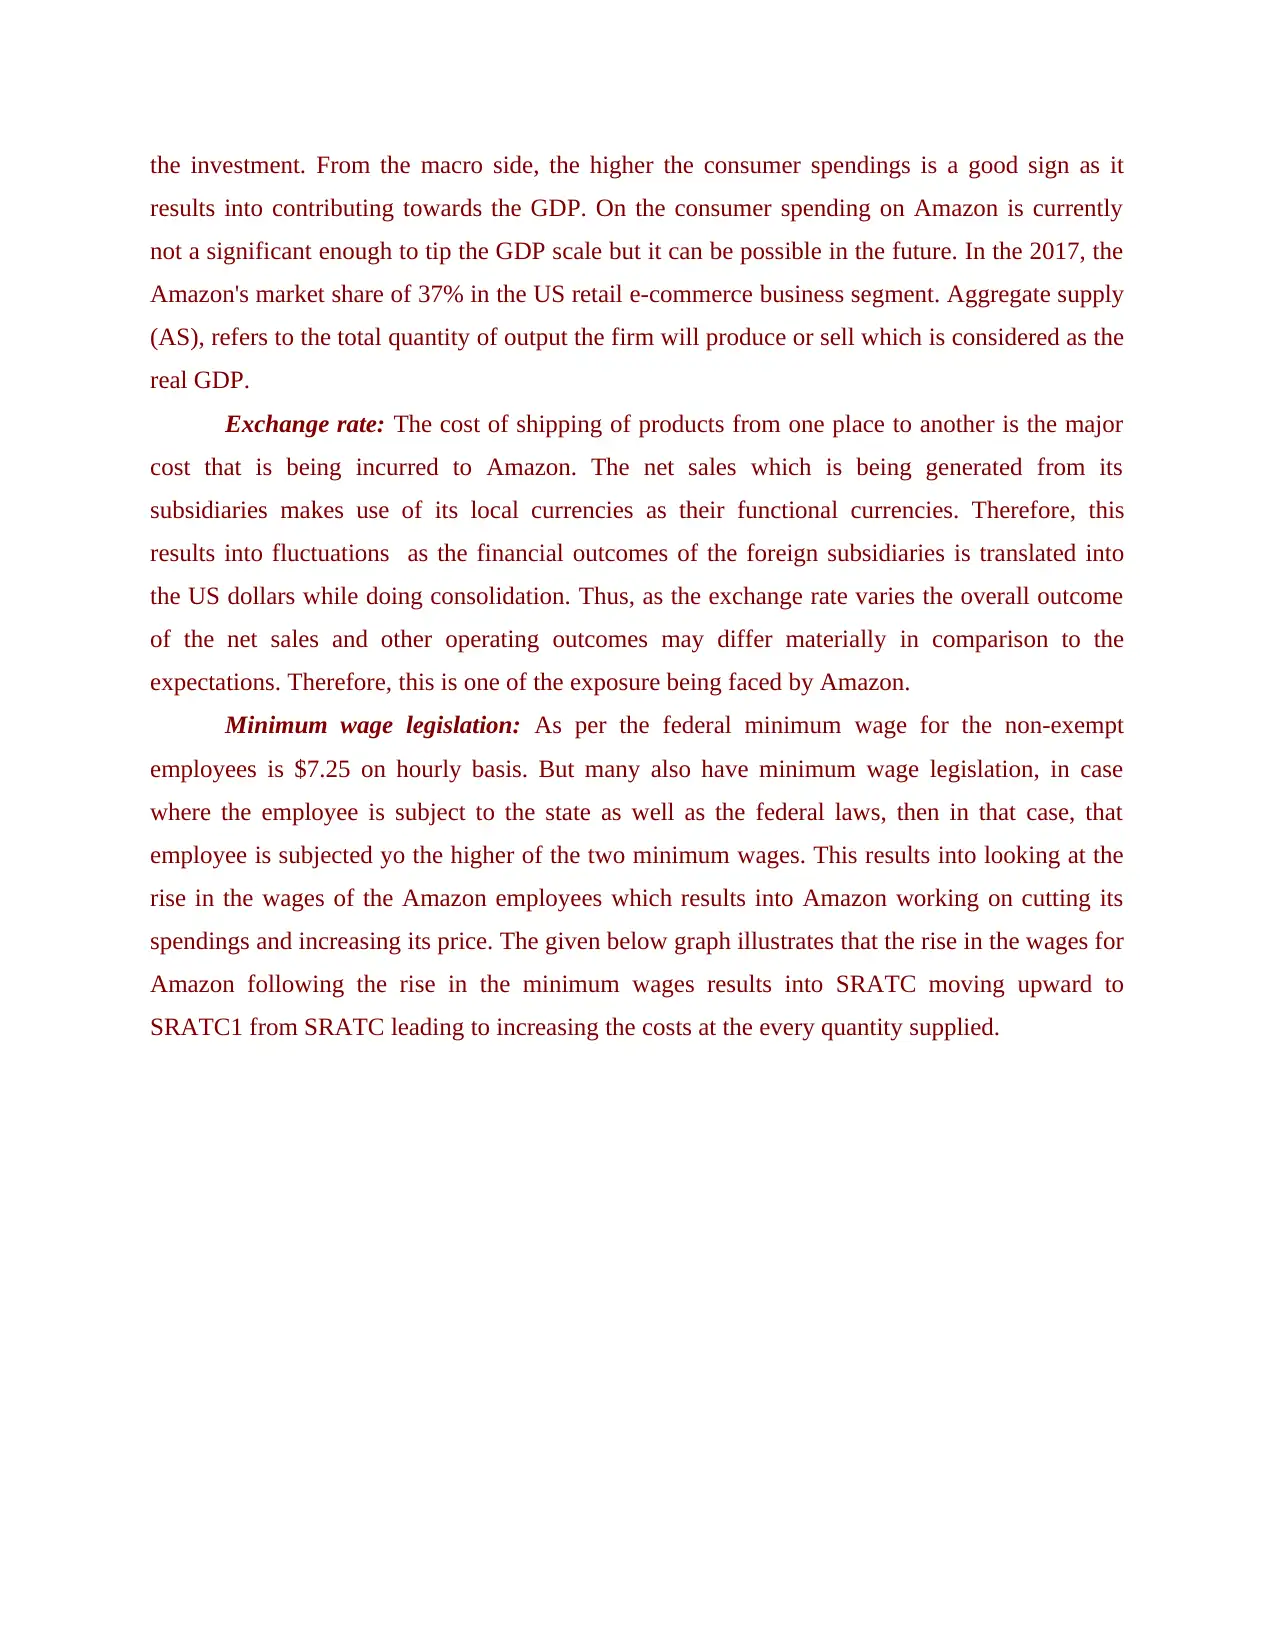
spendings and increasing its price. The given below graph illustrates that the rise in the wages for
Amazon following the rise in the minimum wages results into SRATC moving upward to
SRATC1 from SRATC leading to increasing the costs at the every quantity supplied.
results into contributing towards the GDP. On the consumer spending on Amazon is currently
not a significant enough to tip the GDP scale but it can be possible in the future. In the 2017, the
Amazon's market share of 37% in the US retail e-commerce business segment. Aggregate supply
(AS), refers to the total quantity of output the firm will produce or sell which is considered as the
real GDP.
Exchange rate: The cost of shipping of products from one place to another is the major
cost that is being incurred to Amazon. The net sales which is being generated from its
subsidiaries makes use of its local currencies as their functional currencies. Therefore, this
results into fluctuations as the financial outcomes of the foreign subsidiaries is translated into
the US dollars while doing consolidation. Thus, as the exchange rate varies the overall outcome
of the net sales and other operating outcomes may differ materially in comparison to the
expectations. Therefore, this is one of the exposure being faced by Amazon.
Minimum wage legislation: As per the federal minimum wage for the non-exempt
employees is $7.25 on hourly basis. But many also have minimum wage legislation, in case
where the employee is subject to the state as well as the federal laws, then in that case, that
employee is subjected yo the higher of the two minimum wages. This results into looking at the
rise in the wages of the Amazon employees which results into Amazon working on cutting its
spendings and increasing its price. The given below graph illustrates that the rise in the wages for
Amazon following the rise in the minimum wages results into SRATC moving upward to
SRATC1 from SRATC leading to increasing the costs at the every quantity supplied.
Paraphrase This Document
Need a fresh take? Get an instant paraphrase of this document with our AI Paraphraser
Illus
tration 1: Impact of a rise in Minimum wages on Amazon's SRATC
Non-economic exposure
Political dependency: The current political situation of US will create a non-economic
risk exposure for the company and its major competitors like Walmart, Alibaba are also exposed
to the same level of risk. The change in the political structure will result into affecting the rules
and regulation pertaining to the logistics and the supply chain of the products and services.
Tax shaming: As these organizations are having a very complex taxation system and
along with this, they have worked on implementing the practices which has resulted into tax
avoidance. The Amazon in UK had a sales of £3.35bn in the year 2011 only disclosed the tax
expense of £1.8 m. This has resulted into impacting the brand image of the company. Not only
just the Amazon, but its core competitors like Walmart and Alibaba has affected the resulting
outcome. The bribery case pertaining to the Foreign Corrupt Practices Act charged over the
Walmart which defines prohibition on paying bribes to the foreign officials. This resulted into
increase in the demand of the Amazon of the goods in comparison to the Walmart.
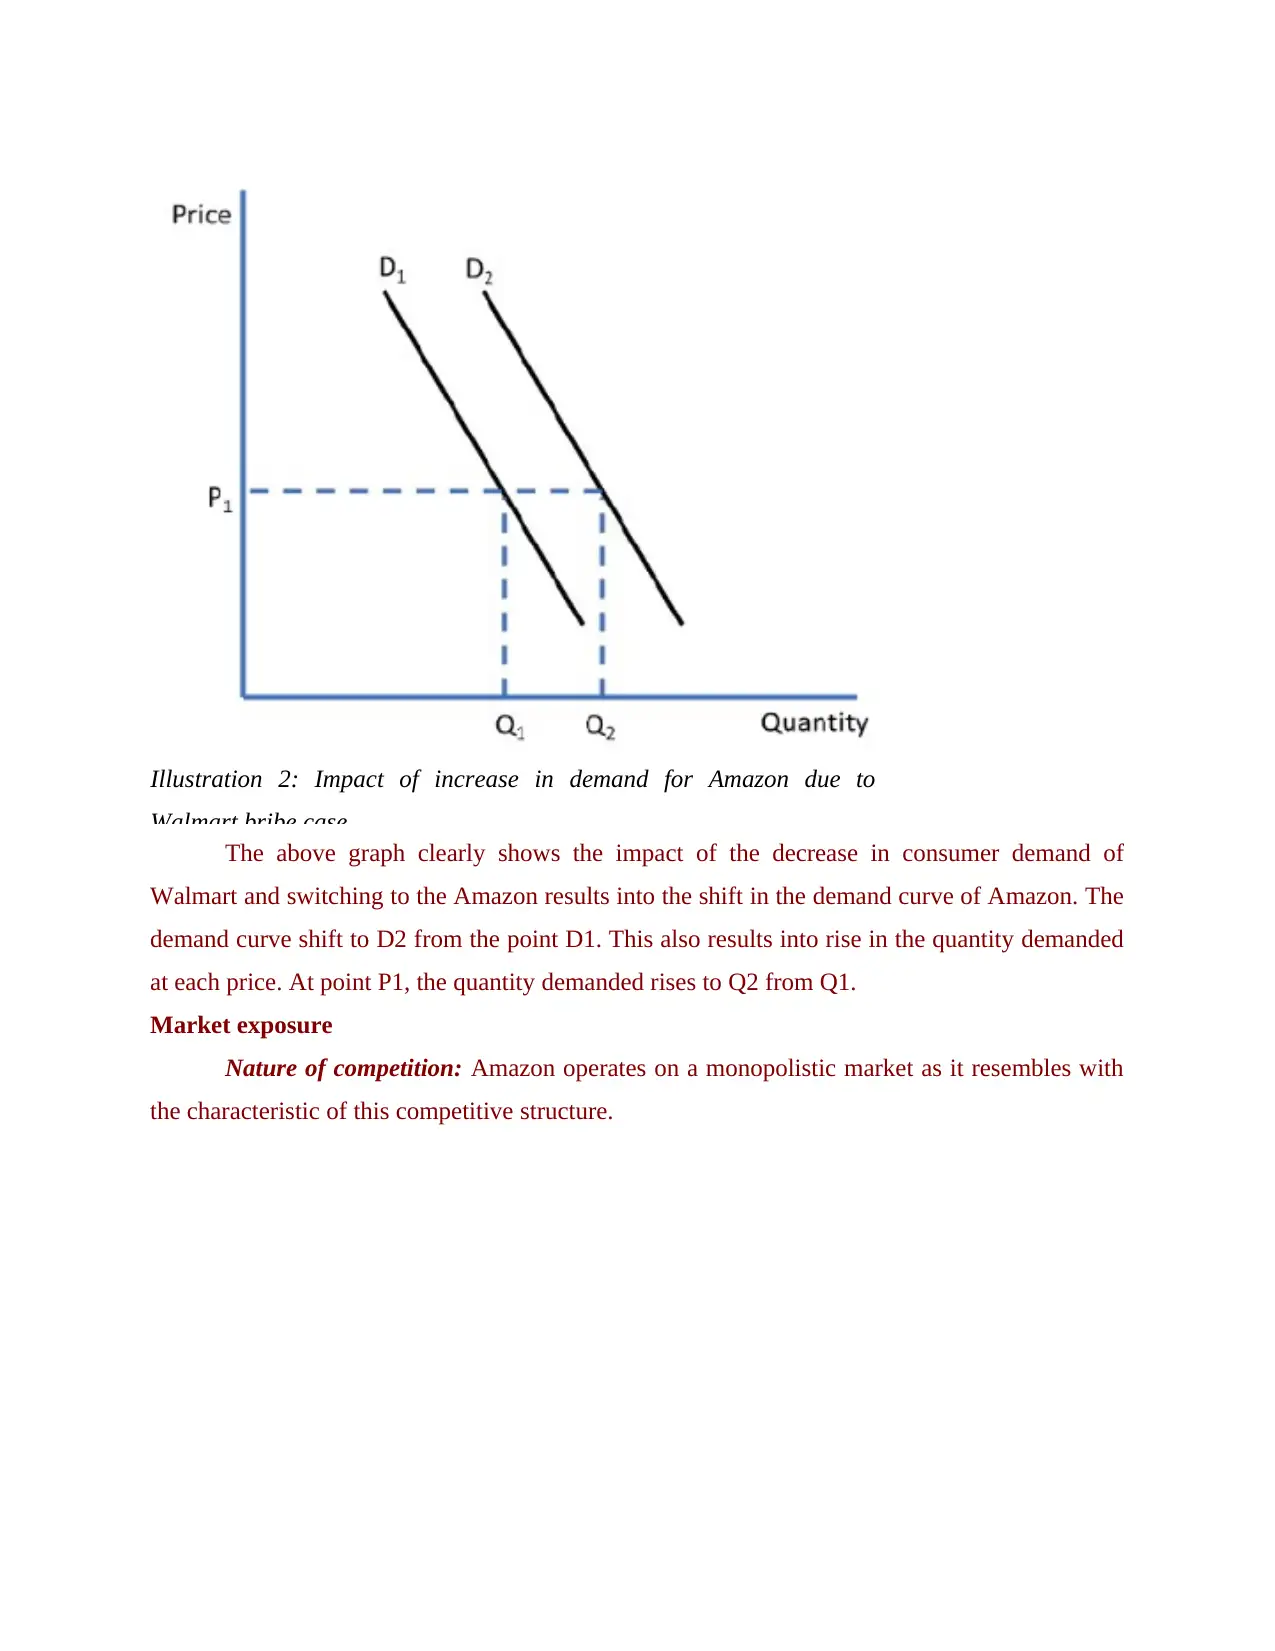
Illustration 2: Impact of increase in demand for Amazon due to
Walmart bribe case
The above graph clearly shows the impact of the decrease in consumer demand of
Walmart and switching to the Amazon results into the shift in the demand curve of Amazon. The
demand curve shift to D2 from the point D1. This also results into rise in the quantity demanded
at each price. At point P1, the quantity demanded rises to Q2 from Q1.
Market exposure
Nature of competition: Amazon operates on a monopolistic market as it resembles with
the characteristic of this competitive structure.
⊘ This is a preview!⊘
Do you want full access?
Subscribe today to unlock all pages.
Trusted by 1+ million students worldwide
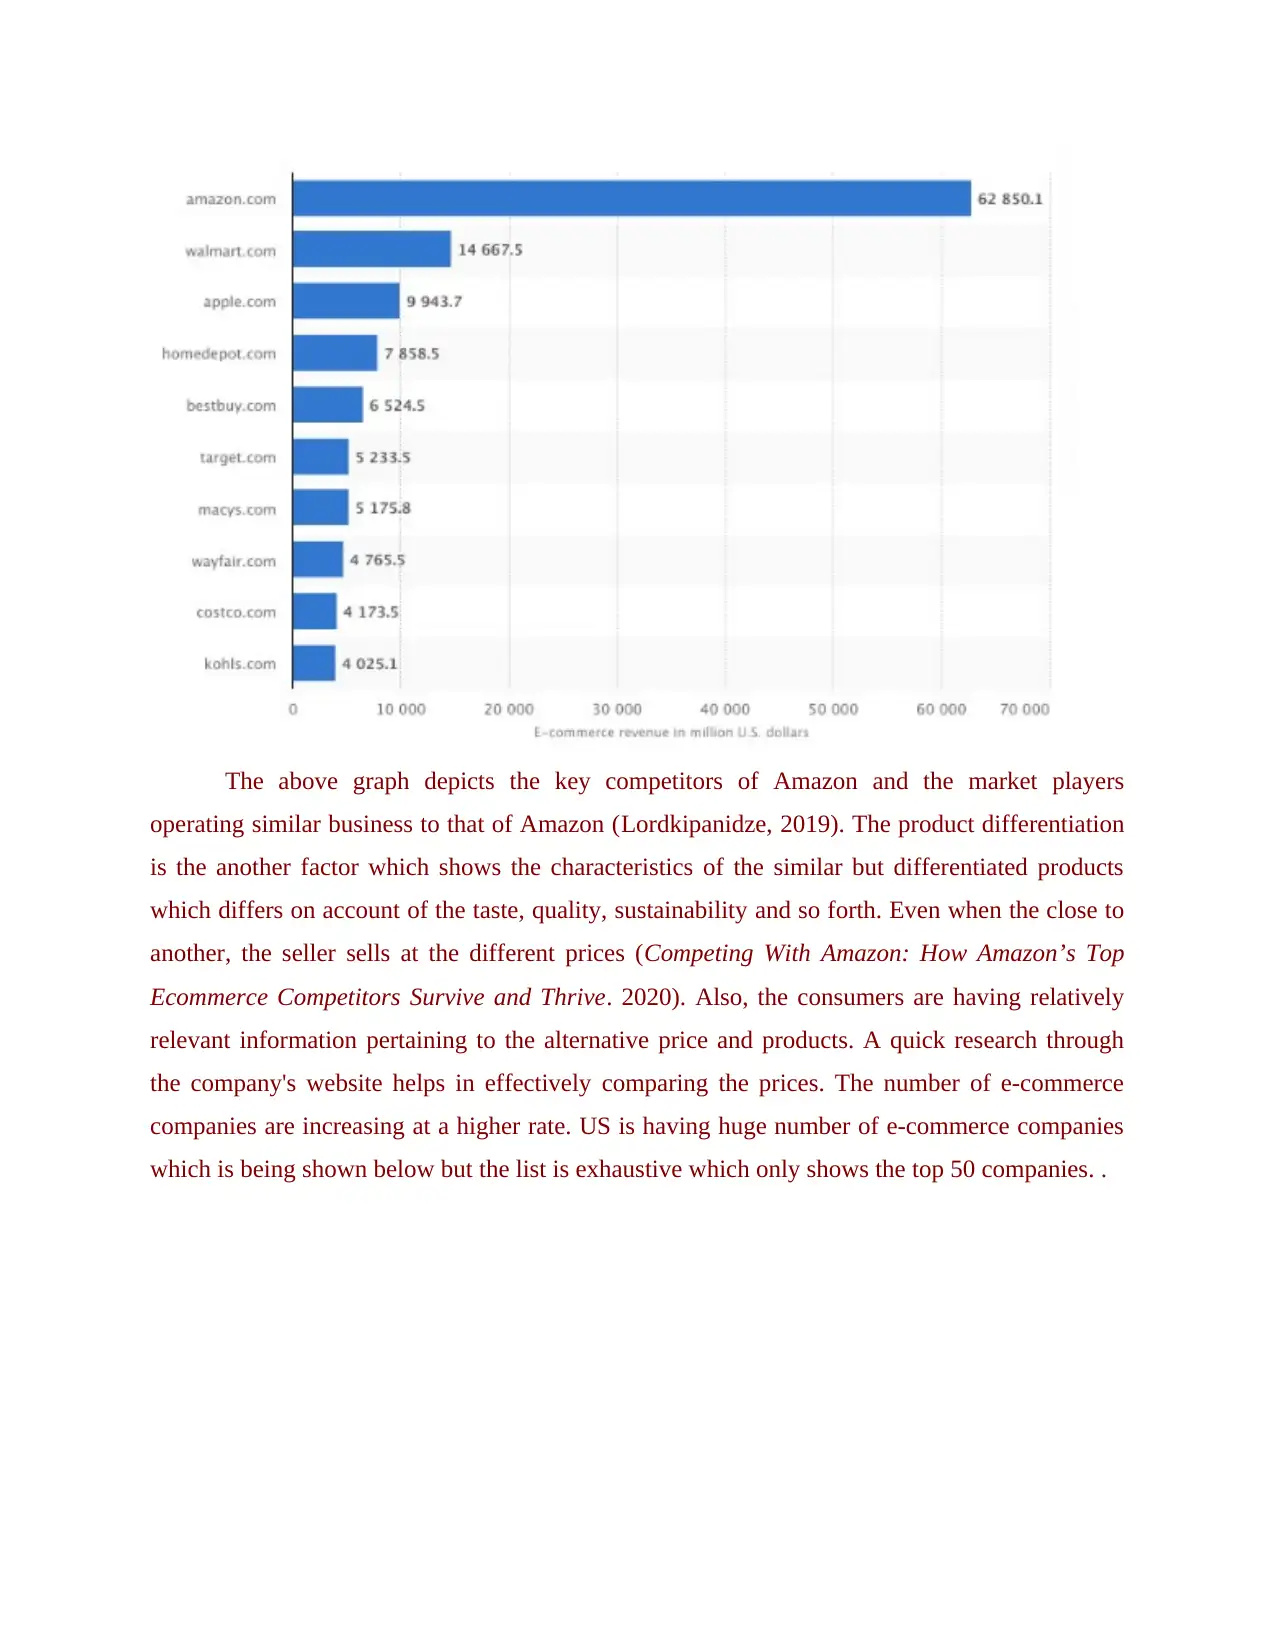
The above graph depicts the key competitors of Amazon and the market players
operating similar business to that of Amazon (Lordkipanidze, 2019). The product differentiation
is the another factor which shows the characteristics of the similar but differentiated products
which differs on account of the taste, quality, sustainability and so forth. Even when the close to
another, the seller sells at the different prices (Competing With Amazon: How Amazon’s Top
Ecommerce Competitors Survive and Thrive. 2020). Also, the consumers are having relatively
relevant information pertaining to the alternative price and products. A quick research through
the company's website helps in effectively comparing the prices. The number of e-commerce
companies are increasing at a higher rate. US is having huge number of e-commerce companies
which is being shown below but the list is exhaustive which only shows the top 50 companies. .
Paraphrase This Document
Need a fresh take? Get an instant paraphrase of this document with our AI Paraphraser
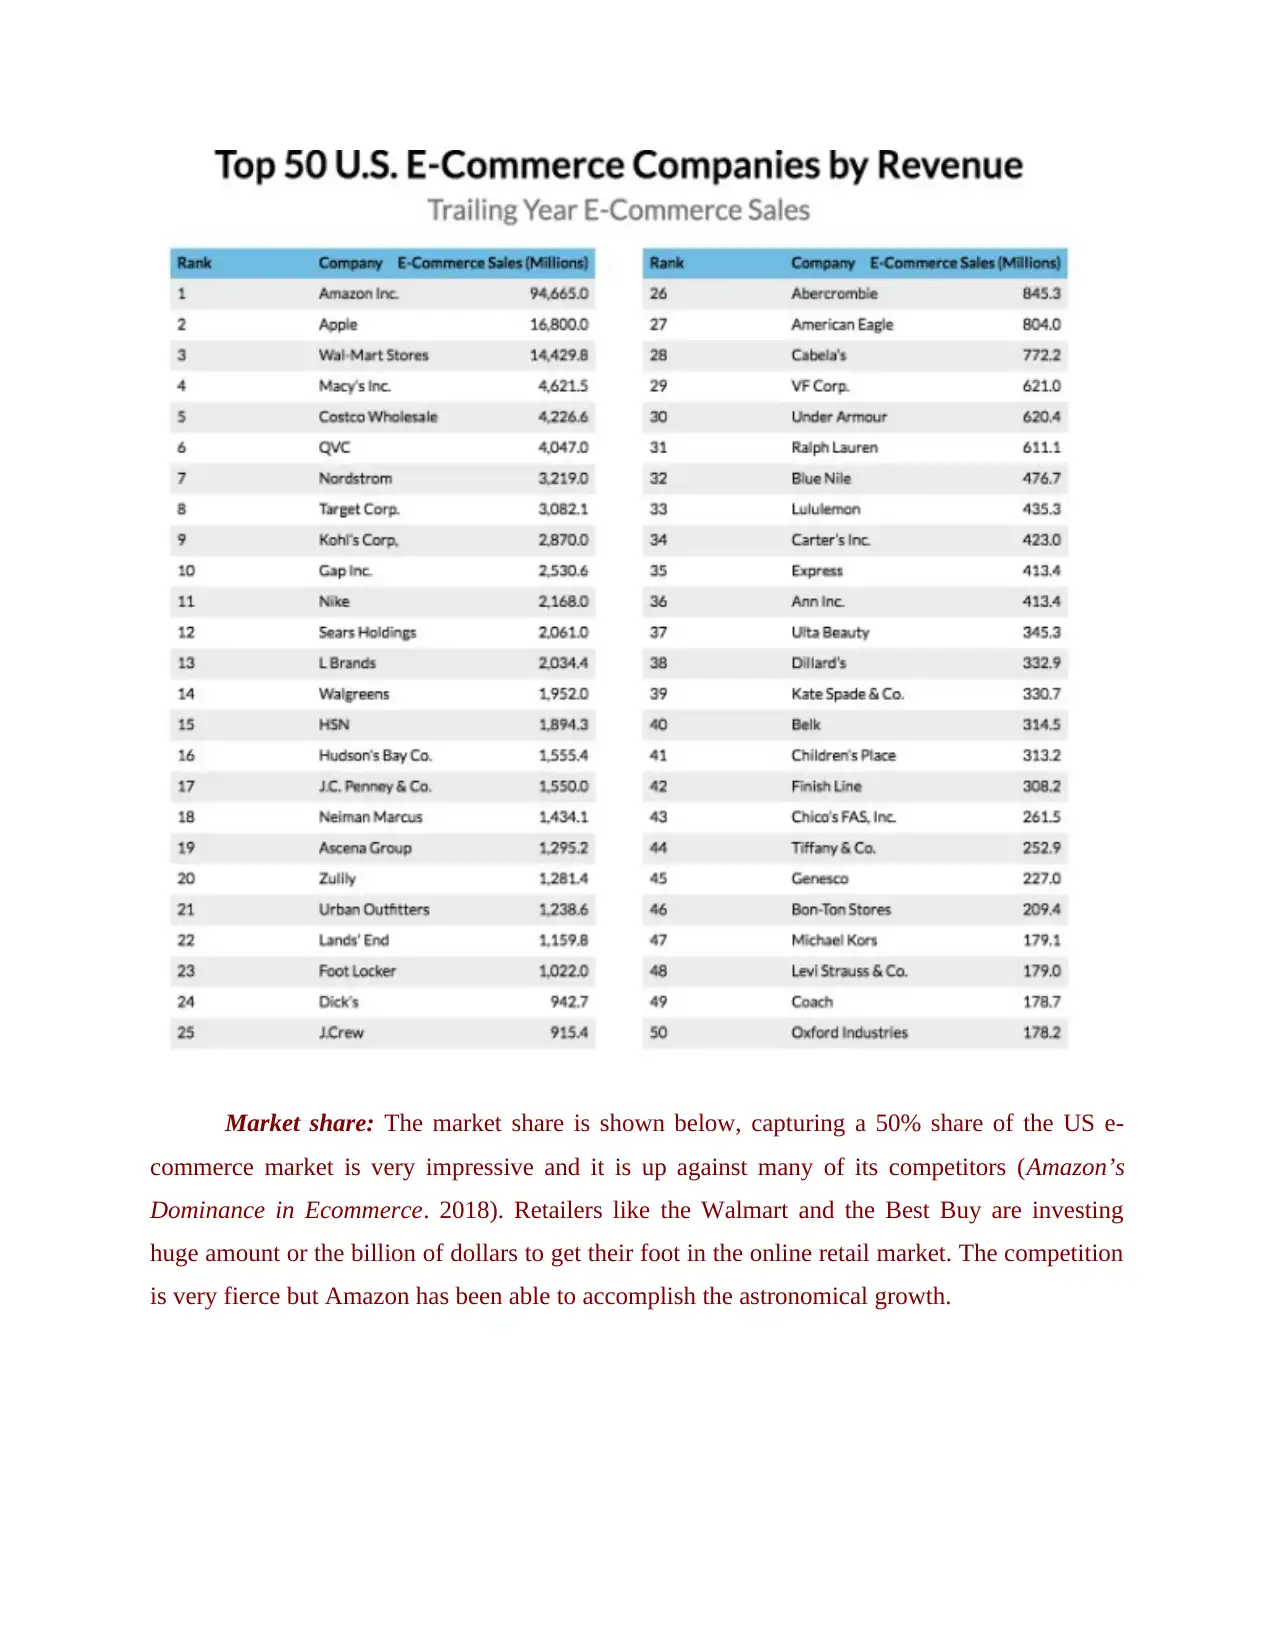
Market share: The market share is shown below, capturing a 50% share of the US e-
commerce market is very impressive and it is up against many of its competitors (Amazon’s
Dominance in Ecommerce. 2018). Retailers like the Walmart and the Best Buy are investing
huge amount or the billion of dollars to get their foot in the online retail market. The competition
is very fierce but Amazon has been able to accomplish the astronomical growth.
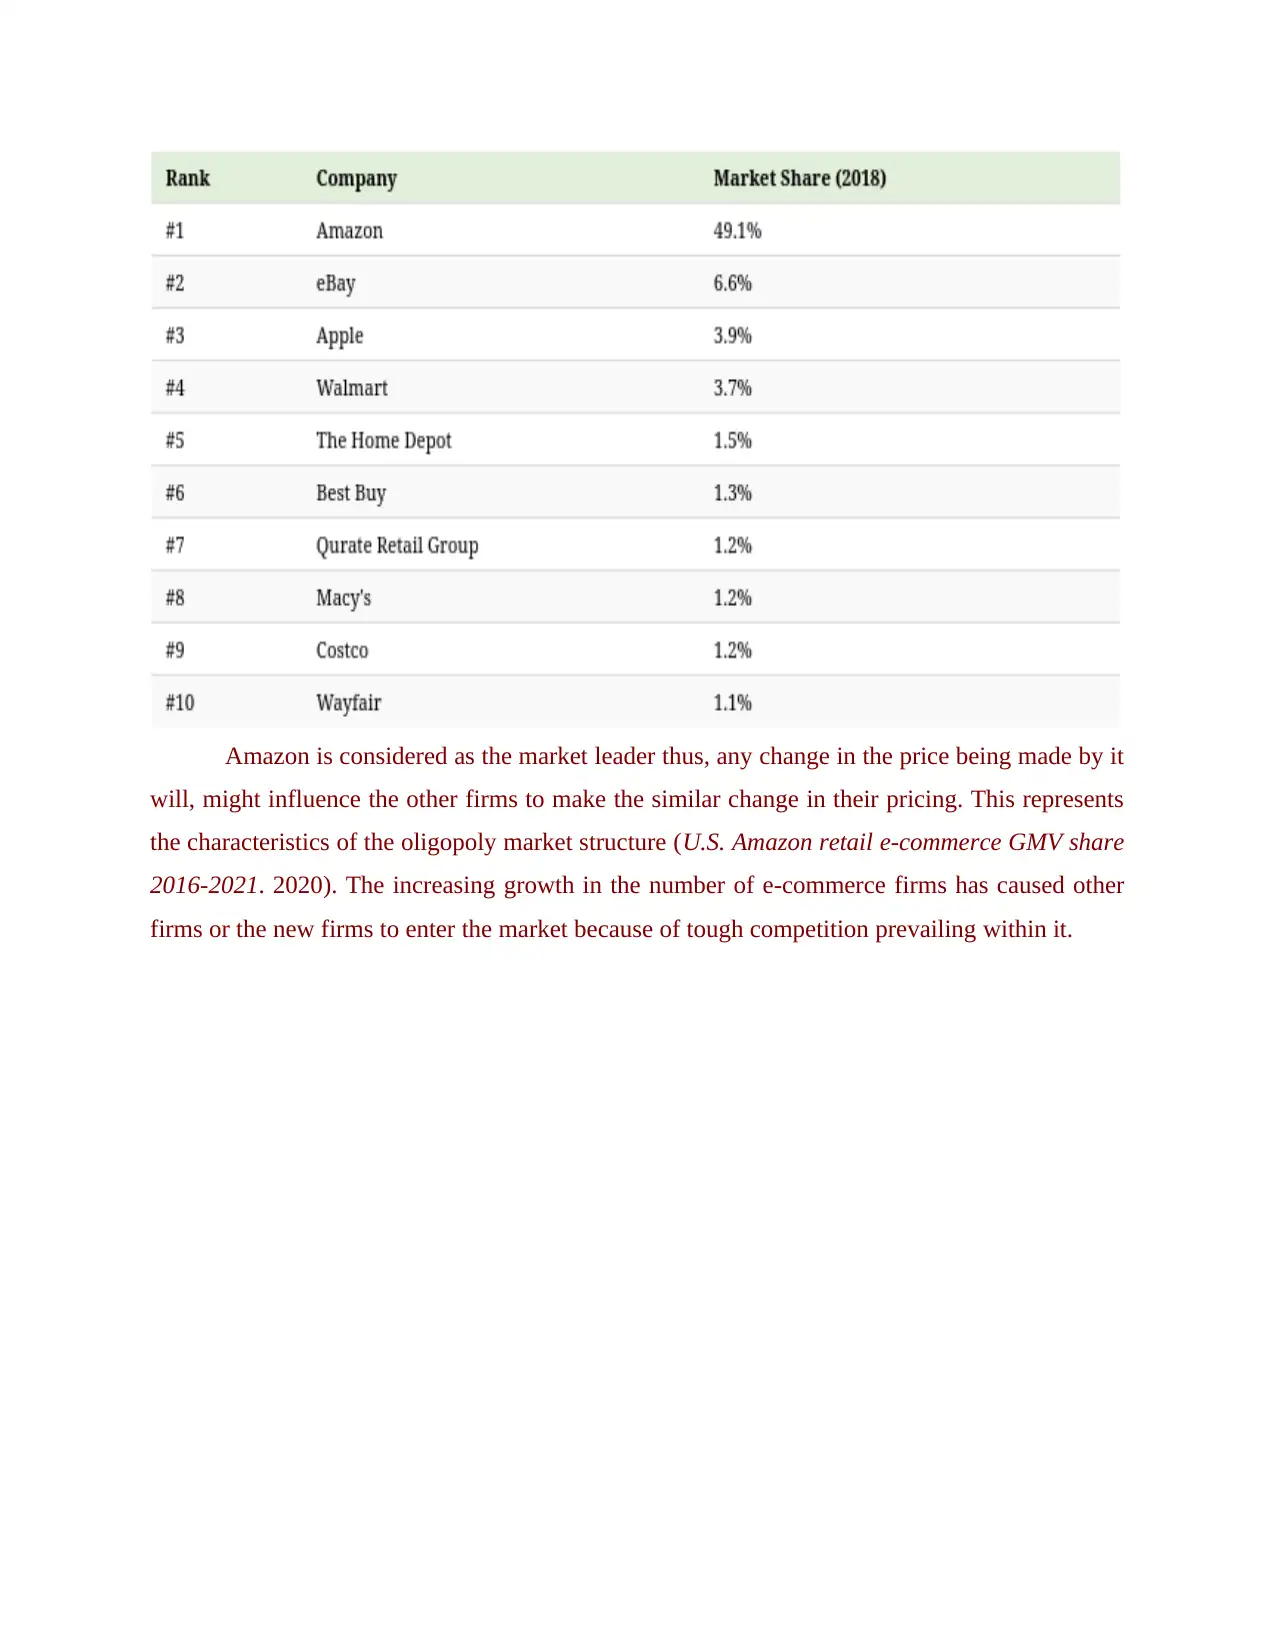
Amazon is considered as the market leader thus, any change in the price being made by it
will, might influence the other firms to make the similar change in their pricing. This represents
the characteristics of the oligopoly market structure (U.S. Amazon retail e-commerce GMV share
2016-2021. 2020). The increasing growth in the number of e-commerce firms has caused other
firms or the new firms to enter the market because of tough competition prevailing within it.
⊘ This is a preview!⊘
Do you want full access?
Subscribe today to unlock all pages.
Trusted by 1+ million students worldwide
1 out of 22
Related Documents


Your All-in-One AI-Powered Toolkit for Academic Success.
+13062052269
info@desklib.com
Available 24*7 on WhatsApp / Email
![[object Object]](/_next/static/media/star-bottom.7253800d.svg)
Unlock your academic potential
Copyright © 2020–2026 A2Z Services. All Rights Reserved. Developed and managed by ZUCOL.