Financial Statement Analysis of Amcor Corporation: A Detailed Report
VerifiedAdded on 2024/06/03
|9
|2373
|109
Report
AI Summary
This report provides a detailed financial analysis of Amcor Corporation from 2015 to 2017, focusing on the cash flow statement, other comprehensive income (OCI), and corporate tax. The cash flow analysis reveals trends in operating, investing, and financing activities, highlighting key receipts and payments. The OCI analysis examines exchange differences and their impact. The corporate tax calculation reconciles the reported income tax expense with the expected tax based on profit before tax, exploring deferred tax implications and adjustments. The analysis uses data sourced directly from Amcor's annual reports to provide a comprehensive overview of the company's financial performance during the specified period. Desklib offers a range of study tools, including solved assignments, to assist students in their academic pursuits.
Table of Contents
Introduction.................................................................................................................................................2
Significant analysis of Cash flow statement for Amcor...............................................................................2
Critical analysis of OCI...............................................................................................................................6
Calculation of Corporate tax........................................................................................................................7
References...................................................................................................................................................9
Paraphrase This Document
Need a fresh take? Get an instant paraphrase of this document with our AI Paraphraser
Introduction
This task is focused to understand and apprehend the annual report of a chosen company which
is listed in Ausralian stock exchange, the student has to source the annual report of the company
for a period of 3 years from 2015 to 2017 and then perform a detailed analysis using them. The
analysis is focused to present in detail the cash flow statement of the company and a comparative
analysis for those 3 years, the next part of the analysis is to perform an anlysis on the other
comprehensive income of the company and its impact in the income statement and then the last
task is to understand the income tax expense of the company and the tax paid by the
company.The company which is chosen for the study is Amcor Corporation, which is a leading
packaging company around the world, the company produces various packages, container and
custom made cartoons for various industries which includes food & beverages, medical aspects,
home care, personal care, beverages etc. The company has its head office in Victoria and
operates around the world, moreover the company employs more than 35,000 people and posted
revenue of more than 8.5 billion in sales.
Significant analysis of Cash flow statement for Amcor
.
The cash flow statement shall be treated as a full balance sheet and statement of financial
position account. The cash flow statement can be classified into categories such as cash flow
from operations, cash flow from investing activities, cash flow from financing activities and cash
flows. train. The main purpose of the cash flow statement is to provide more information and
information on total revenues and payments over a period of time, usually one year. This
statement helps the company understand the company's overall liquidity, evaluates periodic
credit quality, predicts future cash flows and seeks resources. The most important components of
the cash flow statement are mainly based on accounting resources based on comparisons
between revenue and expenses. (Brealy, 2011). It should be noted that the cash flow statement
contains only funds and cash funds that have been released. These statements generally exclude a
transaction that does not include money. The cash flow analysis generally differentiates the
company's liquidity funds and their uses during the three-year period: cash flow from operating
activities, cash flow from investing activities and cash flow from operations. cash flow related to
financing activities.
Based on the analysis of the cash flow statement of the company, it is noted that the opening
balance of cash as of 2015 is 505 million whereas it was 697 million in 2016 and in 2017 the
opening balance of cash was 513 million.
Cash from operating activities:
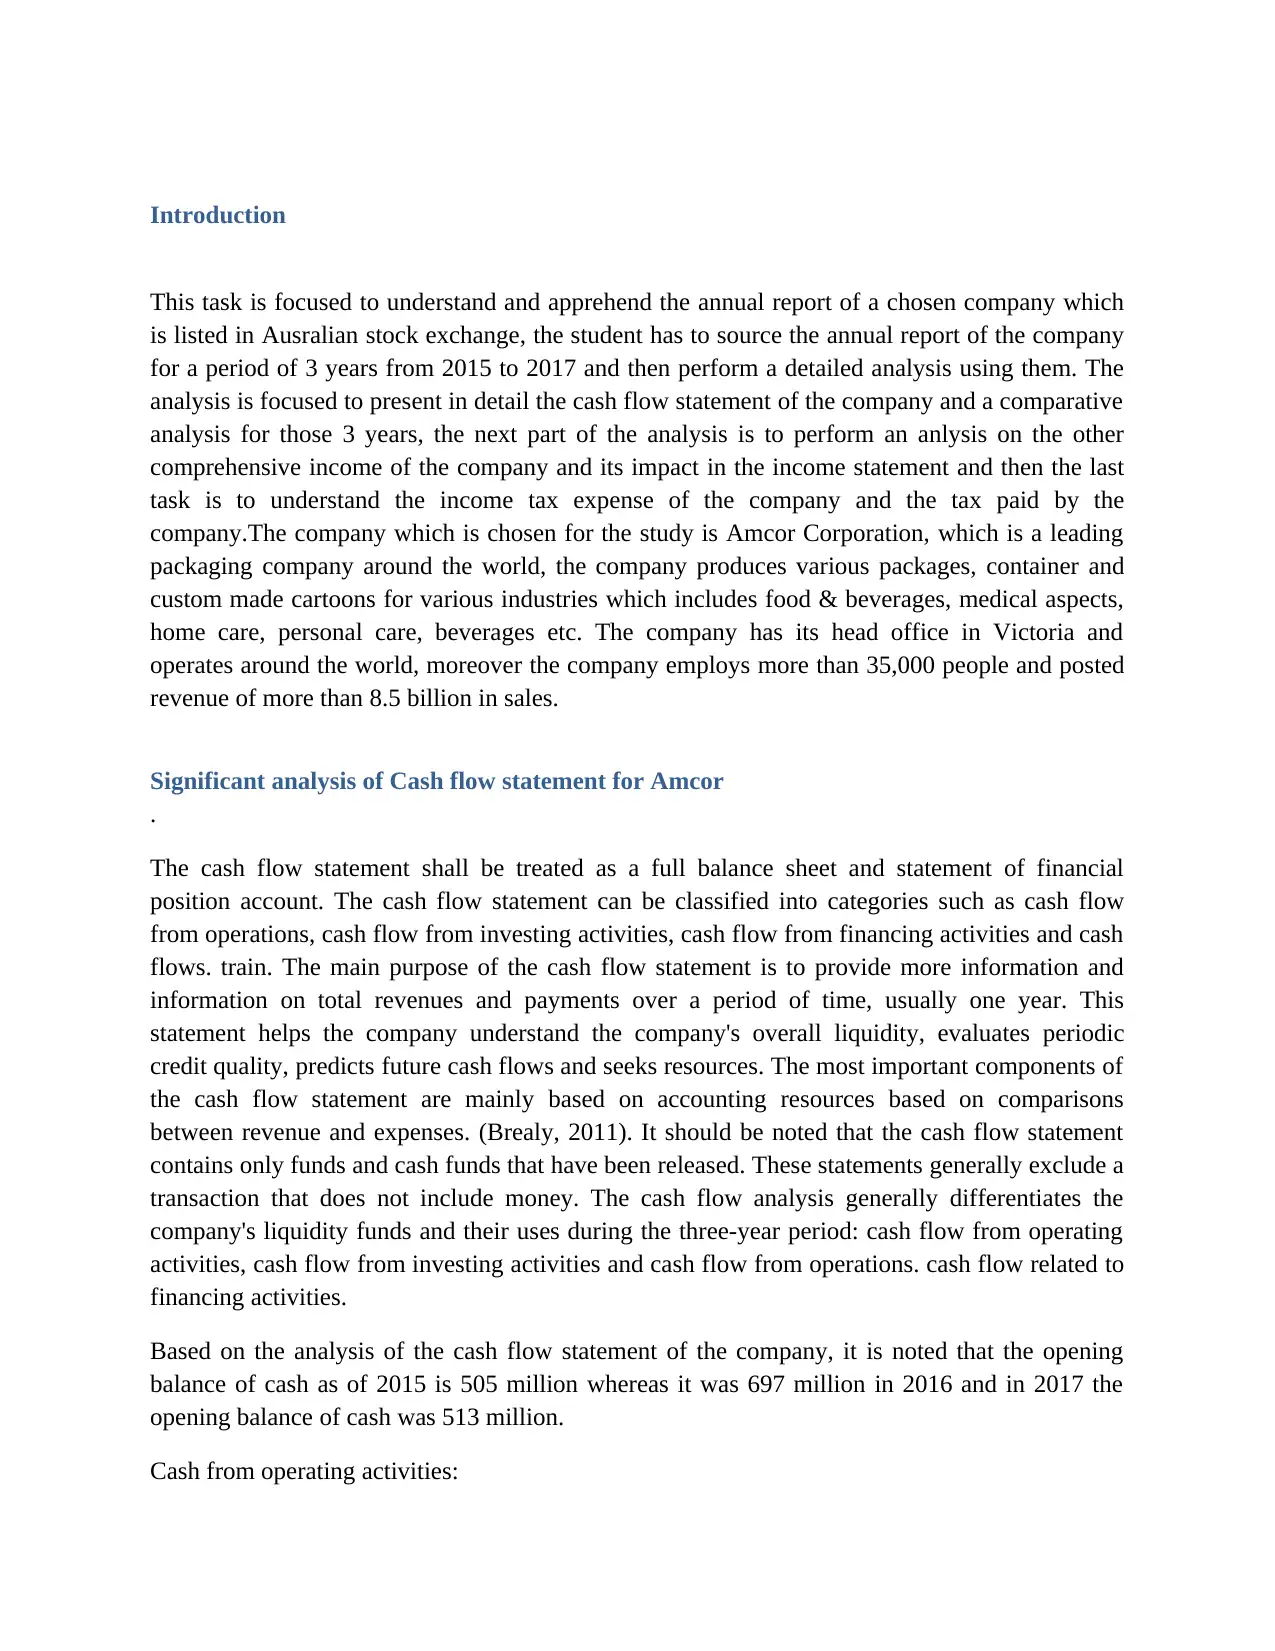
The cash from operating activities in the year 2015 was 1,002 million but it raised to 1,099
million in 2016 and in 2017 the overall cash from operating activities stood at 1,027 million.
(Amcor, 2017)
The main cash receipts of the company was from net profits generated by the business, this was
around 707 million in 2015, but in 2016 the profit reduced to a level of 273 million in 2016 but
in 2017 the profits increased to 614 million. The net finance cost is a higher expense which has
been identified in the operating activities, this is nearly 169 million in 2015, 167 million in 2016
and 187 million in 2017, this shows that the finance cost has increased from 2016 to 2017. The
depreciation and amortisation losses were around 376 million in 2015, increased to 390 million
in 2016 and reduced to a level of 387 million in 2017.
2015 2016 2017
Cash flow from the overall operating activities 1002.3 1099.4 1027.4
2015 2016 2017
940
960
980
1000
1020
1040
1060
1080
1100
1120
Cash flow from the overall operating
activities
Cash flow from the overall
operating activities
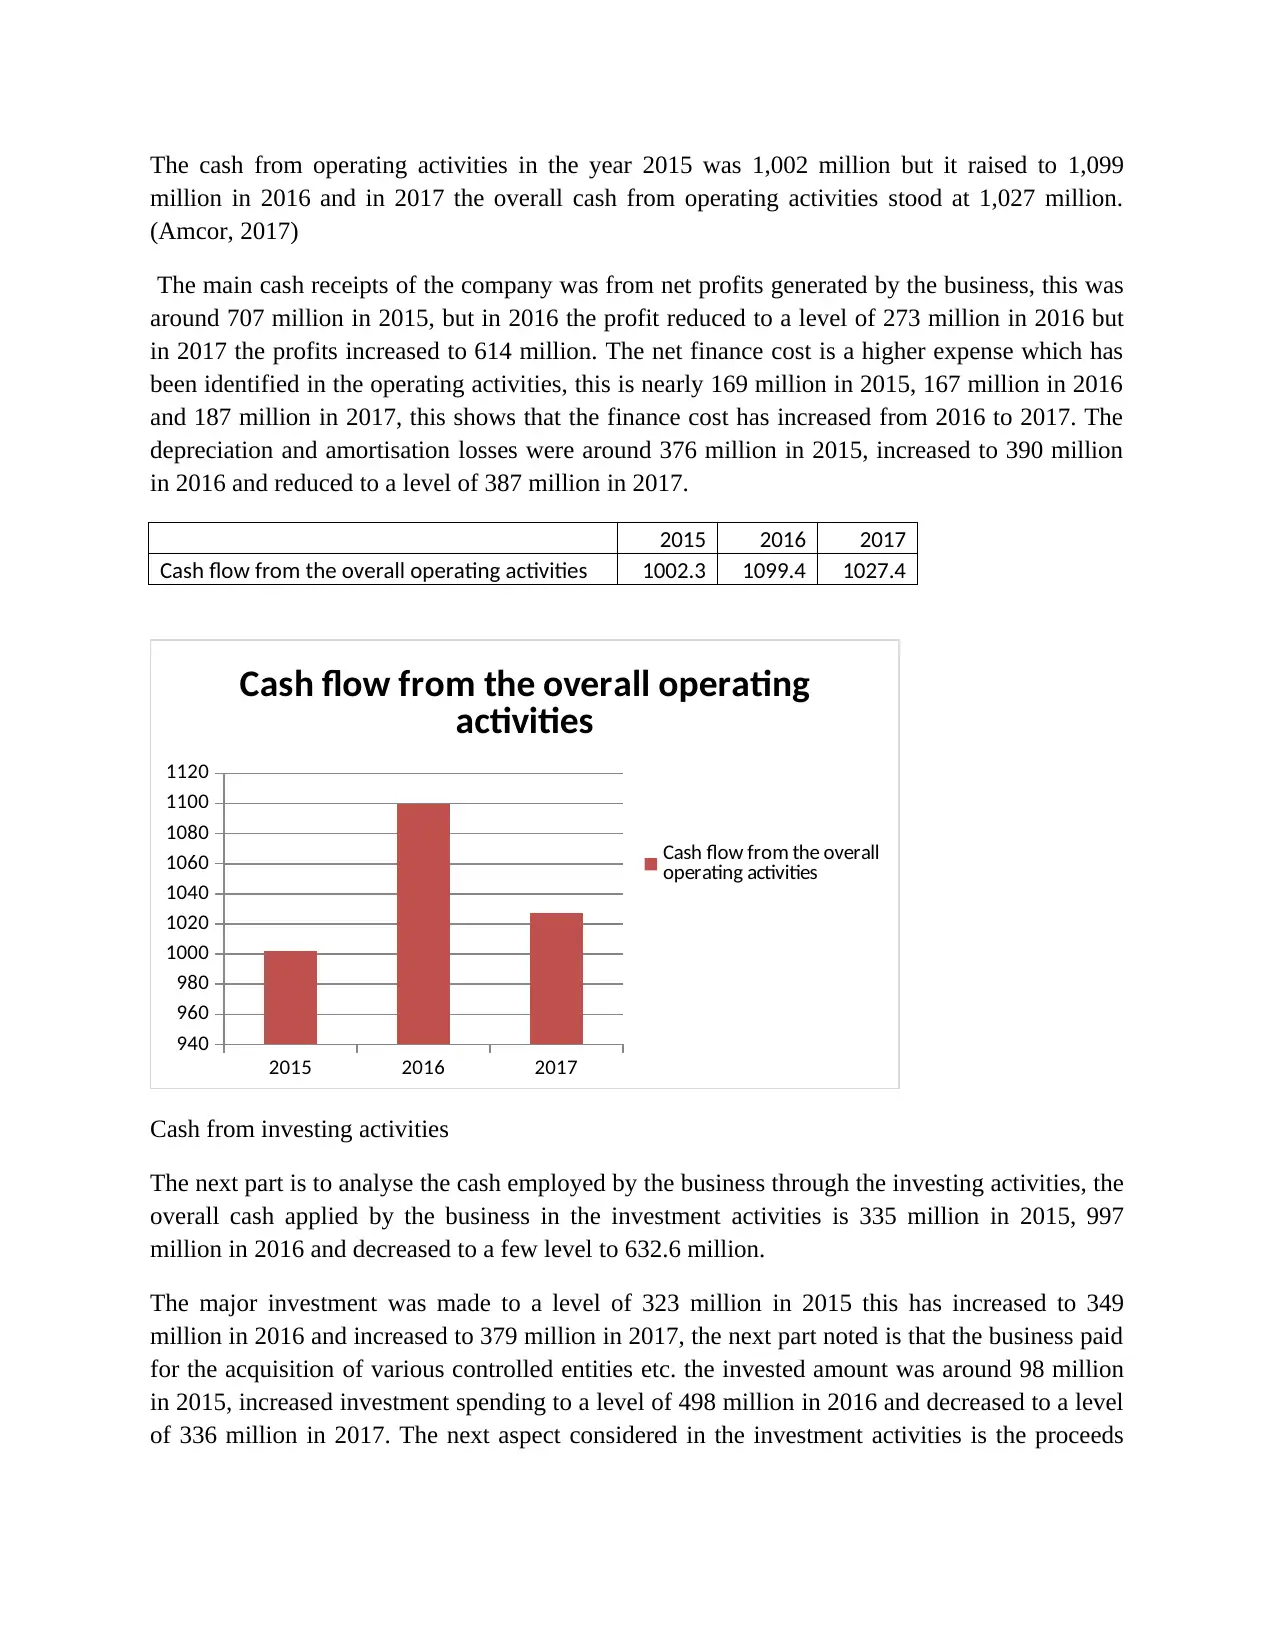
Cash from investing activities
The next part is to analyse the cash employed by the business through the investing activities, the
overall cash applied by the business in the investment activities is 335 million in 2015, 997
million in 2016 and decreased to a few level to 632.6 million.
The major investment was made to a level of 323 million in 2015 this has increased to 349
million in 2016 and increased to 379 million in 2017, the next part noted is that the business paid
for the acquisition of various controlled entities etc. the invested amount was around 98 million
in 2015, increased investment spending to a level of 498 million in 2016 and decreased to a level
of 336 million in 2017. The next aspect considered in the investment activities is the proceeds
million in 2016 and in 2017 the overall cash from operating activities stood at 1,027 million.
(Amcor, 2017)
The main cash receipts of the company was from net profits generated by the business, this was
around 707 million in 2015, but in 2016 the profit reduced to a level of 273 million in 2016 but
in 2017 the profits increased to 614 million. The net finance cost is a higher expense which has
been identified in the operating activities, this is nearly 169 million in 2015, 167 million in 2016
and 187 million in 2017, this shows that the finance cost has increased from 2016 to 2017. The
depreciation and amortisation losses were around 376 million in 2015, increased to 390 million
in 2016 and reduced to a level of 387 million in 2017.
2015 2016 2017
Cash flow from the overall operating activities 1002.3 1099.4 1027.4
2015 2016 2017
940
960
980
1000
1020
1040
1060
1080
1100
1120
Cash flow from the overall operating
activities
Cash flow from the overall
operating activities
Cash from investing activities
The next part is to analyse the cash employed by the business through the investing activities, the
overall cash applied by the business in the investment activities is 335 million in 2015, 997
million in 2016 and decreased to a few level to 632.6 million.
The major investment was made to a level of 323 million in 2015 this has increased to 349
million in 2016 and increased to 379 million in 2017, the next part noted is that the business paid
for the acquisition of various controlled entities etc. the invested amount was around 98 million
in 2015, increased investment spending to a level of 498 million in 2016 and decreased to a level
of 336 million in 2017. The next aspect considered in the investment activities is the proceeds
⊘ This is a preview!⊘
Do you want full access?
Subscribe today to unlock all pages.
Trusted by 1+ million students worldwide
generate from the sale of assets which was 83 million in 2015 decreased in the year 2016 to a
level of 30 million and again increased to 82 million in 2016
2015 2016 2017
Cash flow from the overall Investment activities 335 997 633
2015 2016 2017
0
200
400
600
800
1000
1200
Cash flow from the overall
Investment activities
Cash flow from the overall
Investment activities
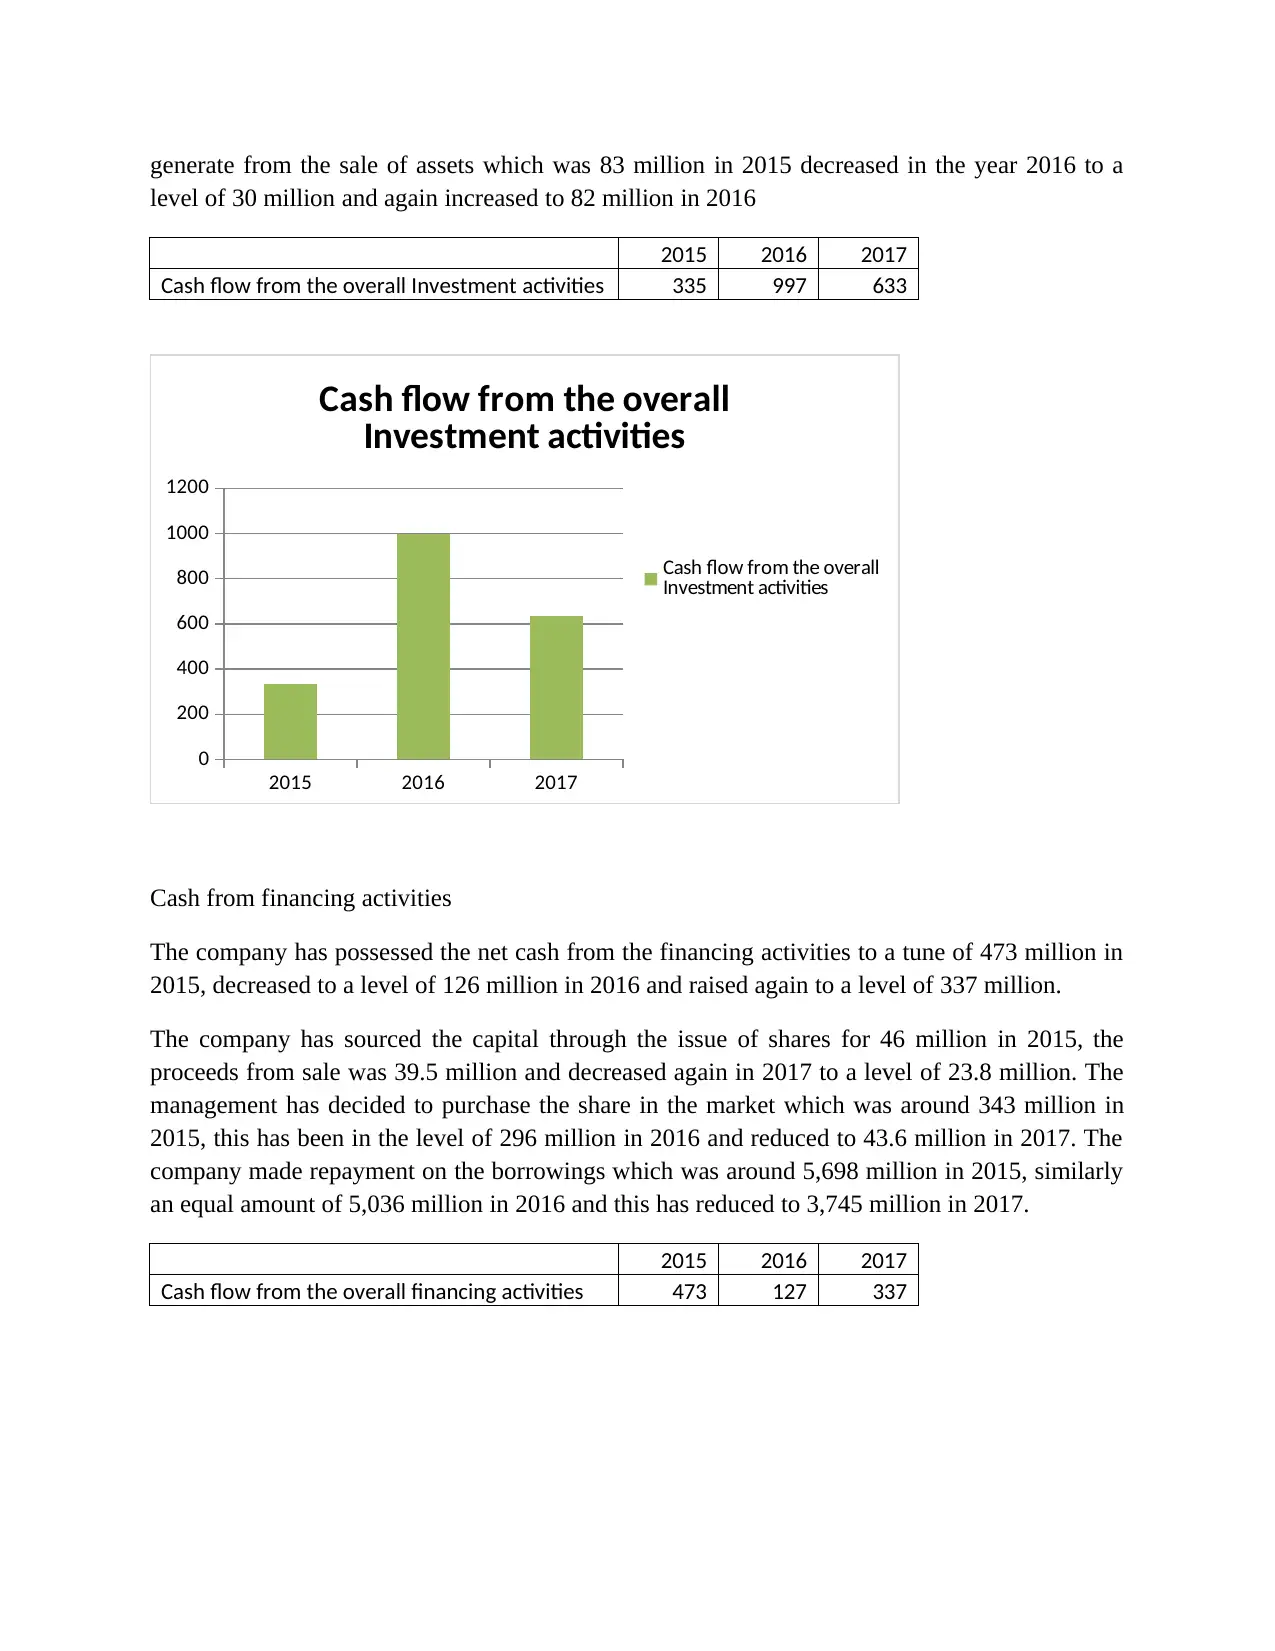
Cash from financing activities
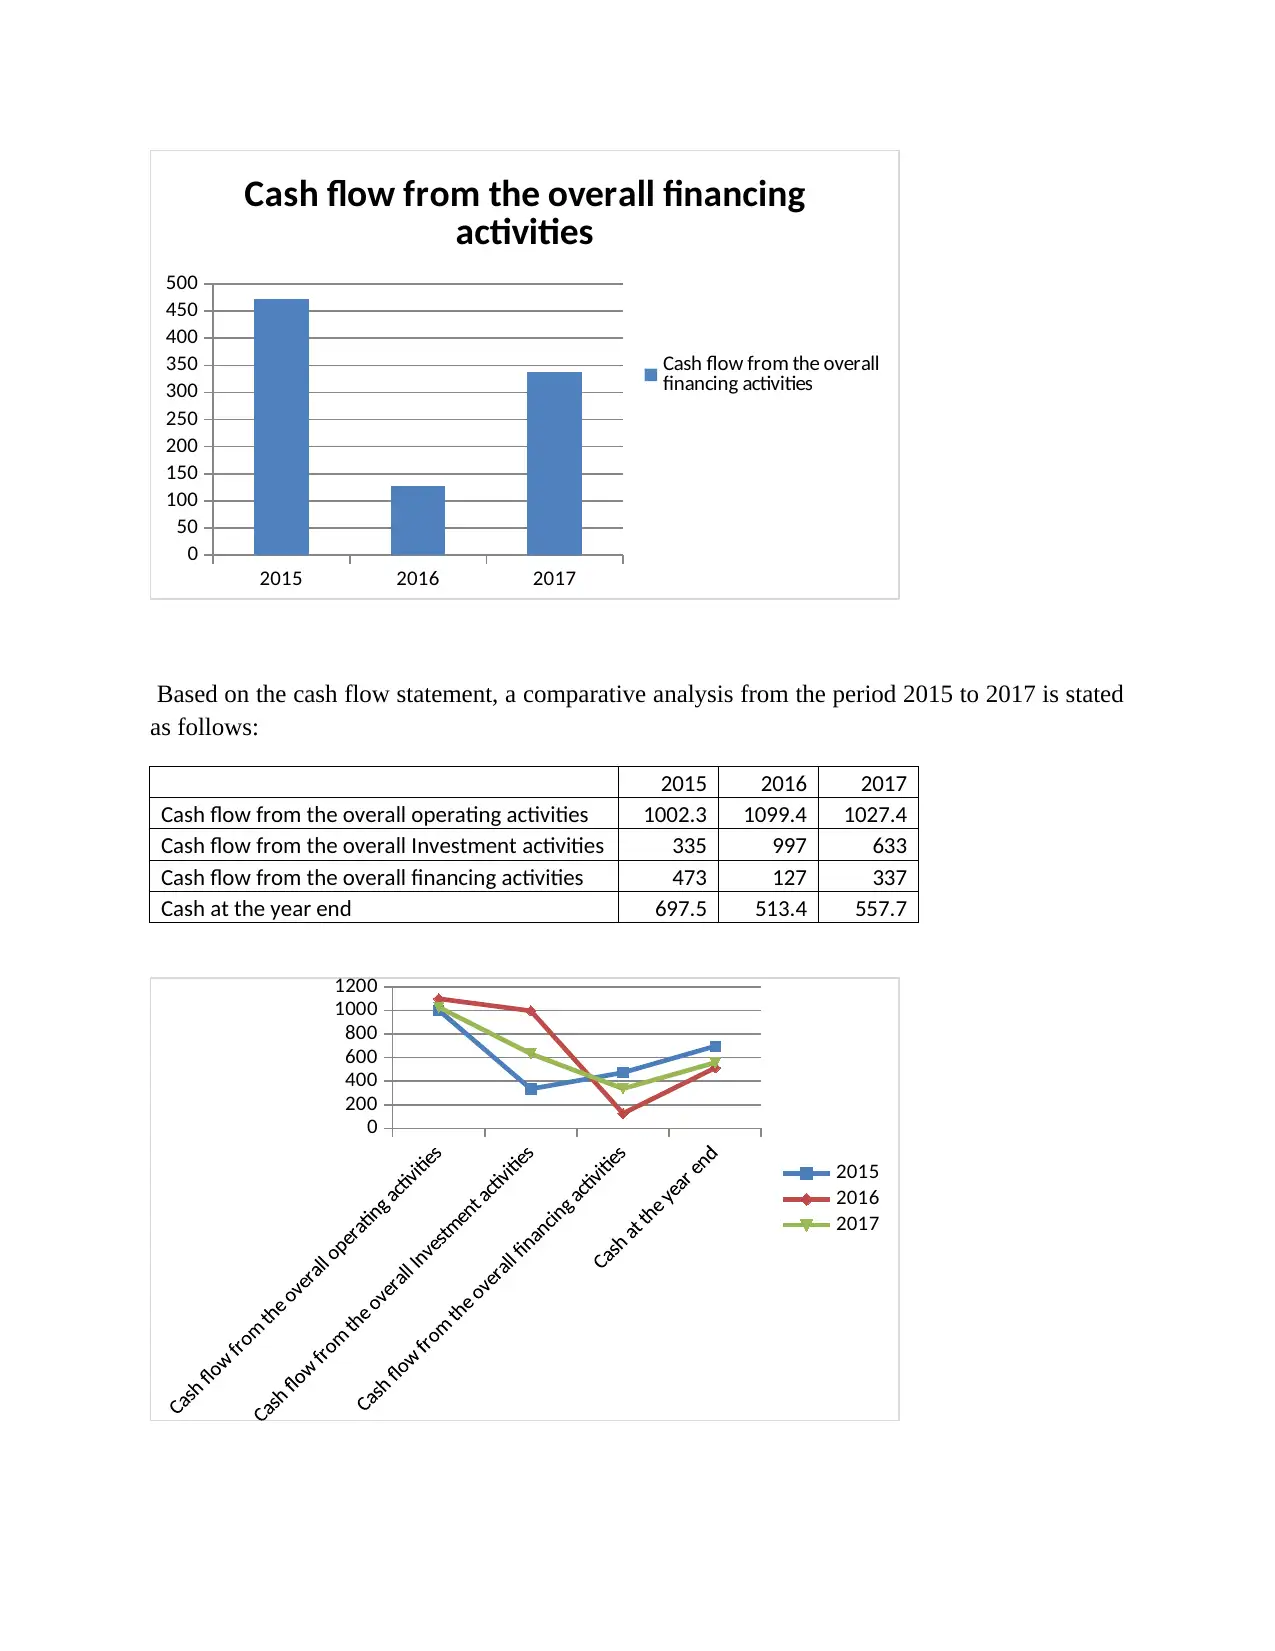
The company has possessed the net cash from the financing activities to a tune of 473 million in
2015, decreased to a level of 126 million in 2016 and raised again to a level of 337 million.
The company has sourced the capital through the issue of shares for 46 million in 2015, the
proceeds from sale was 39.5 million and decreased again in 2017 to a level of 23.8 million. The
management has decided to purchase the share in the market which was around 343 million in
2015, this has been in the level of 296 million in 2016 and reduced to 43.6 million in 2017. The
company made repayment on the borrowings which was around 5,698 million in 2015, similarly
an equal amount of 5,036 million in 2016 and this has reduced to 3,745 million in 2017.
2015 2016 2017
Cash flow from the overall financing activities 473 127 337
level of 30 million and again increased to 82 million in 2016
2015 2016 2017
Cash flow from the overall Investment activities 335 997 633
2015 2016 2017
0
200
400
600
800
1000
1200
Cash flow from the overall
Investment activities
Cash flow from the overall
Investment activities
Cash from financing activities
The company has possessed the net cash from the financing activities to a tune of 473 million in
2015, decreased to a level of 126 million in 2016 and raised again to a level of 337 million.
The company has sourced the capital through the issue of shares for 46 million in 2015, the
proceeds from sale was 39.5 million and decreased again in 2017 to a level of 23.8 million. The
management has decided to purchase the share in the market which was around 343 million in
2015, this has been in the level of 296 million in 2016 and reduced to 43.6 million in 2017. The
company made repayment on the borrowings which was around 5,698 million in 2015, similarly
an equal amount of 5,036 million in 2016 and this has reduced to 3,745 million in 2017.
2015 2016 2017
Cash flow from the overall financing activities 473 127 337
Paraphrase This Document
Need a fresh take? Get an instant paraphrase of this document with our AI Paraphraser
2015 2016 2017
0
50
100
150
200
250
300
350
400
450
500
Cash flow from the overall financing
activities
Cash flow from the overall
financing activities
Based on the cash flow statement, a comparative analysis from the period 2015 to 2017 is stated
as follows:
2015 2016 2017
Cash flow from the overall operating activities 1002.3 1099.4 1027.4
Cash flow from the overall Investment activities 335 997 633
Cash flow from the overall financing activities 473 127 337
Cash at the year end 697.5 513.4 557.7
0
200
400
600
800
1000
1200
2015
2016
2017
0
50
100
150
200
250
300
350
400
450
500
Cash flow from the overall financing
activities
Cash flow from the overall
financing activities
Based on the cash flow statement, a comparative analysis from the period 2015 to 2017 is stated
as follows:
2015 2016 2017
Cash flow from the overall operating activities 1002.3 1099.4 1027.4
Cash flow from the overall Investment activities 335 997 633
Cash flow from the overall financing activities 473 127 337
Cash at the year end 697.5 513.4 557.7
0
200
400
600
800
1000
1200
2015
2016
2017
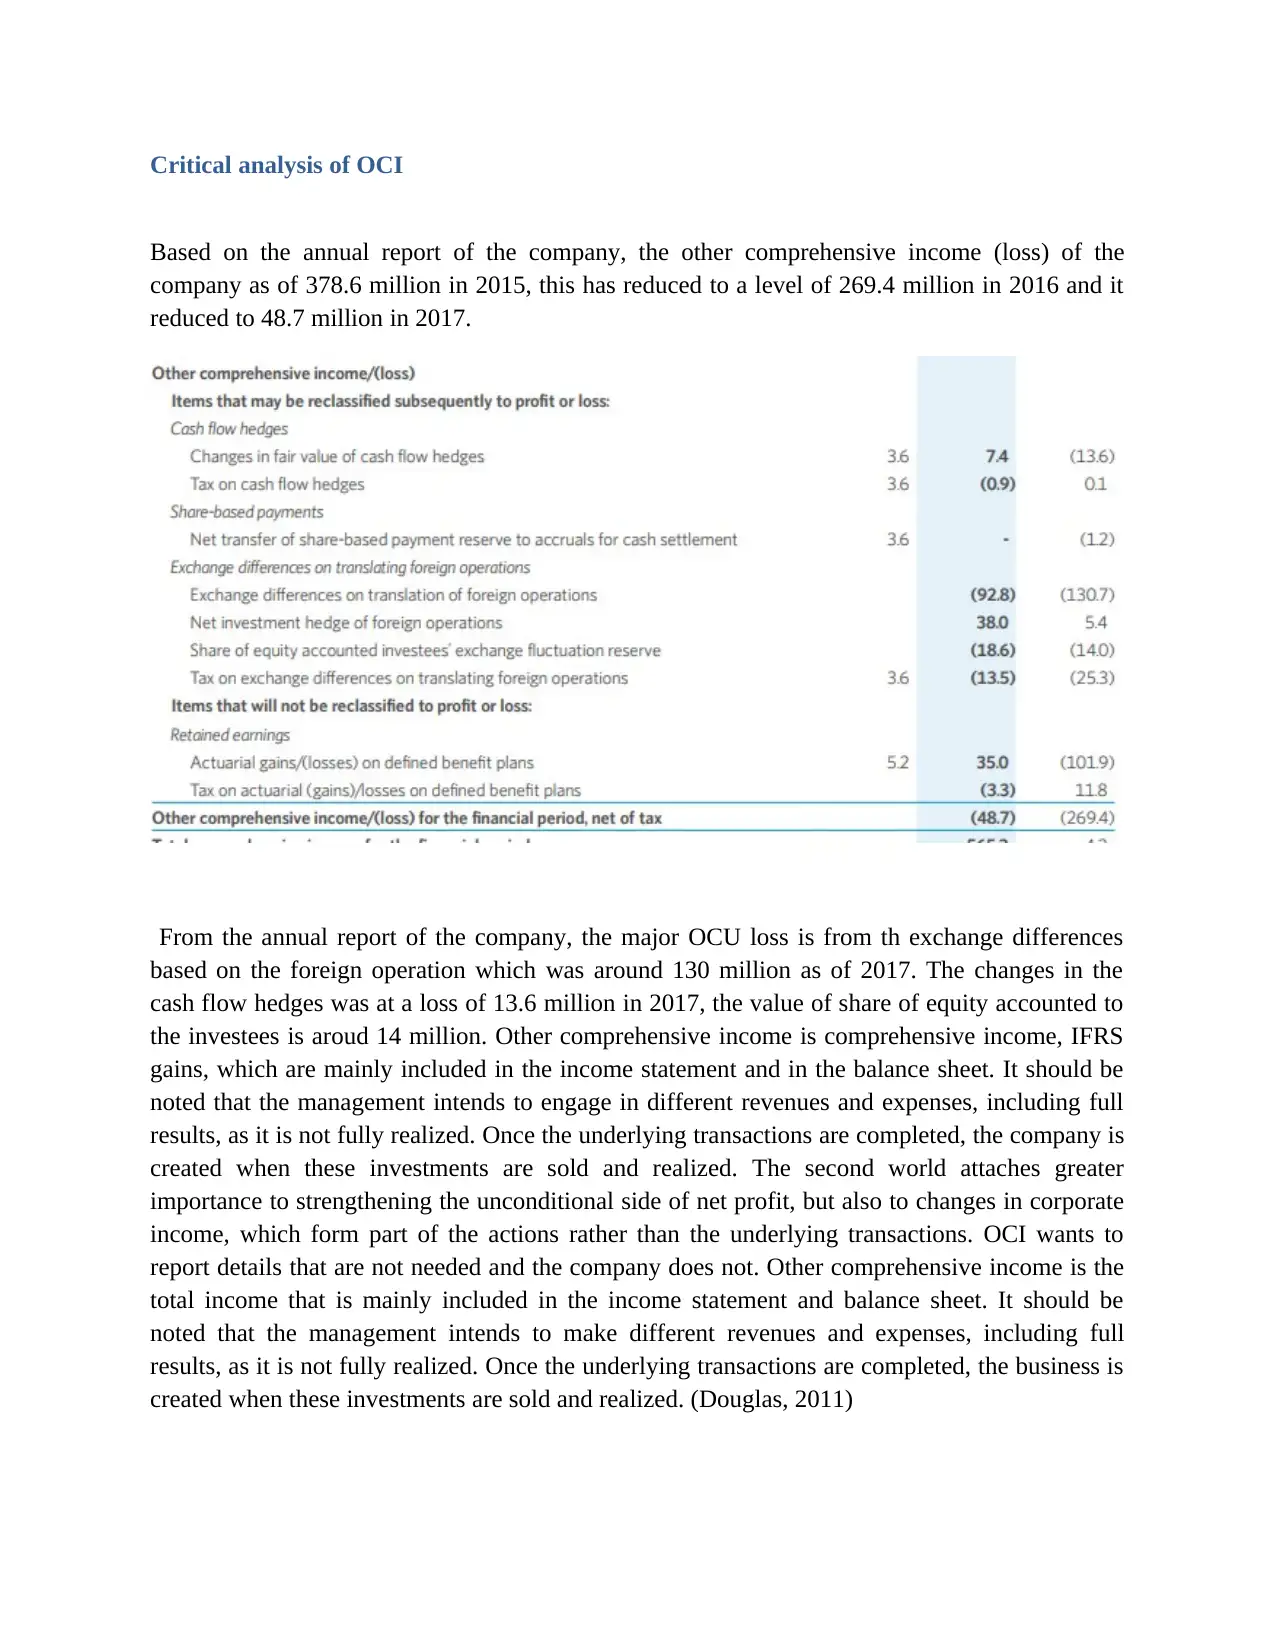
Critical analysis of OCI
Based on the annual report of the company, the other comprehensive income (loss) of the
company as of 378.6 million in 2015, this has reduced to a level of 269.4 million in 2016 and it
reduced to 48.7 million in 2017.
From the annual report of the company, the major OCU loss is from th exchange differences
based on the foreign operation which was around 130 million as of 2017. The changes in the
cash flow hedges was at a loss of 13.6 million in 2017, the value of share of equity accounted to
the investees is aroud 14 million. Other comprehensive income is comprehensive income, IFRS
gains, which are mainly included in the income statement and in the balance sheet. It should be
noted that the management intends to engage in different revenues and expenses, including full
results, as it is not fully realized. Once the underlying transactions are completed, the company is
created when these investments are sold and realized. The second world attaches greater
importance to strengthening the unconditional side of net profit, but also to changes in corporate
income, which form part of the actions rather than the underlying transactions. OCI wants to
report details that are not needed and the company does not. Other comprehensive income is the
total income that is mainly included in the income statement and balance sheet. It should be
noted that the management intends to make different revenues and expenses, including full
results, as it is not fully realized. Once the underlying transactions are completed, the business is
created when these investments are sold and realized. (Douglas, 2011)
⊘ This is a preview!⊘
Do you want full access?
Subscribe today to unlock all pages.
Trusted by 1+ million students worldwide
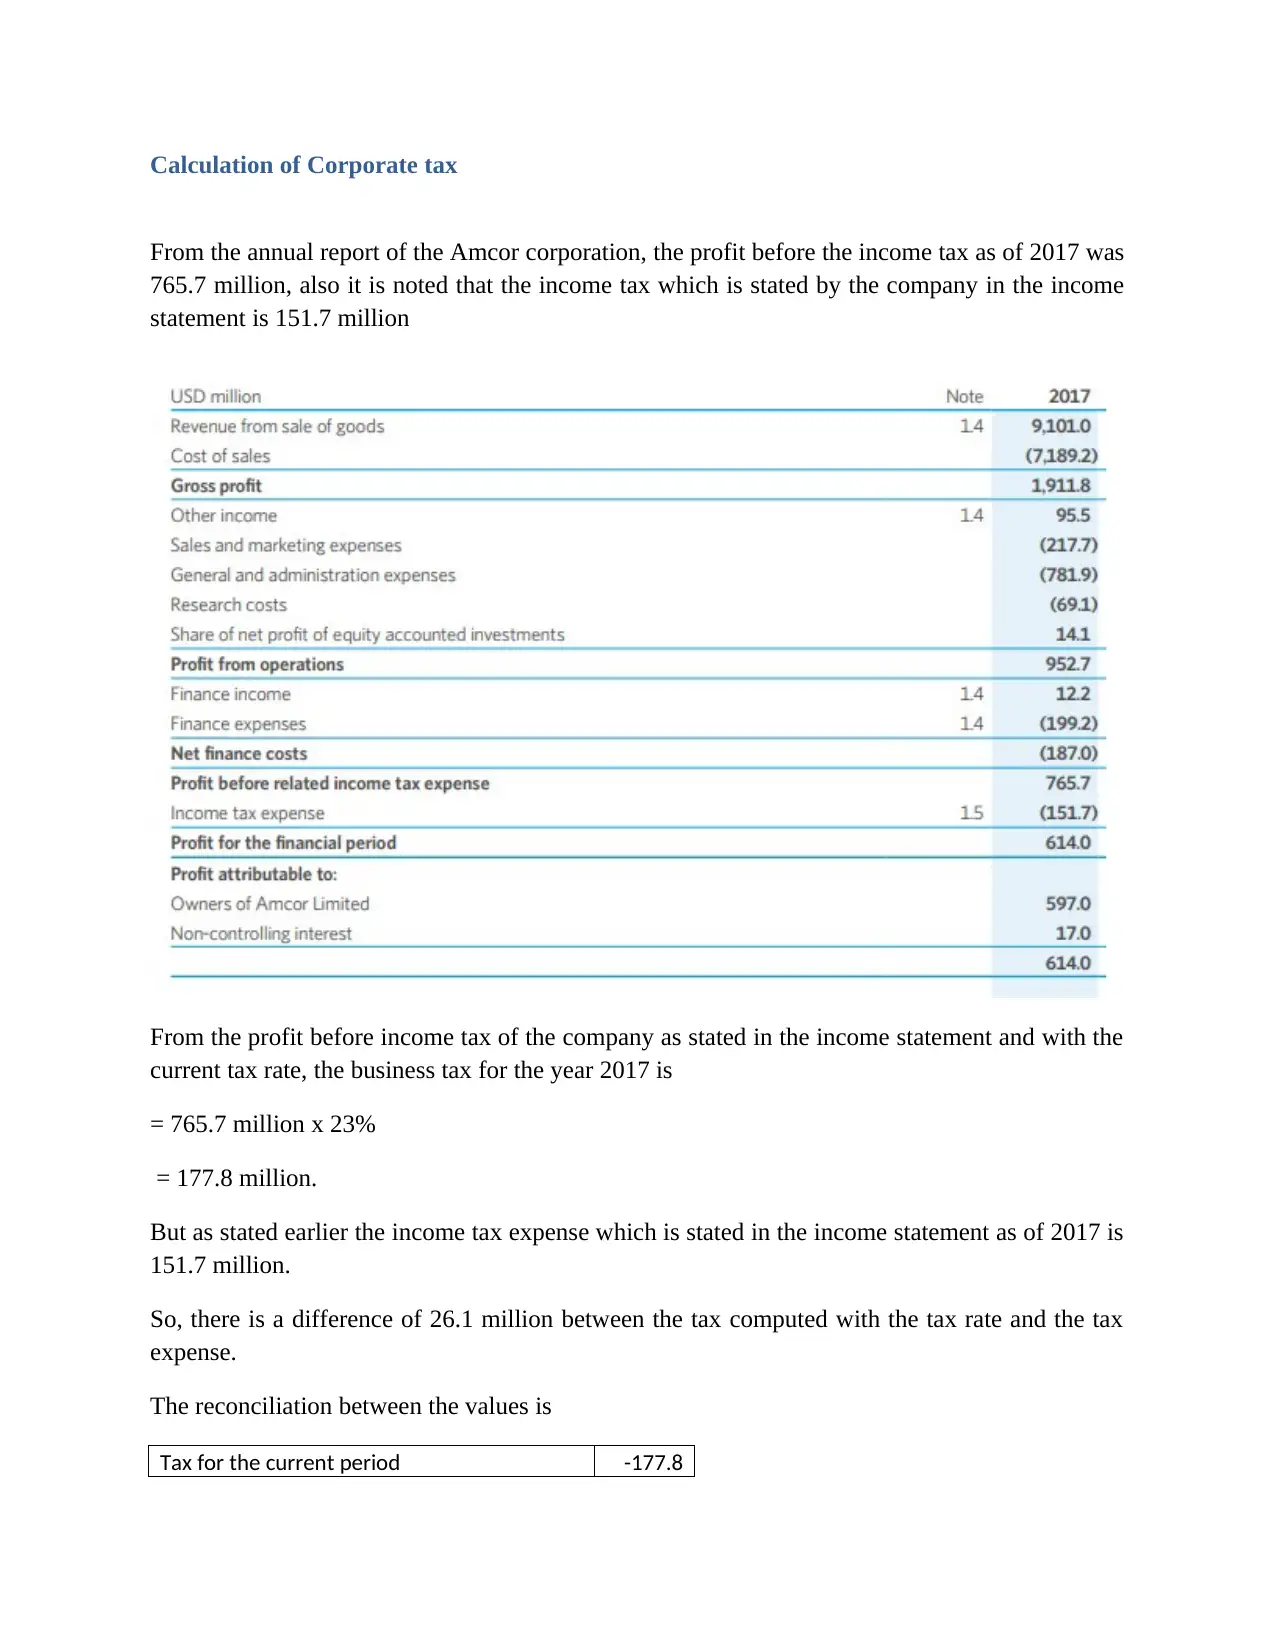
Calculation of Corporate tax
From the annual report of the Amcor corporation, the profit before the income tax as of 2017 was
765.7 million, also it is noted that the income tax which is stated by the company in the income
statement is 151.7 million
From the profit before income tax of the company as stated in the income statement and with the
current tax rate, the business tax for the year 2017 is
= 765.7 million x 23%
= 177.8 million.
But as stated earlier the income tax expense which is stated in the income statement as of 2017 is
151.7 million.
So, there is a difference of 26.1 million between the tax computed with the tax rate and the tax
expense.
The reconciliation between the values is
Tax for the current period -177.8
Paraphrase This Document
Need a fresh take? Get an instant paraphrase of this document with our AI Paraphraser
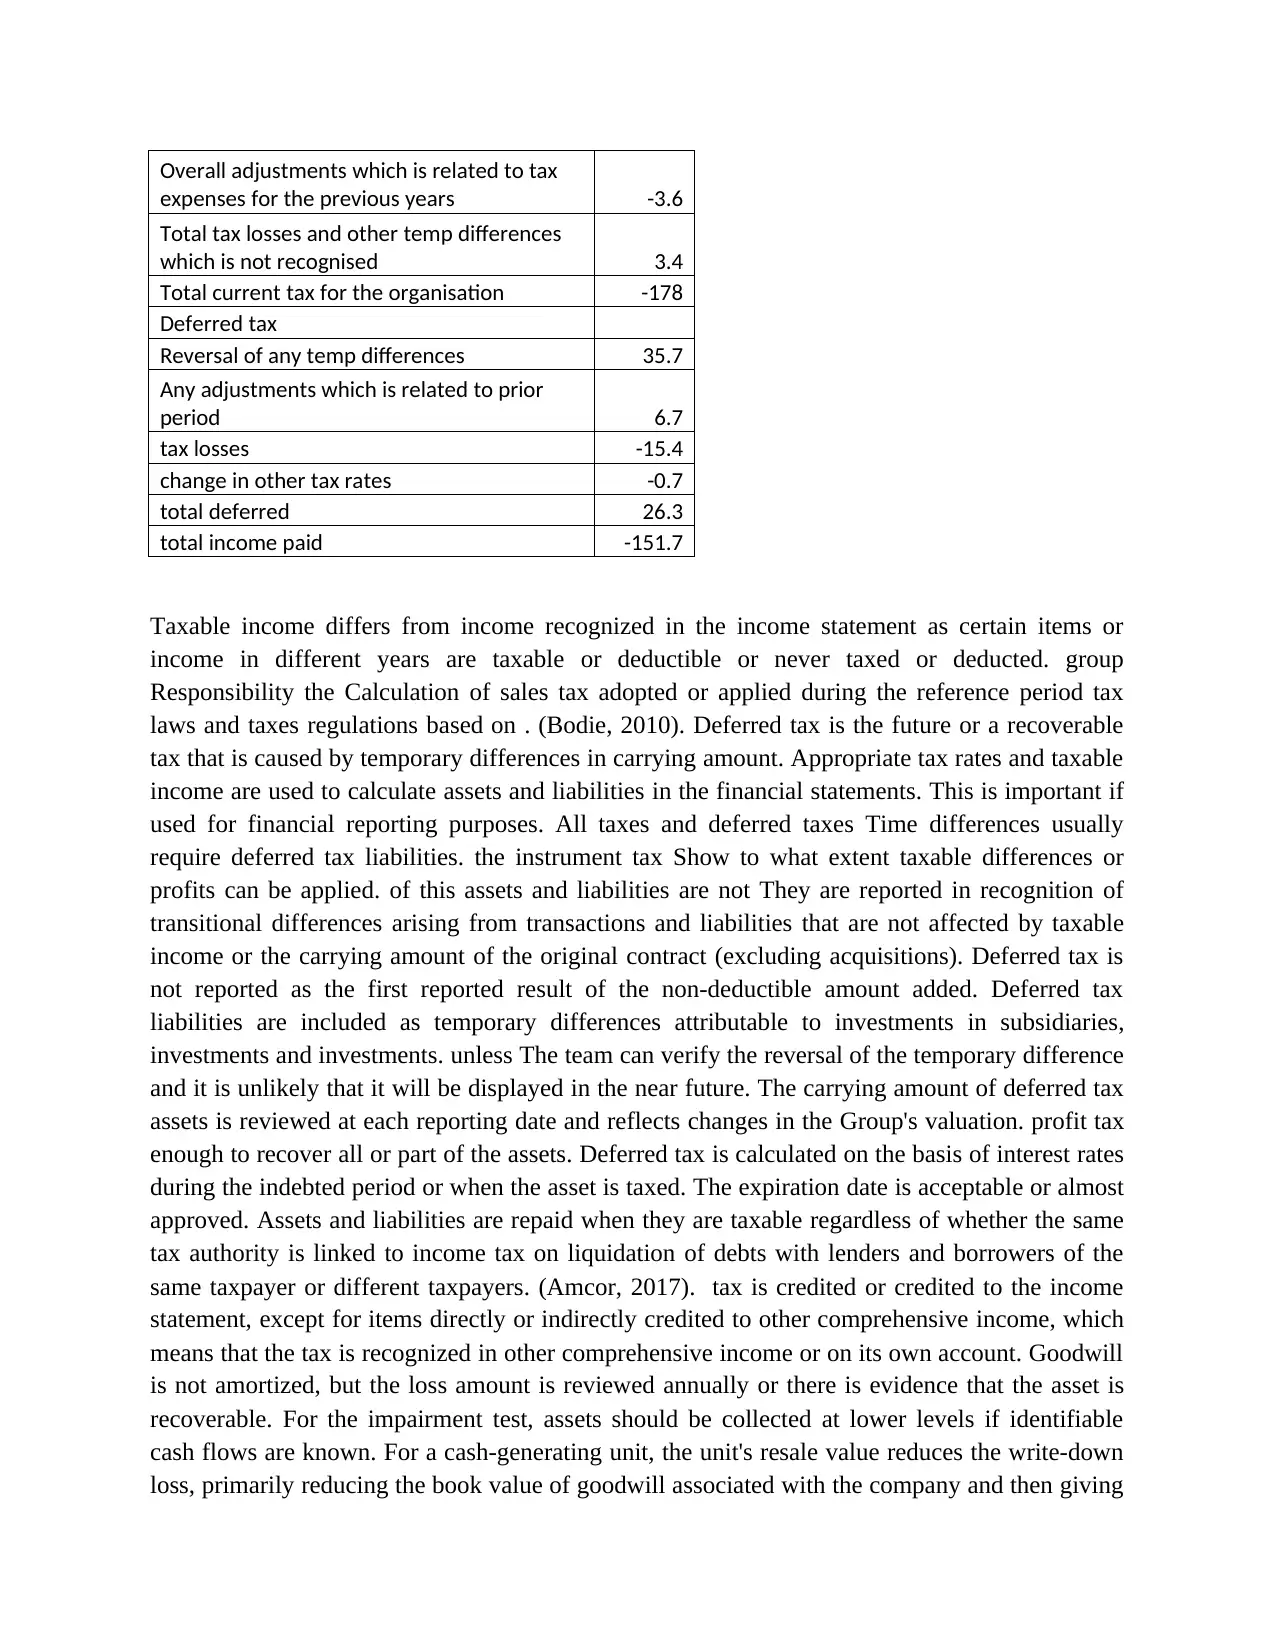
Overall adjustments which is related to tax
expenses for the previous years -3.6
Total tax losses and other temp differences
which is not recognised 3.4
Total current tax for the organisation -178
Deferred tax
Reversal of any temp differences 35.7
Any adjustments which is related to prior
period 6.7
tax losses -15.4
change in other tax rates -0.7
total deferred 26.3
total income paid -151.7
Taxable income differs from income recognized in the income statement as certain items or
income in different years are taxable or deductible or never taxed or deducted. group
Responsibility the Calculation of sales tax adopted or applied during the reference period tax
laws and taxes regulations based on . (Bodie, 2010). Deferred tax is the future or a recoverable
tax that is caused by temporary differences in carrying amount. Appropriate tax rates and taxable
income are used to calculate assets and liabilities in the financial statements. This is important if
used for financial reporting purposes. All taxes and deferred taxes Time differences usually
require deferred tax liabilities. the instrument tax Show to what extent taxable differences or
profits can be applied. of this assets and liabilities are not They are reported in recognition of
transitional differences arising from transactions and liabilities that are not affected by taxable
income or the carrying amount of the original contract (excluding acquisitions). Deferred tax is
not reported as the first reported result of the non-deductible amount added. Deferred tax
liabilities are included as temporary differences attributable to investments in subsidiaries,
investments and investments. unless The team can verify the reversal of the temporary difference
and it is unlikely that it will be displayed in the near future. The carrying amount of deferred tax
assets is reviewed at each reporting date and reflects changes in the Group's valuation. profit tax
enough to recover all or part of the assets. Deferred tax is calculated on the basis of interest rates
during the indebted period or when the asset is taxed. The expiration date is acceptable or almost
approved. Assets and liabilities are repaid when they are taxable regardless of whether the same
tax authority is linked to income tax on liquidation of debts with lenders and borrowers of the
same taxpayer or different taxpayers. (Amcor, 2017). tax is credited or credited to the income
statement, except for items directly or indirectly credited to other comprehensive income, which
means that the tax is recognized in other comprehensive income or on its own account. Goodwill
is not amortized, but the loss amount is reviewed annually or there is evidence that the asset is
recoverable. For the impairment test, assets should be collected at lower levels if identifiable
cash flows are known. For a cash-generating unit, the unit's resale value reduces the write-down
loss, primarily reducing the book value of goodwill associated with the company and then giving
access to other assets. The impairment loss recognized in goodwill can not be changed in
subsequent periods. The recoverable amount is the fair value, the sale price and the value in use.
Existing financial market assessments and estimates of future cash flows for discount rates
updated in current values are special tools for which future cash flow analyzes have not been
modified. (Eun, 2015)
References
Amcor (2017). Annual report of Amcor
Bodie, Z., Kane, A., Marcus, A. J., Perrakis, S., & Ryan, P. J. (2010). Investments. Canada:
McGraw-Hill Ryerson.
Brealy, R & Myers, S (2011). Principles of Corporate Finance. New York: McGraw-Hill.
Damodaran, A. (2016). Valuation approaches and metrics: A survey of the theory and evidence,
Stern School of Business.
Douglas Hubbard. (2011). The Failure of Risk Management: Why It's Broken and How to
Fix It. pg. 46, John Wiley & Sons
Eun, C & Resnick, B (2015). International Financial Management. New York: McGraw-Hill.
⊘ This is a preview!⊘
Do you want full access?
Subscribe today to unlock all pages.
Trusted by 1+ million students worldwide
1 out of 9
Related Documents


Your All-in-One AI-Powered Toolkit for Academic Success.
+13062052269
info@desklib.com
Available 24*7 on WhatsApp / Email
![[object Object]](/_next/static/media/star-bottom.7253800d.svg)
Unlock your academic potential
Copyright © 2020–2026 A2Z Services. All Rights Reserved. Developed and managed by ZUCOL.