Amcor Ltd Financial Analysis: Corporate Governance and Performance
VerifiedAdded on 2022/01/27
|25
|4832
|106
Report
AI Summary
This report provides a comprehensive financial analysis of Amcor Ltd, a global packaging company. It begins with an overview of Amcor's business operations, including its history, segments, and international presence, as well as its corporate governance structure, including the board of directors, policies, and ethics. The report then delves into a detailed examination of Amcor's financial performance from 2015 to 2017, analyzing key financial statement items such as net assets, equity, current assets, non-current liabilities, net profit, and revenue. It also assesses Amcor's cash flow activities, including operating, investing, and financing activities. Finally, the report evaluates Amcor's financial performance using various ratios, including profit margin, return on equity, asset turnover, receivable turnover, and inventory turnover, providing insights into the company's efficiency and profitability.
Running Head: Accounting for decision making
Financial Statement Analysis
Amcor Ltd
Financial Statement Analysis
Amcor Ltd
Paraphrase This Document
Need a fresh take? Get an instant paraphrase of this document with our AI Paraphraser
Accounting for decision making 1
Part 1
Part 1: Question 1
Amcor Limited is packaging company which is operating its business at the global level and
is headquartered at Southbank, Australia. It commenced its business operations in 1926.
However, Amcor’s existence dates back to 1860s when a paper mill was operated by Samuel
Ramsden who came to Australia in search of his fortune. Amcor came into existence as a
paper making business and was formerly known as Australian Paper Manufactures Ltd.
Amcor Ltd is now operating as a leader in the packaging industry through 39 and produces a
wide range of products such as corrugated boxes, cartons, plastic jars, aluminium or steel
cans etc. The company operates its business through 3 major segments i.e. Amcor Rigid
Plastics, Investment segment and the Amcor Flexibles. As a part of business, Amcor serves
diversified markets and customer units. It provides packaging containers for various food and
beverage items such as soft-drinks, water, milk related beverages, beer and other drinks.
Apart from this it provides packaging solution for various pharmaceutical, home and personal
care products. However, the company operates only within the packaging industry and its
business is limited to provision of packaging solution to multiple business units in different
areas (Bloomberg, 2018).
As the company is operating its business through multiple countries it is clear that it is
operating at an international level and not within Australia only. The details of the
subsidiaries of Amcor Ltd are given in the further sections of the report.
Part 1: Question 2
Accounting for decision making 2
The headings of discussion of corporate governance are Board of Directors, Policies and
Standards, Whistle-blower Service, Corporate governance statement and the corporate ethics
and feedback. Under the section board of directors the details of all the members on board
are given such as their qualification and experiences, their designation in company, the
number of directorships and offices they are holding and their term of office. Under the head
corporate governance policies and standards various policies have been incorporated such as
Anti-Bribery and Corruption Policy, Audit & Compliance Committee Charter, Code of
Conduct & Ethics Policy, Company Board Charter, Company Constitution, Delegated
Authority Policy, Disclosure Policy, Environment Policy, Executive Committee Charter,
Fraud Policy Sustainability Policy, Whistle-blower Policy, UK Tax Policy, Share Trading
Policy and so on. Under the head Corporate ethics & feedback, the corporate ethics and
Feedbacks and complains are the major sub-headings (Amcor Ltd., 2018).
Part 1: Question 3:
The page references to access the discussion on corporate governance are as follows:
https://www.amcor.com/investors
https://www.amcor.com/investors/corporate-gov/board-of-directors
https://www.amcor.com/investors/corporate-gov/policies-standards
https://www.amcor.com/investors/corporate-gov/statement
https://www.amcor.com/investors/corporate-gov/ethics-feedback
Further, the page 32 of annual report of Amcor Ltd. for the year 2017 can be assessed to refer
to the discussion on corporate governance in relation to the company.
⊘ This is a preview!⊘
Do you want full access?
Subscribe today to unlock all pages.
Trusted by 1+ million students worldwide
Accounting for decision making 3
Part 1: Question 4
The positions that were held by the top paid board members were chairmanship, senior
executives, CEOs. The remuneration of CEOs and senior executives was composed of 35%
and 44% respectively, of their salary as a fixed amount. The variable portion in the salary was
24% and 18% respectively and this was in respect of short term incentives that were paid in
cash. Further, the short term incentives paid in the form of equity which comprised of 12%
and 9% of their total salaries were paid to both CEOs and Senior Executives. Furthermore,
they were also entitled to some long term incentives which comprised of 29% of their
respective salaries (Annual Report, 2017).
Part 1 - Question 5:
Amcor has various subsidiaries set-up in different countries across the globe such as Amcor
Packaging Ltd. based at New Zealand, Amcor Packaging Inc. based at United States, Amcor
Sunclipse Inc. in North America, Amcor Europe in United Kingdom, Amcor Packaging Asia
Pty. Ltd, Amcor Flexibles A/S in Denmark etc. In total there are 41 entities across the world,
which are controlled by Amcor Ltd as their parent company. The main countries of
company’s operations are Argentina, Australia, Spain, Poland, United States of America,
China, France, Germany, New Zealand, Switzerland, Russia, Korea, Switzerland, Thailand
and various other countries (Amcor Ltd, 2018).
Part 2
Note: In the present all the financial are expressed in Australian Dollars
Paraphrase This Document
Need a fresh take? Get an instant paraphrase of this document with our AI Paraphraser
Accounting for decision making 4
Part 2: Question 1
In 2017, the amount invested by Amcor Ltd in net assets is $1,158,996,360. The balance of
net assets is determined by deducting total liabilities from the total assets balance for the year
2017. In all the 3 previous years, the balances of total assets and liabilities have varied due to
which the balance of net total assets has also varied in the given years. In 2015, the amount of
net asset investment was $ 2,066,406,250 which had declined to the level of $ 1,138,567,196
in 2016 due to increase in total liabilities. Although the investment in total assets had also
increased from 2015 to 2016 but not as much as the total liabilities increased. However, in
2017 the balance in the net total assets increased but a small level because of increase in
investment in total assets. The increase is primarily due to the business acquisitions that are
partially offset by the negative effect on account of strengthening of USD against various
currencies in which assets are held. The increase in liabilities is mainly due to the interest
bearing liabilities which is reflected by the additional drawdowns to finance the cost of
acquisitions which was partially compensated against the free cash flow during 2017 (Annual
Report, 2017).
Part 2: Question 2:
The total equity for the current year i.e. 2017 is $ 1,158,996,359. The total equity in 2015 was
$ 2,066,406,250 and in 2016 it was $ 1,138,567,196. The major cause of reduction in the
balance of the equity in 2016 from 2015 is the reduced balance of retained earnings. Also
there were some share buy-backs undertaken in 2016. Further, the profits out of business
were also reduced significantly in 2016 as compared to 2015 which contributed to decline in
the balance of equity in 2016. The balance of equity was raised back in 2017 after 2016 due
to increased profitability which increased the balance of retained earnings of the company in
2017 (Morning Star, 2018).
Accounting for decision making 5
Part 2 – Question 3:
The total current assets held by Amcor Ltd in 2017 were of $ 4,272,620,904. Under the head
of current assets there were various assets held by the company such as cash, accounts
receivables, prepaid expenses, inventories, short-term investments, assets that were held for
sale and some other miscellaneous assets. In 2015 and 2016 the balance of current assets was
$ 4,299,892,270 and $ 4,444,010,416 respectively. The balance of current assets in all the 3
years reported here under has varied slightly. Since 2015, the current assets balance has
followed a declining trend (Morning Star, 2018).
Part: 2: Question 4:
The non-current liabilities of Amcor Ltd comprise accounts payable, long term debt,
provision and miscellaneous non-current liabilities. No, there are no new non-current
liabilities entered into in 2017. All the liabilities that are shown under the head non-current
liabilities are same as that were in previous 2 years i.e. 2015 and 2016. However, before
2014, no liability was reported as other non-current liabilities (Annual Report, 2017).
Part: 2: Question 5:
The net profit (after tax and abnormal items adjustments) that was reported in 2017 was $
798,231,929. The net profit in the preceding 3 financial years from 2014 has widely
fluctuated. In 2015, an increase of $ 325,444,791 was reported in the net profit as there was
no tax paid on the abnormal transactions. However, in 2016, there was a steep decline in the
net profitability of the company. Total decline in net profits of $ 553,309,564 was reported.
However, in 2017 the net profit was again increased back by $ 429,796,702 as a result of
reduced tax expenses in respect of abnormal transactions (Morning Star, 2018).
Part: 2: Question 5:
⊘ This is a preview!⊘
Do you want full access?
Subscribe today to unlock all pages.
Trusted by 1+ million students worldwide
Accounting for decision making 6
The total revenue in 2017 is lesser than the revenues for the immediately preceding 2 years.
However, they are greater than the revenue of 2014. This is due to the change in the level of
sales in each year. Out of the 4 years since 2014, the lowest sales were generated in 2014 but
thereafter the company experienced an increase in the demand of its products for the next two
years after which the sales started declining again in 2017.
Part 2: Question 7:
The net annual cash generated from operating activities of Amcor Ltd in 2017 was $
1,335,673,426. The largest cash inflow was on account of increase in trade payables and it
amounts USD 129.7 million. The largest cash outflow was on account of interest payment
and it amounts USD 188 million. These amounts differs from the earlier 3 years where the
operating cash flows had reported an inclining trend till 2016 after which there was a decline
in the operating cash flows in 2017 (Annual Report, 2017).
Part 2: Question 8:
There was an outflow of $ 822,412,896 in 2017 on account of investing activities. Further
there were no new cash flows from investing activities which were different from that of
previous three years.
Part 2: Question 9:
The net increase in the cash flows of Amcor Ltd in 2017 was $ 57,592,304. This is as a result
of all the 3 main activities of cash flows: operating, investing and financing along with the
adjustments for foreign exchange rate fluctuations. There has been reported wide fluctuation
in the previous 3 financial years since 2014 in the net cash flows. In 2016, there was a
decrease in the cash flow of $ -247,912,737. But in 2015, there was a net increase of $
250,390,626 and in 2014 there was an increase of 169,900,000.
Paraphrase This Document
Need a fresh take? Get an instant paraphrase of this document with our AI Paraphraser
Accounting for decision making 7
Part 3
Part 3 – Question 1:
The profit margin ratio has slightly fluctuated over the last 3 years. However, it can be said
that company has maintained a consistency in relation to its net margins. Though, there had
been a decline in the profit after tax over the last 3 years but in 2017 there is an increase in
net margin ratio because the same percentage of profits were earned even on the reduced
level of sales.
Part 3 – Question 2:
The return on equity ratio is the measure of company’s profitability. This ratio shows how
efficiently the firm is utilizing the funds of its shareholder’s investment to generate profits for
them in return of their investment (Higgins, 2012). A higher ROE is the indicator of
company’s sound profitability. However, in case of Amcor Ltd, the said ratio has kept on
fluctuating. Out of the last 3 years, the lowest ROE was reported in 2016 due to lower
profitability of the company. However, in 2017, the profitability position of Amcor increased
and thus higher returns could be provided to its shareholders.
Part 3 – Question 3:
The asset turnover ratio of Amcor has kept on declining over the period of last 3 years and
this shows that the company could not utilize its total assets to generate higher sales revenues.
Therefore, it is not a good indicator of Amcor’s efficiency. The investment in total assets has
increased continuously since the last 3 years and this might have resulted in laying some of
the assets in the idle situation.
Part 3 – Question 4:
Accounting for decision making 8
The receivable turnover ratio has reported a declining trend over the last 3 years which is not
a good indicator of Amcor’s efficiency in managing its accounts receivables. The cash
conversion cycle of the company had weakened as the company had taken longer durations to
convert its credit sales into cash (Tracy, 2012). The declining sales revenue is a major factor
of declining receivables turnover of the company.
Part 3 – Question 5:
The inventory turnover ratio has declined over the period of 3 years and this indicates the
inefficiency of company to manage its inventory in its business. The declining inventory
turnover ratio shows that the company is taking longer time than the previous year to convert
its inventory into sales. As the investment in inventory has increased with each passing year it
is becoming difficult for the company to convert it into sales in shorter cycles (Zimmerman &
Yahya-Zadeh, 2011)
Part 3 – Question 6:
The current ratio is the measure of company’s liquidity. This ratio has declined over the last 3
years and due to this the liquidity position of the business has worsened. In all the 3 years
Amcor Ltd did not have sufficient current assets to meet its current liabilities. The reason
behind the declining current ratio is the increase in current liabilities balances and at the same
the balance of current assets got reduced continuously over the past 3 years.
Part 3 – Question 7:
The quick ratio has declined over the past 3 years and this is not a good indicator of a sound
liquidity position of the business. This is mainly due to the reduction in the balance of quick
assets such as trade receivables and short term investments over the last 3 years and also the
⊘ This is a preview!⊘
Do you want full access?
Subscribe today to unlock all pages.
Trusted by 1+ million students worldwide
Accounting for decision making 9
current liabilities kept on increasing since 2015. Quick assets are those assets that can readily
be converted into cash as and when required to meet the short term obligations of the
business as and when they become due (Cull, Demirgu¨ ç‐Kunt & Morduch, 2007).
Part 3 – Question 8:
The cash flow ratio is used to assess the operating efficiency of the company. It shows the
number of times a company can repay its current debts using its cash flows from the
operating activities i.e. the normal business operations (Foster, 2004). A higher ratio is
preferable as the ratio less than 1 indicates that the company has not generated sufficient cash
to meet its short term liabilities. In the present case of Amcor Ltd. The said ratio has
experienced kept on fluctuating but it remained below 1 which indicates the operational
inefficiency of the company over the period of last 3 years. Out of last 3 years Amcor had
generated highest operating cash flows in 2016 which has slightly improved the cash flow
ratio. However, in 2017 there is an increase in current liabilities which reduced back the said
ratio.
Part 3 – Question 9:
The debt ratio has increased in the last 3 years. However, there is a slight decline in the said
ratio in 2017 as compared to 2016. This ratio is also a measure of financial leverage of a
company as it shows the percentage of assets financed through the external debts i.e. the
money of creditors (Nissim & Penman, 2001). When higher amount debt funds are used to
finance the company’s assets then its risk of insolvency increases. Therefore, a rising debt to
asset ratio is not a good result for the financial health of Amcor Ltd.
Part 3: Question 10:
Paraphrase This Document
Need a fresh take? Get an instant paraphrase of this document with our AI Paraphraser
Accounting for decision making 10
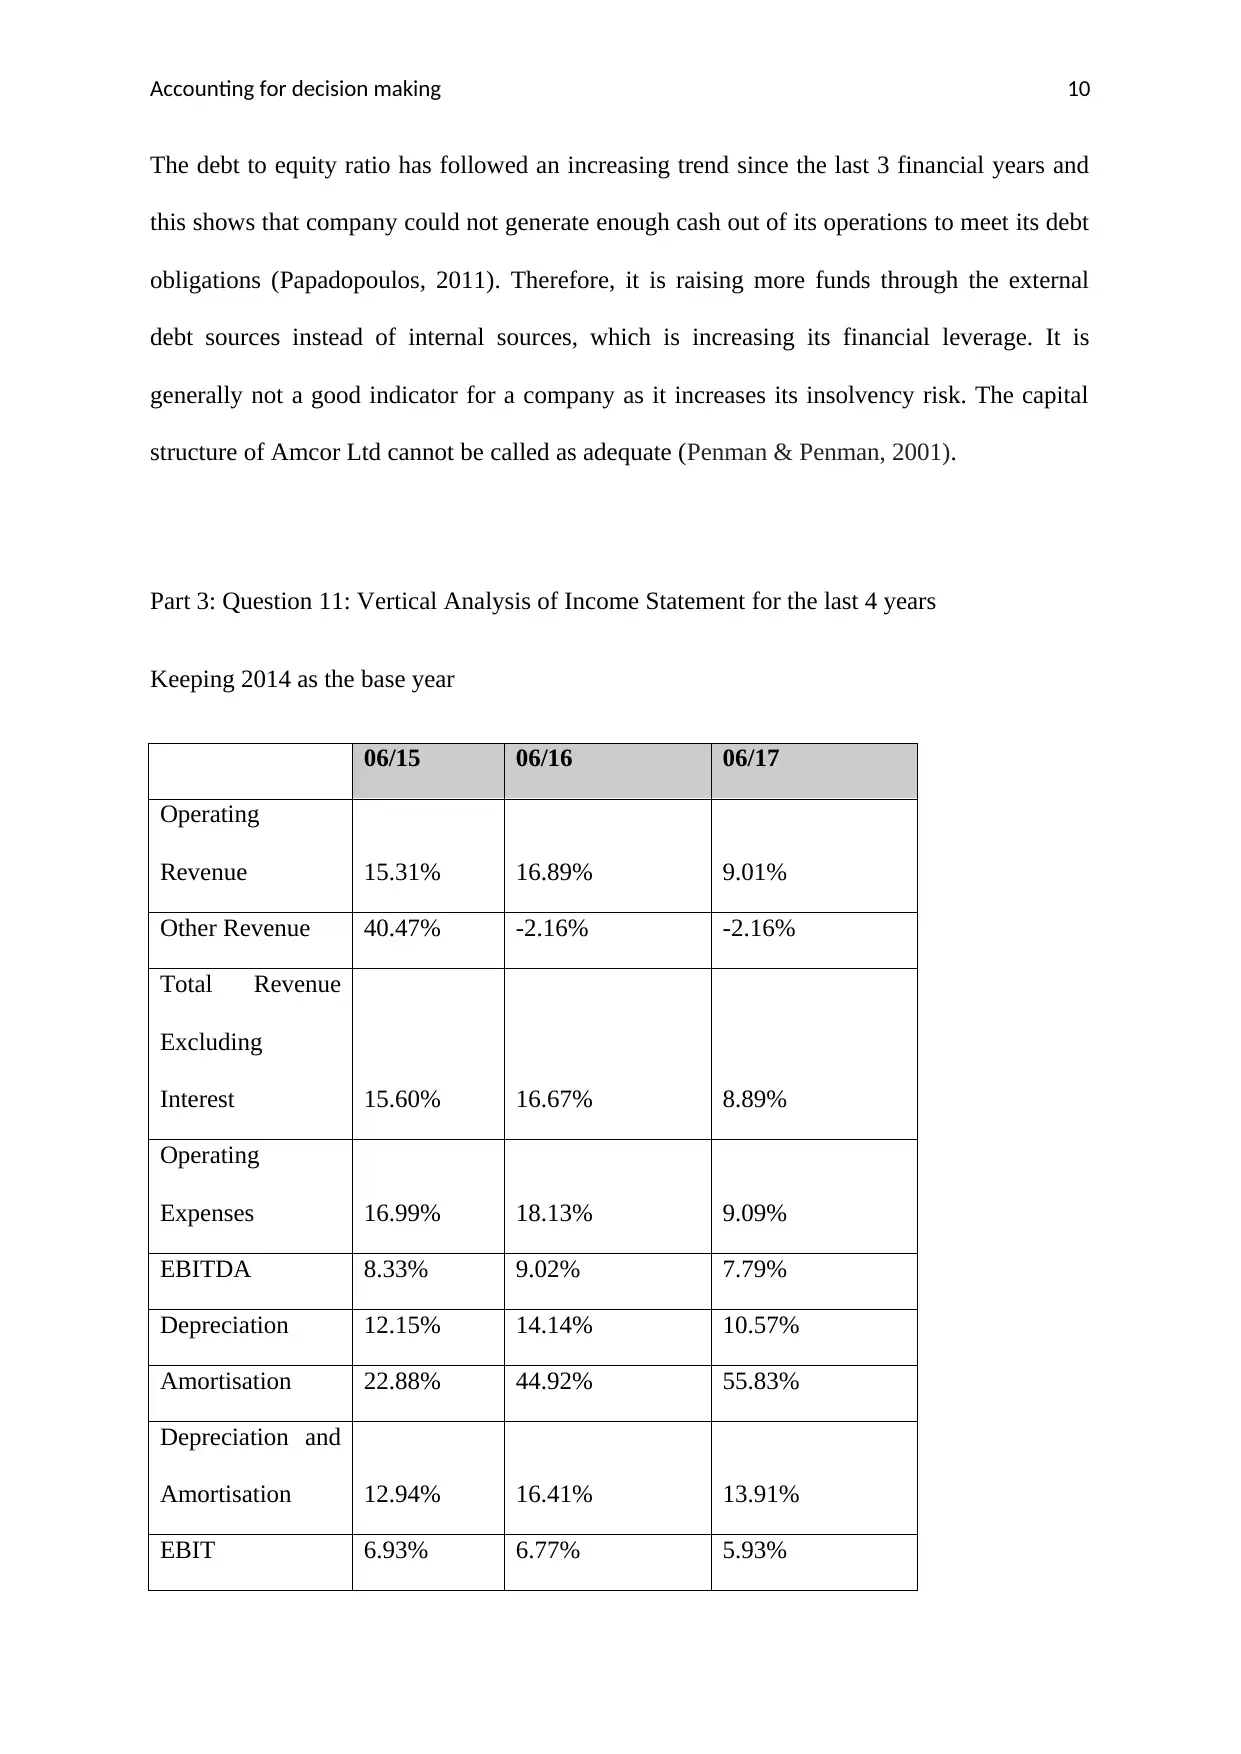
The debt to equity ratio has followed an increasing trend since the last 3 financial years and
this shows that company could not generate enough cash out of its operations to meet its debt
obligations (Papadopoulos, 2011). Therefore, it is raising more funds through the external
debt sources instead of internal sources, which is increasing its financial leverage. It is
generally not a good indicator for a company as it increases its insolvency risk. The capital
structure of Amcor Ltd cannot be called as adequate (Penman & Penman, 2001).
Part 3: Question 11: Vertical Analysis of Income Statement for the last 4 years
Keeping 2014 as the base year
06/15 06/16 06/17
Operating
Revenue 15.31% 16.89% 9.01%
Other Revenue 40.47% -2.16% -2.16%
Total Revenue
Excluding
Interest 15.60% 16.67% 8.89%
Operating
Expenses 16.99% 18.13% 9.09%
EBITDA 8.33% 9.02% 7.79%
Depreciation 12.15% 14.14% 10.57%
Amortisation 22.88% 44.92% 55.83%
Depreciation and
Amortisation 12.94% 16.41% 13.91%
EBIT 6.93% 6.77% 5.93%
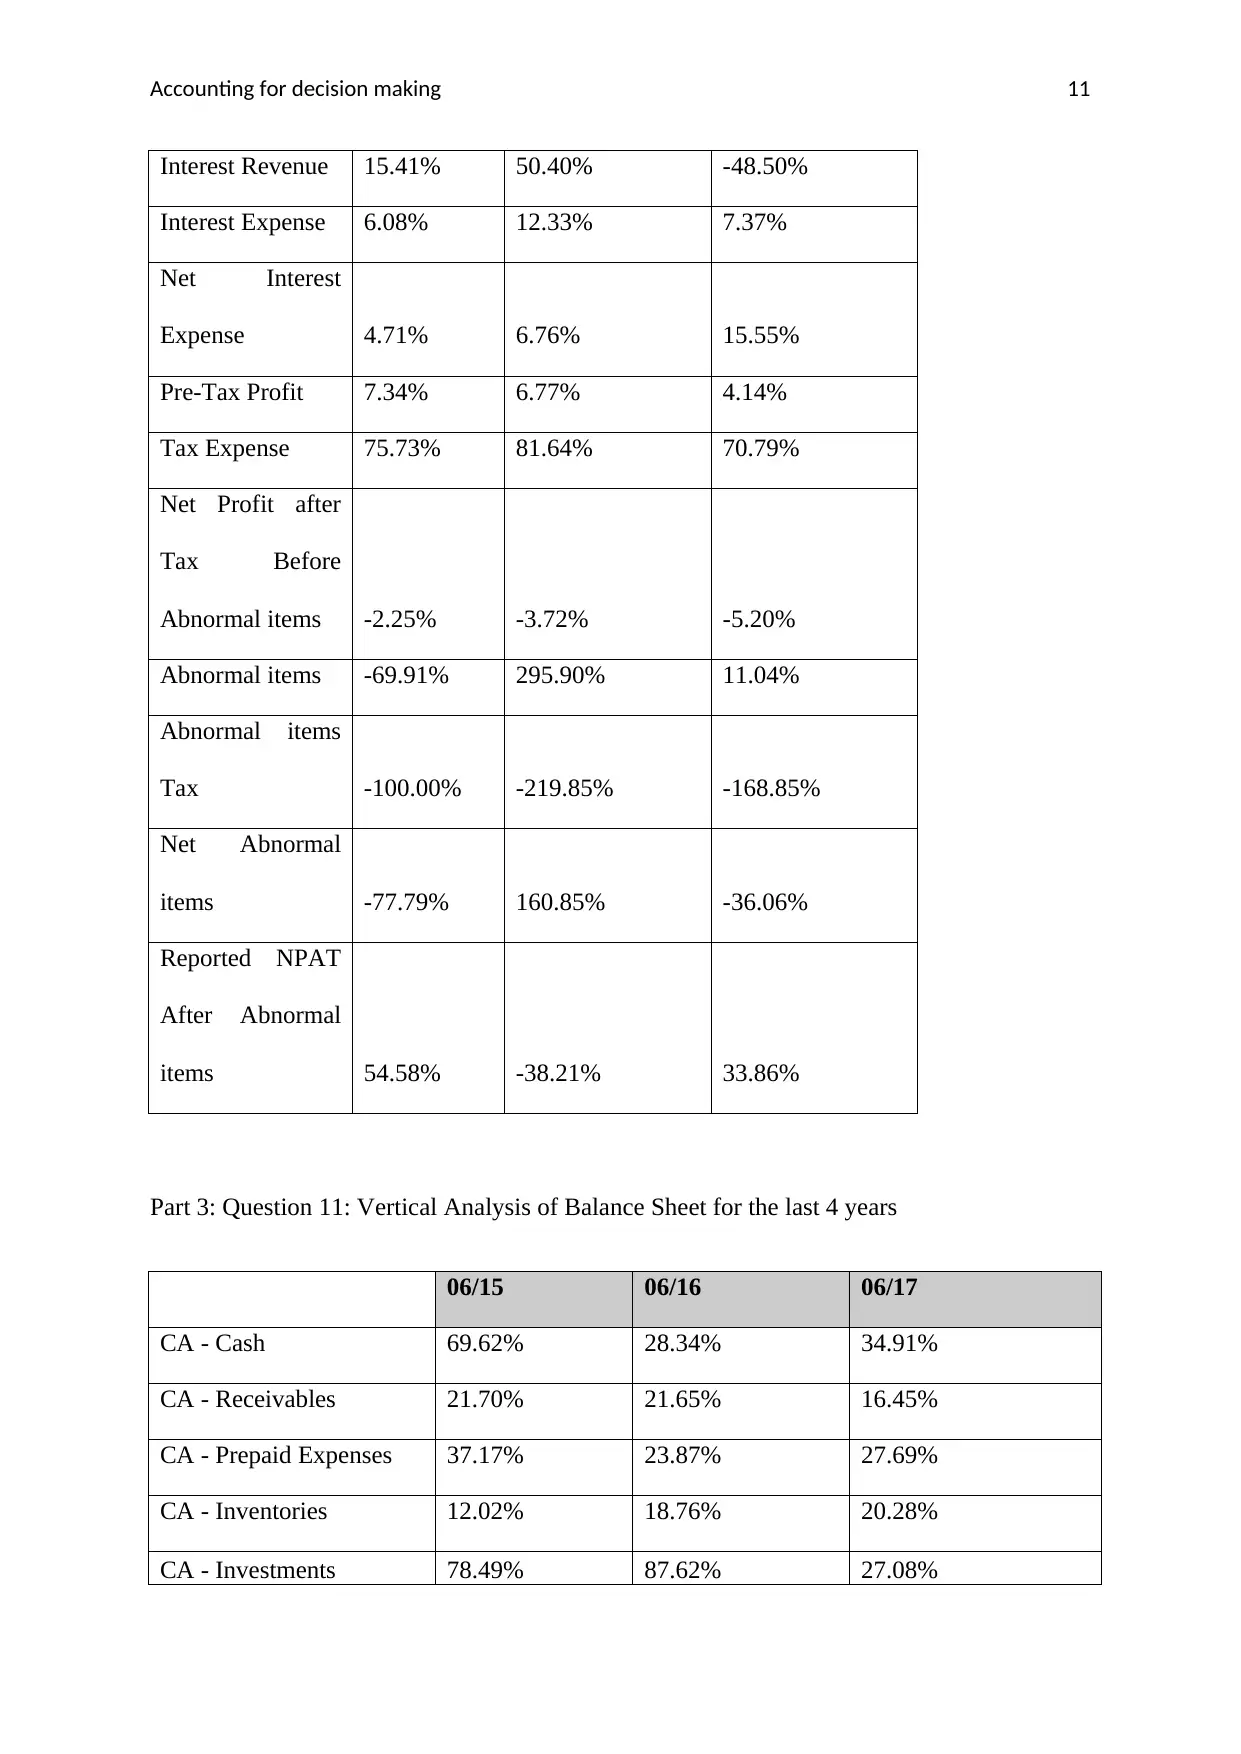
Accounting for decision making 11
Interest Revenue 15.41% 50.40% -48.50%
Interest Expense 6.08% 12.33% 7.37%
Net Interest
Expense 4.71% 6.76% 15.55%
Pre-Tax Profit 7.34% 6.77% 4.14%
Tax Expense 75.73% 81.64% 70.79%
Net Profit after
Tax Before
Abnormal items -2.25% -3.72% -5.20%
Abnormal items -69.91% 295.90% 11.04%
Abnormal items
Tax -100.00% -219.85% -168.85%
Net Abnormal
items -77.79% 160.85% -36.06%
Reported NPAT
After Abnormal
items 54.58% -38.21% 33.86%
Part 3: Question 11: Vertical Analysis of Balance Sheet for the last 4 years
06/15 06/16 06/17
CA - Cash 69.62% 28.34% 34.91%
CA - Receivables 21.70% 21.65% 16.45%
CA - Prepaid Expenses 37.17% 23.87% 27.69%
CA - Inventories 12.02% 18.76% 20.28%
CA - Investments 78.49% 87.62% 27.08%
⊘ This is a preview!⊘
Do you want full access?
Subscribe today to unlock all pages.
Trusted by 1+ million students worldwide
1 out of 25
Related Documents


Your All-in-One AI-Powered Toolkit for Academic Success.
+13062052269
info@desklib.com
Available 24*7 on WhatsApp / Email
![[object Object]](/_next/static/media/star-bottom.7253800d.svg)
Unlock your academic potential
Copyright © 2020–2026 A2Z Services. All Rights Reserved. Developed and managed by ZUCOL.