Comprehensive Financial Statement Analysis of Amcor PLC (2020-2021)

Verified

Added on  2023/06/10

|10
|2517
|404
Report
AI Summary
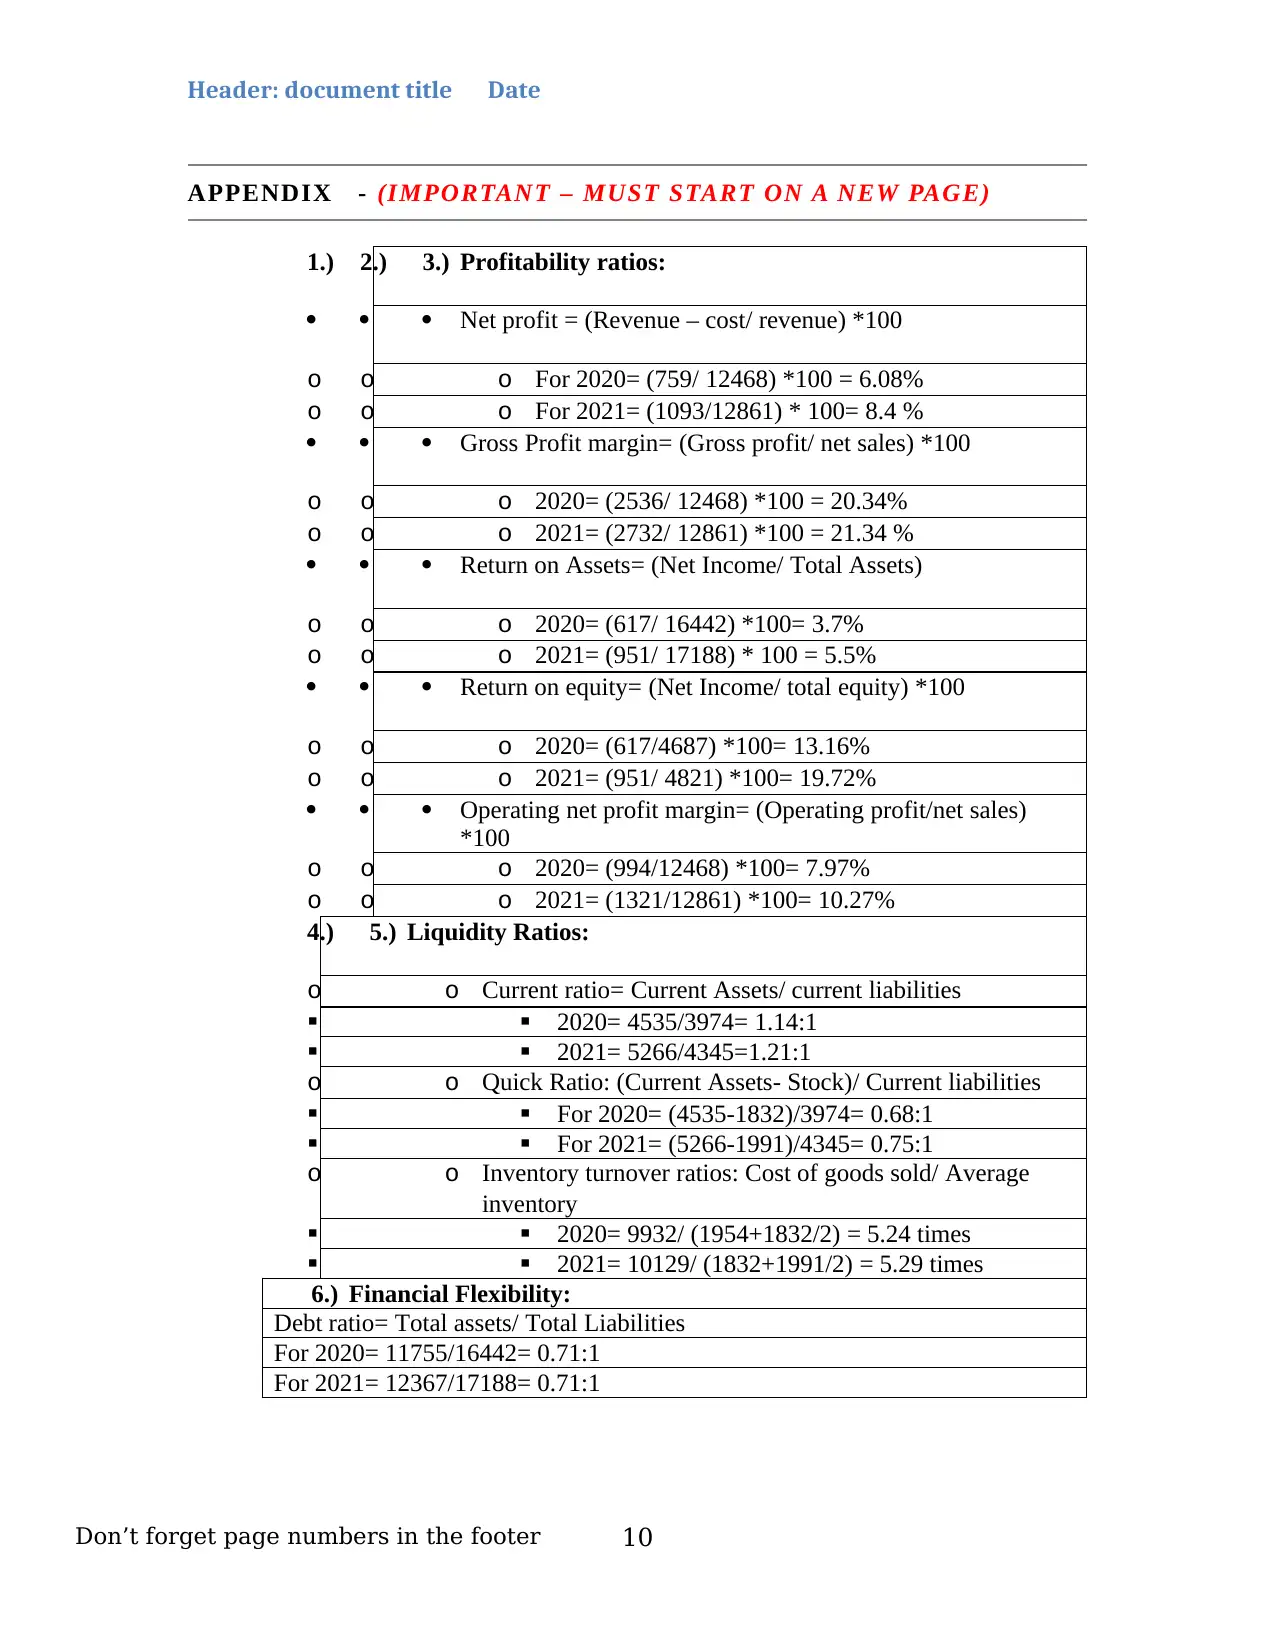
This report provides a comprehensive financial analysis of Amcor PLC, a global packaging company, comparing its performance between 2020 and 2021. The analysis utilizes various financial ratios, including liquidity, profitability, and financial flexibility ratios, to assess the company's performance. The report calculates and interprets key ratios such as current ratio, quick ratio, inventory turnover, accounts receivable turnover, net profit margin, gross profit margin, return on assets, return on equity, and operating net income margin. It discusses the implications of these ratios on Amcor PLC's financial health and provides insights into areas for improvement, such as cost control and asset utilization. Furthermore, the report explores the importance of social, environmental, governance, and ethical considerations within the context of Amcor PLC's operations, emphasizing the significance of transparency and responsible business practices. The conclusion highlights Amcor PLC's improved performance in 2021 and the crucial role of ratio analysis in informed decision-making. The report also includes recommendations for future improvement and acknowledges limitations in the analysis, such as the complexity of the financial data and the need for further investigation into certain aspects of the company's performance. Finally, the report references relevant sources and includes an appendix with detailed calculations of the financial ratios.
tabler-icon-diamond-filled.svg

Contribute Materials

Your contribution can guide someone’s learning journey. Share your documents today.
Document Page
BFA52 6 F IN AN C IA L
STAT EMEN T
AN ALYS IS
SEME S TE R X 202X
AMCOR
29-4-2022
[ A C C O U N T I N G F O R
M A N A G E R S ]
C O M P L E T E D B Y : Y O U R
N A M E A N D S T U D E N T I D
Y O U R F I R M ’ S N A M E ( C R E A T E A F I R M N A M E )
tabler-icon-diamond-filled.svg

Secure Best Marks with AI Grader

Need help grading? Try our AI Grader for instant feedback on your assignments.
Document Page
Header: document title Date
executive summary
Amcor Plc is a packaging accompany across the globe. It deals in the flexible packaging,
rigid containers, specialty cartons, closures and services for food, beverage,
pharmaceutical, medical – device, home and personal care and other products. It is public
company that has currently 46,000 employees and was founded in the year 1862. The
following report looks into the operations of Amcor Plc. In addition to this, the report
includes the comparative study between the two financial accounting year for the Amcor
Plc financial statements using the mechanism of ratio – analysis. It also represents the
importance of ratio analysis in the decision - making process for the people who are
directly or indirectly associated with the company. It also encompasses the interpretation
of the evaluated ratios with the defined concepts. Furthermore, it also comprises of the
explanation, computation and recognition on the influence of organization’s social and
environmental aspects, with issues in accordance with the ethical and corporate
governance.
Don’t forget page numbers in the footer 2
Document Page
Contents
TABLE OF contents...........................................3
1. introduction......................................4
2. RESULTS........................................5
4. Discussion........................................6
5. SOCIAL & ENVIRONMENTAL; GOVERNANCE & ETHICS 7
6. Conclusion.......................................7
7. recommendations...............................8
8. limitations........................................8
9. references (IMPORTANT – MUST START ON A NEW PAGE) 8
appendix - (IMPORTANT – MUST START ON A NEW PAGE) 9
3
Document Page
Header: document title Date
1. INTRODUCTION
1.1 Authorization and Purpose
The purpose of this report is the comparative analysis between two accounting year
financial statements of Amcor Plc.
1.2 Scope
The upcoming report will cover the interpretation and analysis of the fiscal records using
ratio analysis and its importance in the decision-making process.
1.3 Method
The information is taken from the reliable source of Amcor Plc website: amcor.com. The
data for the two years was observed and analyzed with the help of ratio – analysis.
1.4 Limitations
The issues that were faced during the analyzation was to ascertain the opening stock for
2020. Another problem that encountered was regarding the net income consideration.
1.5 Assumptions
The assumptions that were made while going through the brief about the company is that
the company must be doing good because it is dealing in the sustainable packaging.
1.6 Background/Overview
Amcor Plc is the global leader in developing and producing responsible packaging for
food, beverage, pharmaceutical, medical, home and personal care and other products.
This organization in operating in more than 40 countries and has the sales revenue of $13
billion. The history behind the Amcor Plc is there was Australian Paper Manufacturers
which were named as Amor Limited in 1986. This company first used to produce pulp
papers and paperboard products along with the metal cans and flexible packaging. In
April 2000, the Amcor only focused on the global packaging. The report looks into the
various ratio analysis mechanism which is available with the client to examine the
Don’t forget page numbers in the footer 4
tabler-icon-diamond-filled.svg

Secure Best Marks with AI Grader

Need help grading? Try our AI Grader for instant feedback on your assignments.
Document Page
financial potential of a company and take appropriate decisions for useful purposes.
Along with this, it also gives the valuable insights on the influence of social and
environmental aspects on the organization. Moreover, this report also encompasses on the
corporate governance and ethical practices. Furthermore, it also comprises of the
calculations and computations of the fiscal ratio analysis with the definition of each kind
of ratio. It also holds an explanation on the importance of each ratio when the business
firm or the invested parties have to take the different decisions in various aspects of the
organization.
2. RESULTS
Sub-heading 2.1
The data is taken from the Income statement and balance sheet of Amcor company for
two years that are 2020 and 2021 respectively. The analyzation and interpretation of the
data are as follows:
1. Liquidity ratios: These ratios are used to evaluate the capacity of a company to
pay its short- term debts. The current ratio is derived at 1.14:1 and 1.21:1 for the
year 2020 and 2021 respectively. The liquid ratio is evaluated at 0.68 for 2020
and 0.75 for 2021. This states that the company has good current ratio as it will be
able to meet its current obligations without any hurdles. Talking about the quick
ratio it interprets that it is less than 1 on a very clear note. So, the firm will not be
able to meet its short- term obligations without selling its stock. In this ratio
inventory turnover ratio and debtor’s turnover ratio is calculated for the two years.
The Stock turnover ratio is 5.24 times and 5.298 times sequentially, this states that
the company is able to sell and purchase its stock more than 5 times in a year. The
A.R.T is derived at 7.16 times for 2020 and 7.39 for 2021. This means that the
company has high level of D.T.R and it is able to issue and collect the trade credit
balance for 7 times in a year.
2. Profitability ratio: It is a metric which computes the profit earning potential of a
business from its sales, operation cost and assets. It can be observed from the
appendix that the net profit margin for 2020 and 2021 is 6.08 %, 8.42 %
5
Document Page
Header: document title Date
respectively that represents the company has improved its profitability by making
less expenses. The G.P.R for 2020, 2021 is 20.34 % and 21.34 %, it reflects the
increase of G.P. by 1% that signifies the increase in sales revenue and decrease in
the expenses of a firm. Other ratios that were calculated to check the profitability
of Amcor Plc are the return on assets, return on equity and operating cash flow
margin. The return on equity is calculated to assess the return on shareholder’s
wealth which is 13.16 % for 2020 and 19.72 for 2021it coveys that the company
is able to meet the requirements of its shareholders and is able to generate good
returns. The return on assets is 3.7 % for 2020 and 5.5 % for 2021. It represents
that for the year 2020 the company assets were not able to make enough returns
but in 2021 the return on equity is 5.5 % which is generally considered to be good
and indicates that the company’s assets are performing well. The last ratio that
was calculated is Operating net income margin which is evaluated at 7.97 % for
2020 and 10.27 for 2021. The ideal margin for any kind of business is considered
to be 15 % but both the year it has achieved less than the stated percentage it is a
symbol that the Amcor Plc. is not earning enough amount of money from its
operations so that it can pay its costs which is linked with the maintenance of the
business.
3. Financial flexibility ratio: These ratios are used to evaluate the potential of Amcor
Plc. to adapt with the changes. For this purpose, the debt ratio was calculated it
measures the amount of leverage that is used by Amcor Plc in accordance with the
total assets and liabilities. The debt ratio was computed at 0.71:1 and 0.71:1 for
2020 and 2021. The ratio determined is of the same value. It states that the
company has higher risk because it is more than the ideal ratio of 0.4:1. The
higher ratio signifies more risk as it makes more difficult for a business enterprise
to borrow money.
4. DISCUSSION
There are certain factors regarding the liquidity, where a company will have to sell its
stock to make payment of current liabilities. So, it must reduce its operational cost and
Don’t forget page numbers in the footer 6
Document Page
must focus on increasing its current assets. Another concern is that the company is not
able to generate enough amount of profit by utilizing its assets. Thus, it must make
optimum utilization of the assets.
5. SOCIAL & ENVIRONMENTAL; GOVERNANCE & ETHICS
Any company earns by using the resources of the society and environment, so it is the
prime duty of a business to do something for its society and environmental issues.
The environmental impact involves an organization uses the renewable energy
sources like solar, wind. So, in order to prevent such resources from the various issues it
must have the potential to handle the problems of sir pollution, water pollution that
happens due to its operational activities.
Social issues cover a big range of areas. There are many social aspects, but each of
them is very important about the social relations. Some of the issues that can be
considered in accordance with the business firm are: pay of an employee is genuine or
not as compared to the similar jobs in that particular industry; workplace policies in
relation with diversity, prevention from harassment and inclusion, does it donate money
for the welfare of society.
Governance is all about the management of an organization by the top-level
management. It includes how the managers are able to work for the interests of various
shareholders, employees, suppliers and its customers. A good corporate governance
contains the feature of no misleading statements in the financial records.
6. CONCLUSION
So, from the above report it shall be concluded that the Amcor Ltd. is doing well in
2021 as compared with the data and information of 2020. The use of ratio analysis is very
important for any company before making the decisions. Furthermore, it is also clear that
7
tabler-icon-diamond-filled.svg

Paraphrase This Document

Need a fresh take? Get an instant paraphrase of this document with our AI Paraphraser
Document Page
Header: document title Date
corporate governance holds the concept of transparency in the accounting practices and it
is very important for a company to provide clearance on the financial information.
7. RECOMMENDATIONS
As, it is observed from the above analysis and interpretation that the company is
performing well in comparison to 2020. And is in the direction to achieve the good
accomplishments. But it still needs to work on the cost control by adopting cost reducing
strategies. Different interested parties
8. LIMITATIONS
The drawback that was faced while interpreting the ratios using financial information
was that the it gave the complicated and misleading conclusions because the Amcor Plc is
doing good in some aspects and in others it is not performing well.
Don’t forget page numbers in the footer 8
Document Page
9. REFERENCES (IMPORTANT – MUST START ON A NEW PAGE)
Norfaryanti, K., 2021. in Biodegradable Food Packaging. Bio-Based Packaging:
Material, Environmental and Economic Aspects. p.437.
Hooper, N. and Barnes, J., 2021. Leading in the age of ESG. Company Director. 37(7),
pp.16-19.
Spruit, D. and Almenar, E., 2021. First market study in e-commerce food packaging:
Resources, performance, and trends. Food Packaging and Shelf Life. 29.
p.100698.
Torkashvand, M. and et.al., 2021. DRASTIC framework improvement using stepwise
weight assessment ratio analysis (SWARA) and combination of genetic
algorithm and entropy. Environmental Science and Pollution Research, 28(34).
pp.46704-46724.
Mason, P. and Williams, B., 2020. Does IRS Monitoring Deter Managers From
Committing Accounting Fraud?. Journal of Accounting, Auditing & Finance,
p.0148558X20939720.
Holm, L., 2018. Cost accounting and financial management for construction project
managers. Routledge.
Alimoradi, M., Aliahmadi, S. and Foroghi, D., 2020. The Effect of Optimism and
Riskseeking Level of Managers on Investment Selling Decisions with Emphasis
on Fair Value Accounting. Quarterly Financial Accounting, 12(45), pp.1-29.
9
Document Page
Header: document title Date
APPENDIX - (IMPORTANT – MUST START ON A NEW PAGE)
1.) 2.) 3.) Profitability ratios:
Net profit = (Revenue – cost/ revenue) *100
o o o For 2020= (759/ 12468) *100 = 6.08%
o o o For 2021= (1093/12861) * 100= 8.4 %
Gross Profit margin= (Gross profit/ net sales) *100
o o o 2020= (2536/ 12468) *100 = 20.34%
o o o 2021= (2732/ 12861) *100 = 21.34 %
Return on Assets= (Net Income/ Total Assets)
o o o 2020= (617/ 16442) *100= 3.7%
o o o 2021= (951/ 17188) * 100 = 5.5%
Return on equity= (Net Income/ total equity) *100
o o o 2020= (617/4687) *100= 13.16%
o o o 2021= (951/ 4821) *100= 19.72%
Operating net profit margin= (Operating profit/net sales)
*100
o o o 2020= (994/12468) *100= 7.97%
o o o 2021= (1321/12861) *100= 10.27%
4.) 5.) Liquidity Ratios:
o o Current ratio= Current Assets/ current liabilities
2020= 4535/3974= 1.14:1
2021= 5266/4345=1.21:1
o o Quick Ratio: (Current Assets- Stock)/ Current liabilities
For 2020= (4535-1832)/3974= 0.68:1
For 2021= (5266-1991)/4345= 0.75:1
o o Inventory turnover ratios: Cost of goods sold/ Average
inventory
2020= 9932/ (1954+1832/2) = 5.24 times
2021= 10129/ (1832+1991/2) = 5.29 times
6.) Financial Flexibility:
Debt ratio= Total assets/ Total Liabilities
For 2020= 11755/16442= 0.71:1
For 2021= 12367/17188= 0.71:1
Don’t forget page numbers in the footer 10
chevron_up_icon
1 out of 10
circle_padding
hide_on_mobile
zoom_out_icon
logo.png

Your All-in-One AI-Powered Toolkit for Academic Success.

Available 24*7 on WhatsApp / Email

[object Object]