Advanced Micro Devices Inc. Financial Analysis and Performance Report
VerifiedAdded on  2019/09/19
|11
|1769
|346
Report
AI Summary
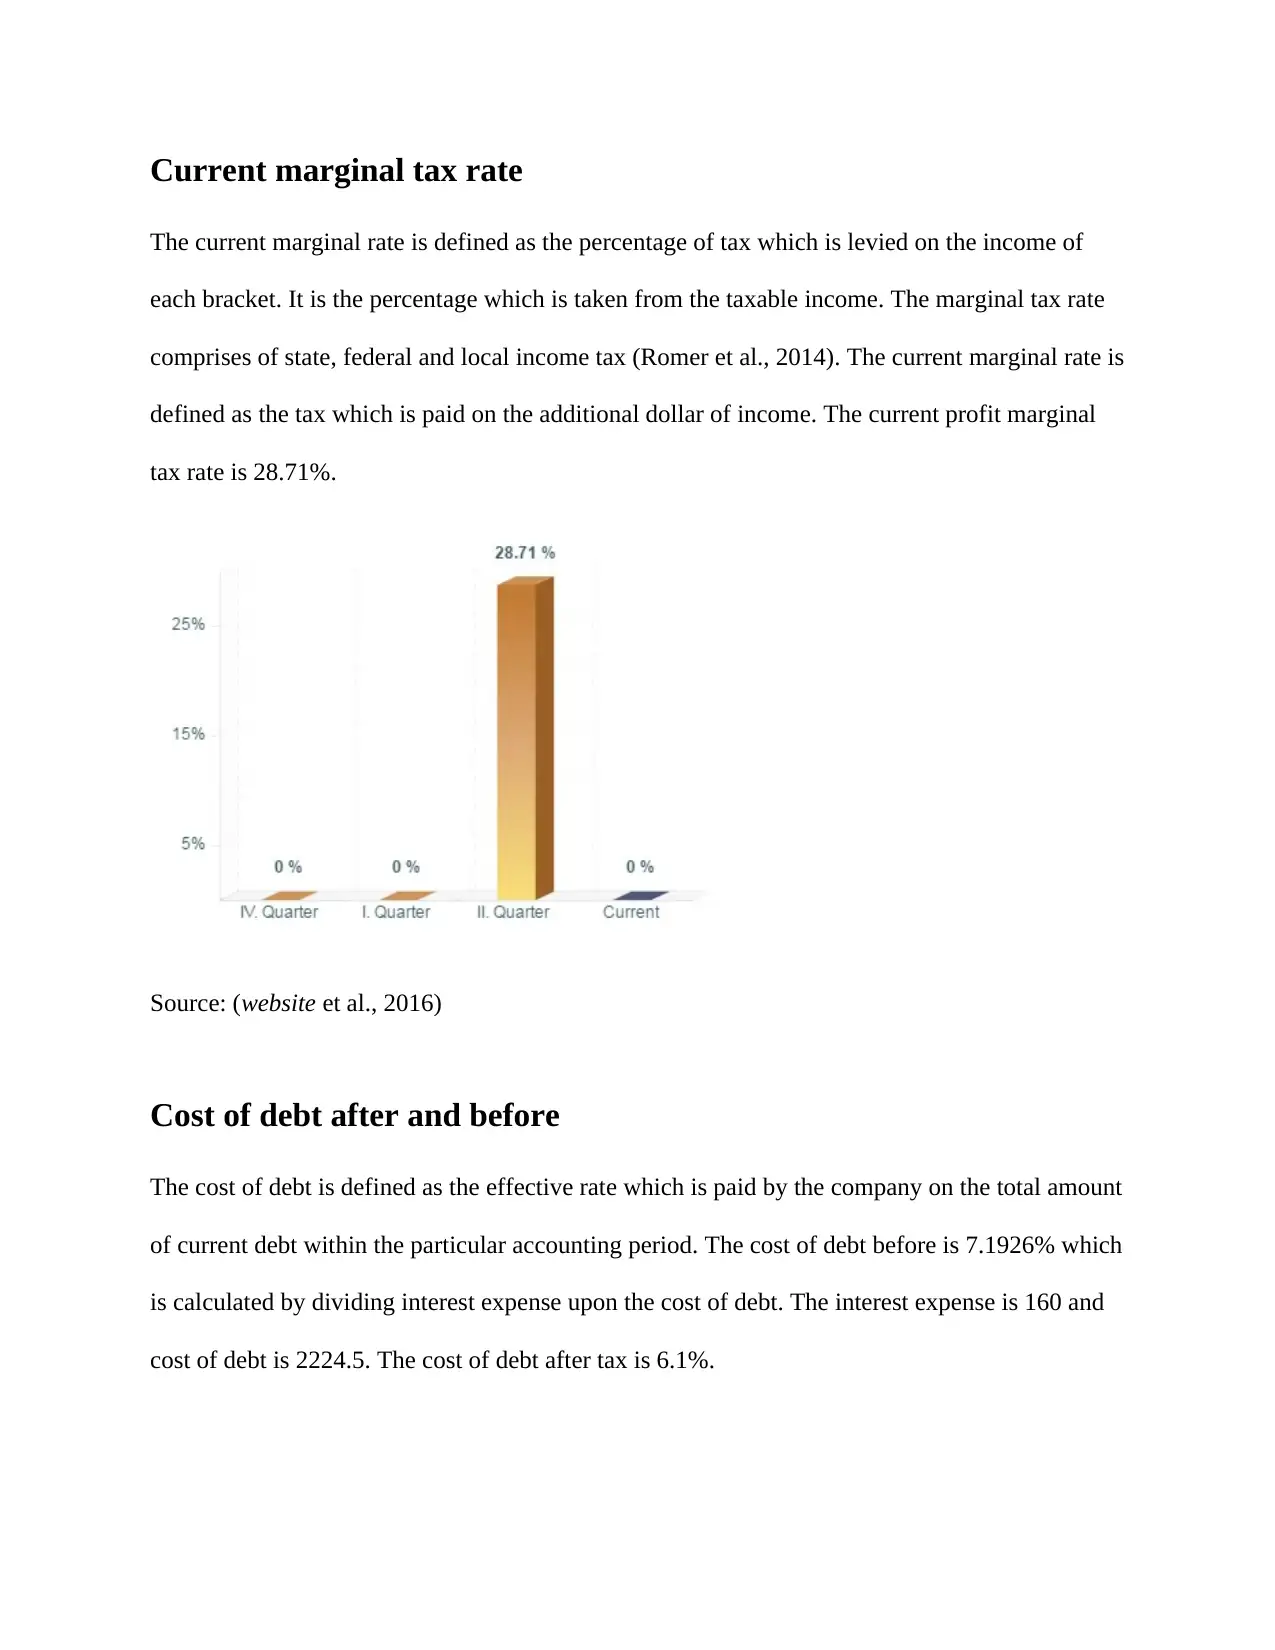
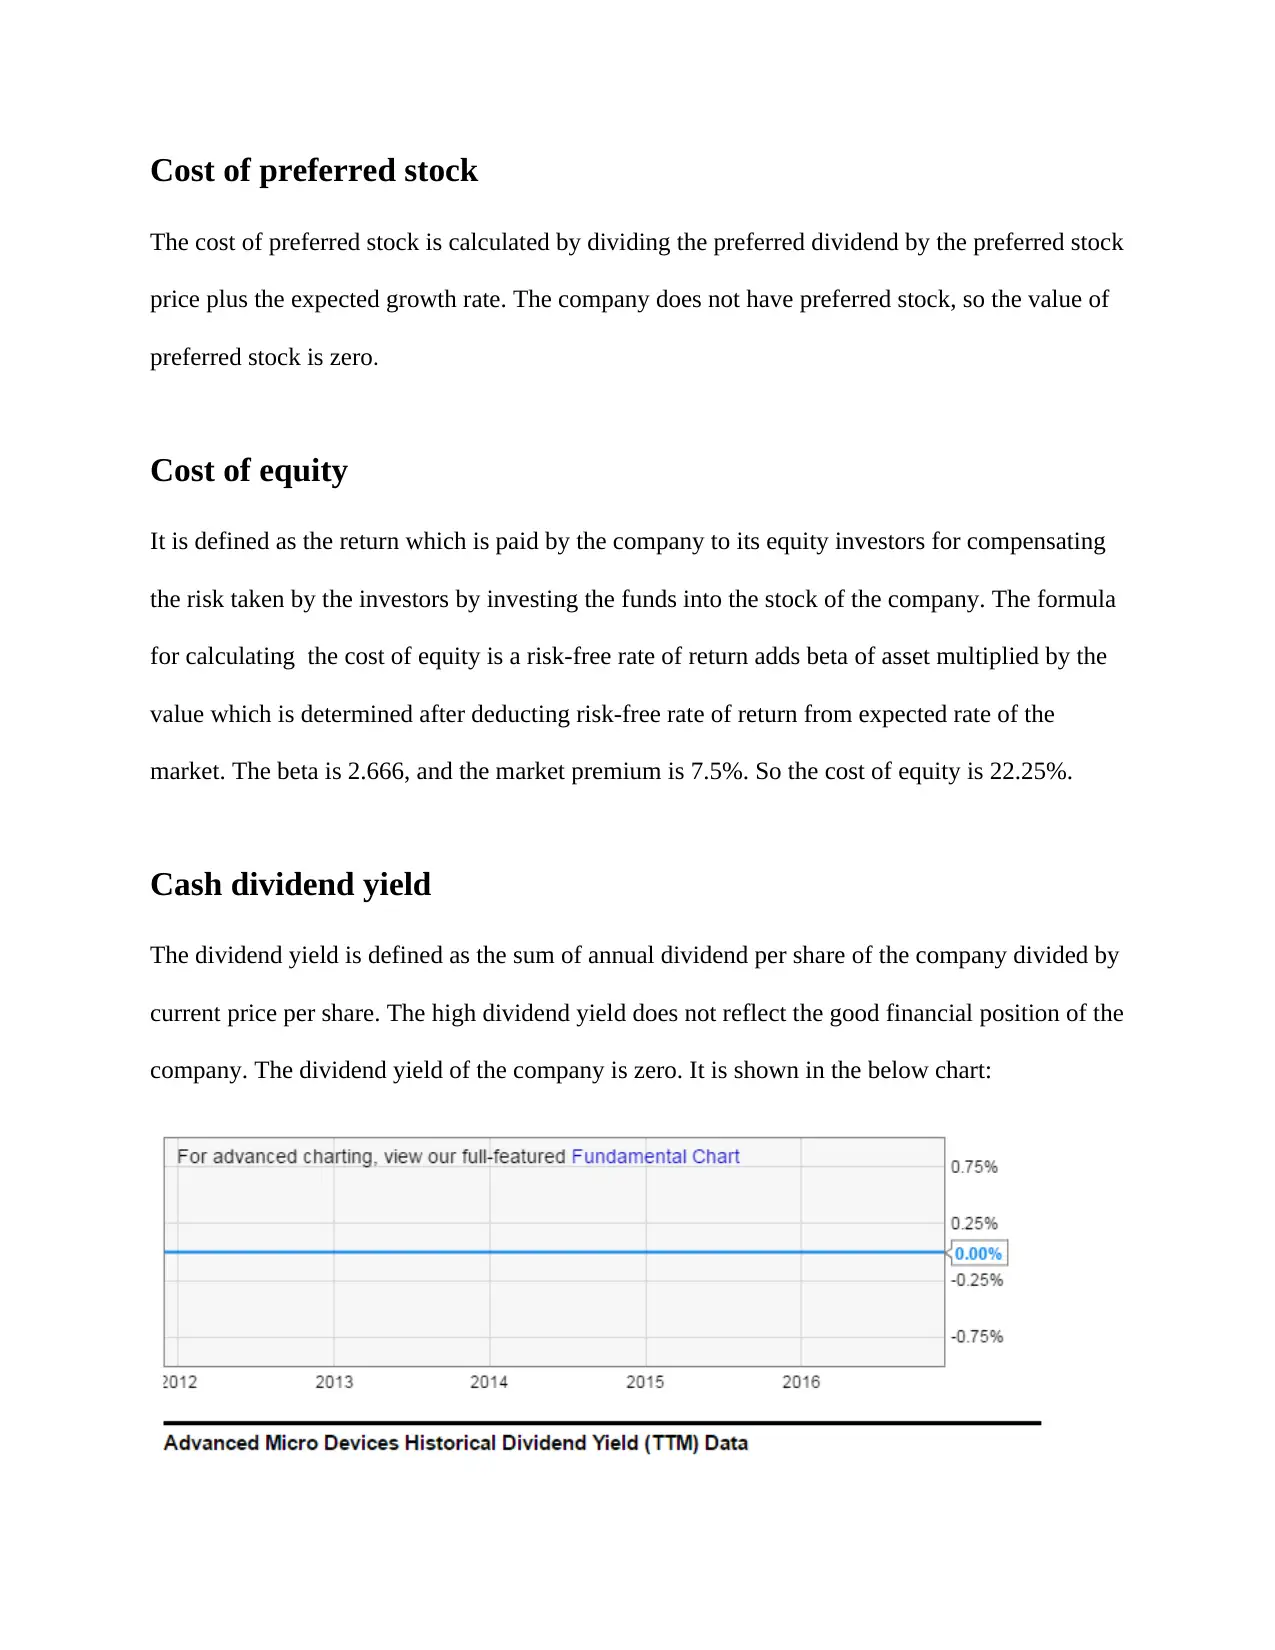
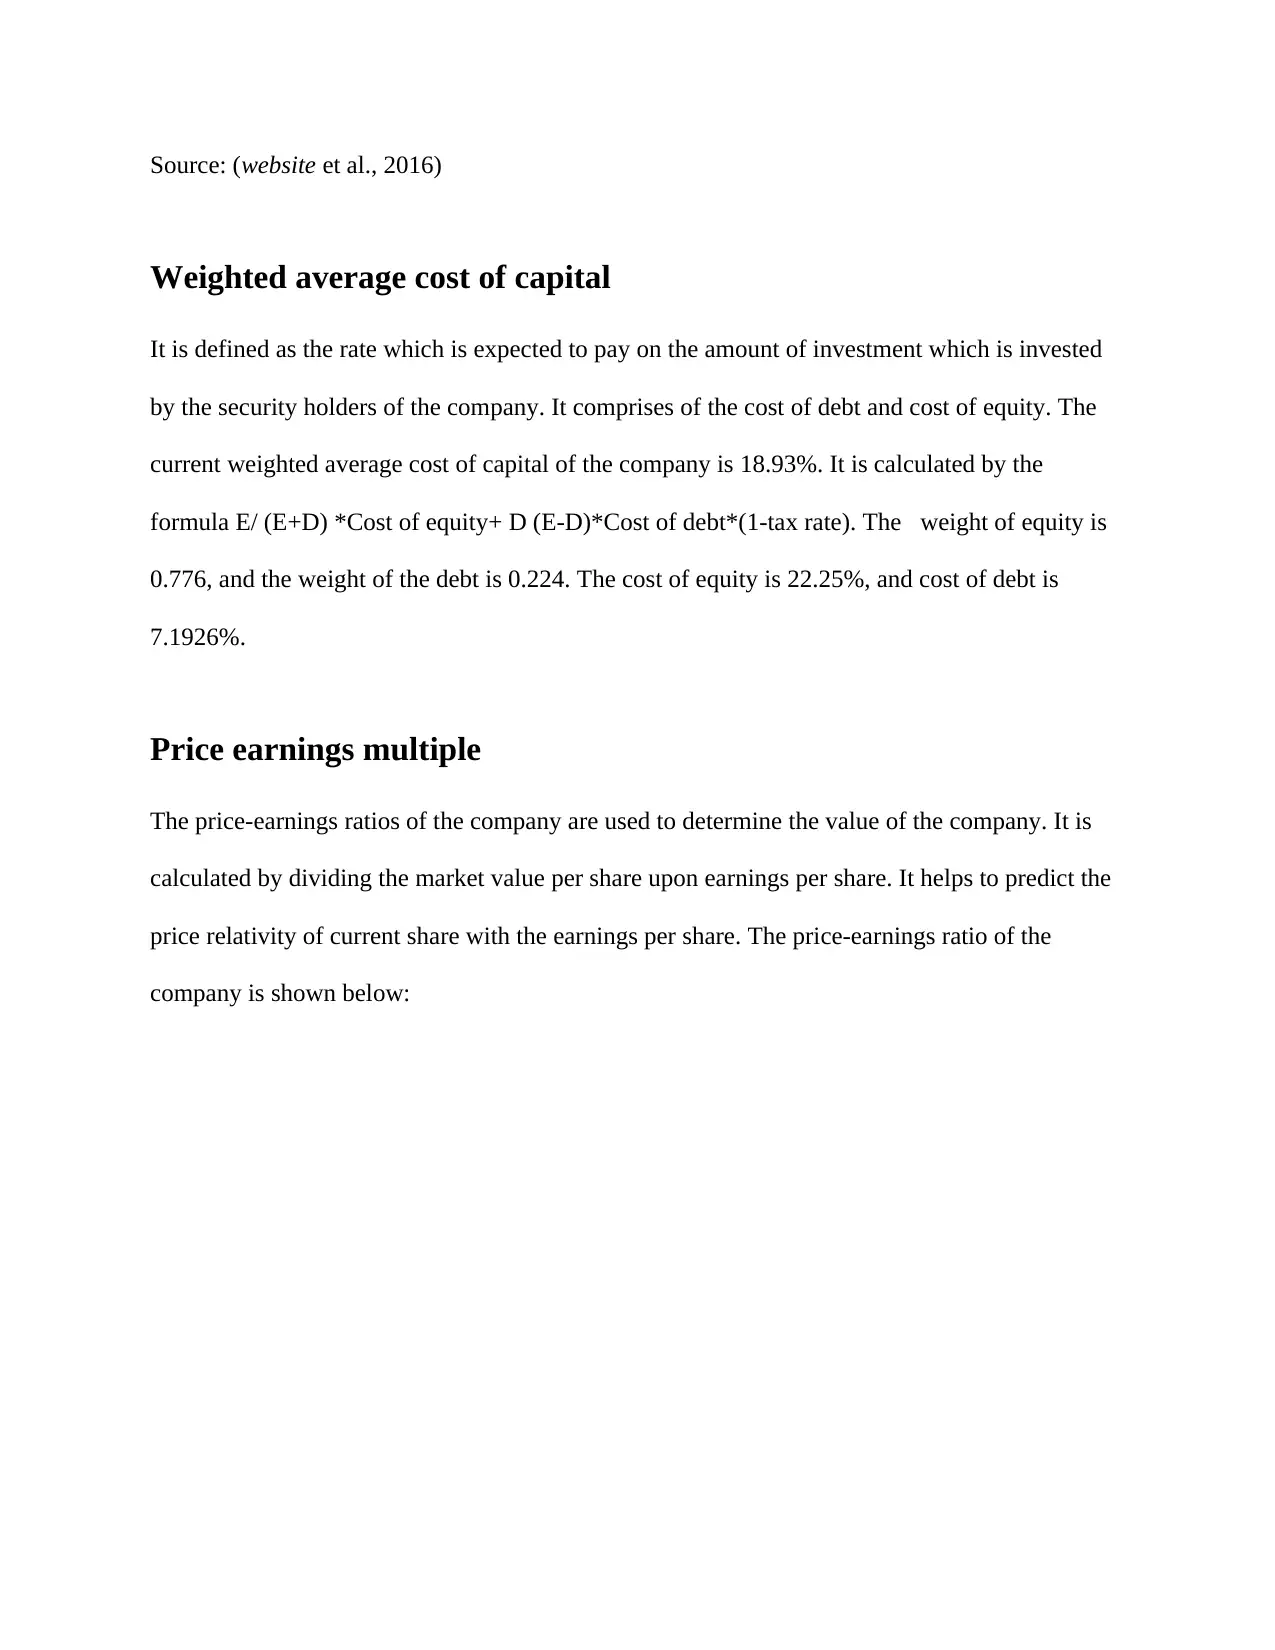
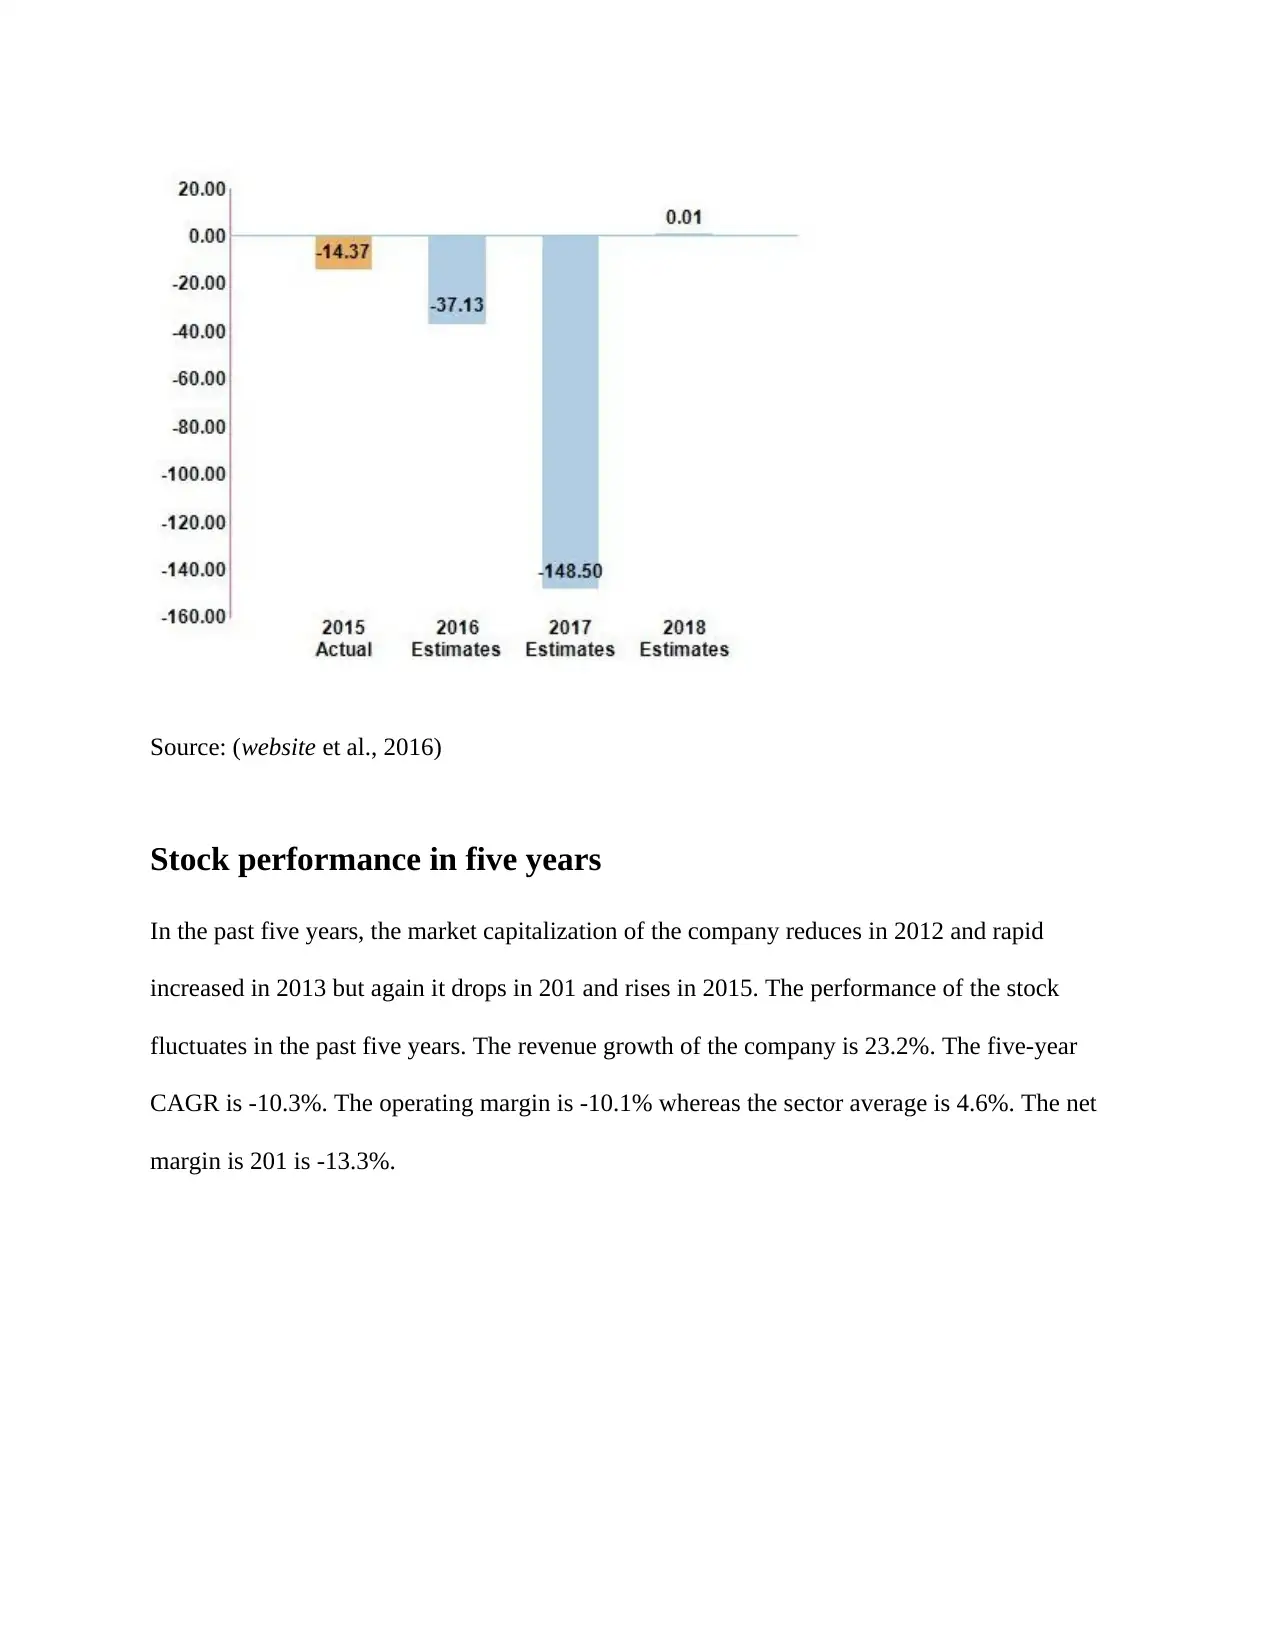
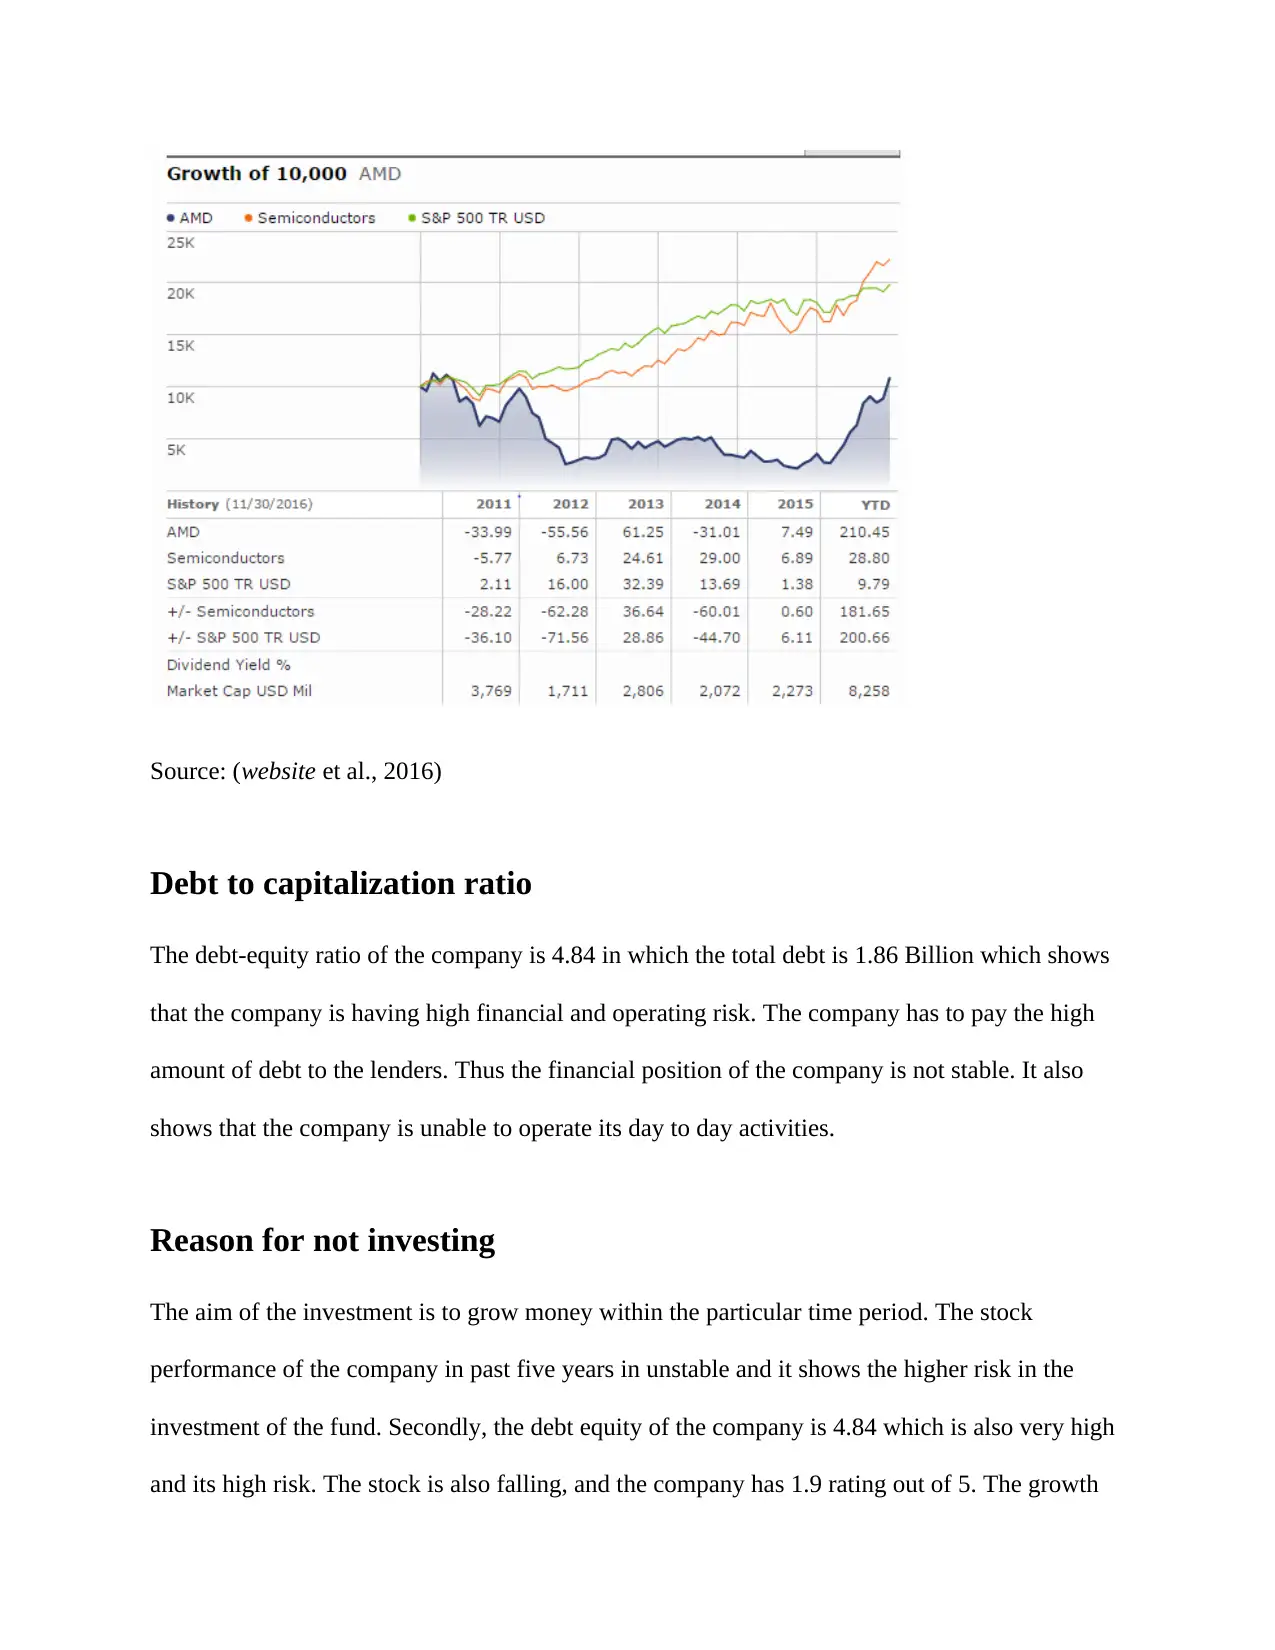
This report provides a detailed financial analysis of Advanced Micro Devices Inc. (AMD), a multinational semiconductor company. It examines the company's operational and financial risks, capital structure, and key financial ratios, including debt-to-total capitalization, beta, cost of debt and equity, and weighted average cost of capital (WACC). The analysis includes a review of the company's stock performance over the past five years, revenue growth, and profitability metrics such as operating margin and net margin. The report also provides an assessment of AMD's investment potential, considering its financial stability and performance. The conclusion provides a rationale for not investing in the company, considering the high debt-equity ratio, unstable stock performance, and negative financial indicators, such as a negative net income and return on capital investment.

Advance micro devices Inc.
Corporate Finance
Corporate Finance
Paraphrase This Document
Need a fresh take? Get an instant paraphrase of this document with our AI Paraphraser

Introduction
In this present paper, we will discuss the financial ratios of Advance micro devices Inc. which is
a multinational semiconductor company of America. The company is based in Sunnyvale,
California, the United States. The company provides computer processors and related
technologies for the consumer market and business. The main products of the company include
motherboard chips, microprocessors, embedded processors, server workstation, graphic
processor and others. The company traded under NASDAQ and it lies under the semiconductor
industry. It is the second largest supplier, and the company serves its products worldwide. The
total equity of the company is $385 Million, and total assets of the company are 3.616 Billion
(Global Provider of Innovative Graphics, Processors and Media Solutions et al., 2016).
Operating risk
The operating risk is defined as the risk which is summarised by the company at the time of
operating within the particular industry. The operational risk remains after predicting the
systematic and financial risk. The company faces various operational risks such as human
resource, system, internal procedure (Makaew et al., 2015). The operational risk of the company
includes a risk of a breakdown in internal procedure, inability to perform the operations
successfully by human risk, fraud risk, the risk of recruiting ineffective human resources and risk
of wrong internal management decision.

Financial risk
The financial risk is defined as the risk which includes the loss of money by the shareholders due
to investing in the particular debt due to which the company is unable to meet its financial
obligations. It is the risk which is related to the financial industry. The risk is related to the
financial transactions such as the loan of the company, investment of funds and others. There is
various type of financial risks such as credit risk, liquidity risk, the risk of change in price, and
currency risk. The credit risk is the default risk in which there is a risk of the borrower to pay the
borrowed amount. The liquidity risk is defined as the risk which is faced by the company due to
an inability of purchase and sale of securities in the volatile market. The debt to total
capitalization ratio of the company in 2014 is 10.88 which shows that the company has high
financial risk because of having high debt contribution in the capital of the company which needs
to repaid to the lenders but the company is taking the risk in order to get higher profit.
Preferred Stock
The preferred stock is defined as the class of ownership in which the shareholders are preferred
firstly at the time of distributing dividend, and the amount of dividend is fixed. The preference
shareholders are also preferred first at the time of winding up of an organisation. No, the
company does not have preferred stock.
Capital structure
The capital structure is the total sources of finance which are used by the company for its
operations and growth (Rampini et al., 2013). The capital structure of the company includes
⊘ This is a preview!⊘
Do you want full access?
Subscribe today to unlock all pages.

Trusted by 1+ million students worldwide

equity, debts, common stock, long-term debt, and short-term debt. The capital structure is shown
below:
Source: (website et al., 2016)
Current actual beta
The beta is defined as the measure which is used in a fundamental analysis to predict the
volatility of portfolio in relation to the overall market. The current actual beta of the company is
2.7. Thus it is higher than one which shows that the volatility of Advanced Micro Devices, Inc. is
higher than the market volatility.
Unlevered Beta of the company
The formula for calculating Unlevered beta is beta / 1 + (1 - tax rate) x (debt / equity). The
unleveraged beta of the company is 1.78. The unleveraged beta does not include the liabilities
and debts of the company.
Paraphrase This Document
Need a fresh take? Get an instant paraphrase of this document with our AI Paraphraser

Current marginal tax rate
The current marginal rate is defined as the percentage of tax which is levied on the income of
each bracket. It is the percentage which is taken from the taxable income. The marginal tax rate
comprises of state, federal and local income tax (Romer et al., 2014). The current marginal rate is
defined as the tax which is paid on the additional dollar of income. The current profit marginal
tax rate is 28.71%.
Source: (website et al., 2016)
Cost of debt after and before
The cost of debt is defined as the effective rate which is paid by the company on the total amount
of current debt within the particular accounting period. The cost of debt before is 7.1926% which
is calculated by dividing interest expense upon the cost of debt. The interest expense is 160 and
cost of debt is 2224.5. The cost of debt after tax is 6.1%.

Cost of preferred stock
The cost of preferred stock is calculated by dividing the preferred dividend by the preferred stock
price plus the expected growth rate. The company does not have preferred stock, so the value of
preferred stock is zero.
Cost of equity
It is defined as the return which is paid by the company to its equity investors for compensating
the risk taken by the investors by investing the funds into the stock of the company. The formula
for calculating the cost of equity is a risk-free rate of return adds beta of asset multiplied by the
value which is determined after deducting risk-free rate of return from expected rate of the
market. The beta is 2.666, and the market premium is 7.5%. So the cost of equity is 22.25%.
Cash dividend yield
The dividend yield is defined as the sum of annual dividend per share of the company divided by
current price per share. The high dividend yield does not reflect the good financial position of the
company. The dividend yield of the company is zero. It is shown in the below chart:
⊘ This is a preview!⊘
Do you want full access?
Subscribe today to unlock all pages.

Trusted by 1+ million students worldwide

Source: (website et al., 2016)
Weighted average cost of capital
It is defined as the rate which is expected to pay on the amount of investment which is invested
by the security holders of the company. It comprises of the cost of debt and cost of equity. The
current weighted average cost of capital of the company is 18.93%. It is calculated by the
formula E/ (E+D) *Cost of equity+ D (E-D)*Cost of debt*(1-tax rate). The weight of equity is
0.776, and the weight of the debt is 0.224. The cost of equity is 22.25%, and cost of debt is
7.1926%.
Price earnings multiple
The price-earnings ratios of the company are used to determine the value of the company. It is
calculated by dividing the market value per share upon earnings per share. It helps to predict the
price relativity of current share with the earnings per share. The price-earnings ratio of the
company is shown below:
Paraphrase This Document
Need a fresh take? Get an instant paraphrase of this document with our AI Paraphraser

Source: (website et al., 2016)
Stock performance in five years
In the past five years, the market capitalization of the company reduces in 2012 and rapid
increased in 2013 but again it drops in 201 and rises in 2015. The performance of the stock
fluctuates in the past five years. The revenue growth of the company is 23.2%. The five-year
CAGR is -10.3%. The operating margin is -10.1% whereas the sector average is 4.6%. The net
margin is 201 is -13.3%.

Source: (website et al., 2016)
Debt to capitalization ratio
The debt-equity ratio of the company is 4.84 in which the total debt is 1.86 Billion which shows
that the company is having high financial and operating risk. The company has to pay the high
amount of debt to the lenders. Thus the financial position of the company is not stable. It also
shows that the company is unable to operate its day to day activities.
Reason for not investing
The aim of the investment is to grow money within the particular time period. The stock
performance of the company in past five years in unstable and it shows the higher risk in the
investment of the fund. Secondly, the debt equity of the company is 4.84 which is also very high
and its high risk. The stock is also falling, and the company has 1.9 rating out of 5. The growth
⊘ This is a preview!⊘
Do you want full access?
Subscribe today to unlock all pages.

Trusted by 1+ million students worldwide

of the company is very low which 23.2% is in 2016. The long-term growth in past five year is -
10.3%. The operating margin is -10.1% whereas the sector average is 4.6%. The net profit in the
past five quarter is -13.3%. The net income of the company is -406 Million. The return of capital
investment is -24.9% due to which it is not profitable to invest in the stock of Advance micro
devices Inc.
Paraphrase This Document
Need a fresh take? Get an instant paraphrase of this document with our AI Paraphraser

References
Global Provider of Innovative Graphics, Processors and Media Solutions | AMD.
(2016). Amd.com. Retrieved 2 December 2016, from http://www.amd.com/en-gb
Makaew, T., & Maksimovic, V. (2015). Industry Shocks, Operating Risk, and Corporate
Financial Policies around the World. Operating Risk, and Corporate Financial Policies around
the World (July 1, 2015).
website. (2016). NASDAQ.com. Retrieved 2 December 2016, from
http://www.nasdaq.com/symbol/amd/pe-ratio
Rampini, A. A., & Viswanathan, S. (2013). Collateral and capital structure. Journal of Financial
Economics, 109(2), 466-492.
Romer, C. D., & Romer, D. H. (2014). The incentive effects of marginal tax rates: Evidence
from the interwar era. American Economic Journal: Economic Policy, 6(3), 242-281.
1 out of 11
Related Documents

Your All-in-One AI-Powered Toolkit for Academic Success.
 +13062052269
info@desklib.com
Available 24*7 on WhatsApp / Email
Unlock your academic potential
Copyright © 2020–2025 A2Z Services. All Rights Reserved. Developed and managed by ZUCOL.