Comprehensive Financial Management Project: AME Case Study Analysis
VerifiedAdded on 2020/11/23
|18
|3632
|423
Report
AI Summary
This financial management project analyzes the case of AME, a company considering investment in a new business. The project begins with an introduction to financial management principles, followed by an analysis of relevant costs, including opportunity and cannibalization costs. It then explores depreciation methods, estimating cash flows, and calculating the payback period and Net Present Value (NPV) of the investment. Sensitivity analysis is performed to assess the impact of changes in sales, marketing campaigns, and operating costs. The project provides recommendations to AME's management based on the analysis, comparing different scenarios and advising on whether to invest in the new business or lease the building. The report concludes with a summary of findings and a list of references.

FINANCIAL MANAGEMENT WRITTEN
PROJECT
PROJECT
Paraphrase This Document
Need a fresh take? Get an instant paraphrase of this document with our AI Paraphraser
TABLE OF CONTENTS
INTRODUCTION...........................................................................................................................1
TASK...............................................................................................................................................1
1. Costs which have relevance or not for evaluation of project.............................................1
2. Analysis of Possible Opportunity and Cannibalization costs.............................................2
3. Method of Depreciation......................................................................................................2
4. Estimation of Cash Flows for Evaluation of Project..........................................................3
5. Estimation of Pack Period of Capital Investment...............................................................4
6. Calculation of Net Present Value.......................................................................................4
7. Sensitivity analysis on given points-:.................................................................................4
8. Advising AME’s Management...........................................................................................5
CONCLUSION................................................................................................................................6
REFERENCES................................................................................................................................7
APPENDIX......................................................................................................................................8
1..............................................................................................................................................8
2..............................................................................................................................................9
3..............................................................................................................................................9
4............................................................................................................................................10
5............................................................................................................................................12
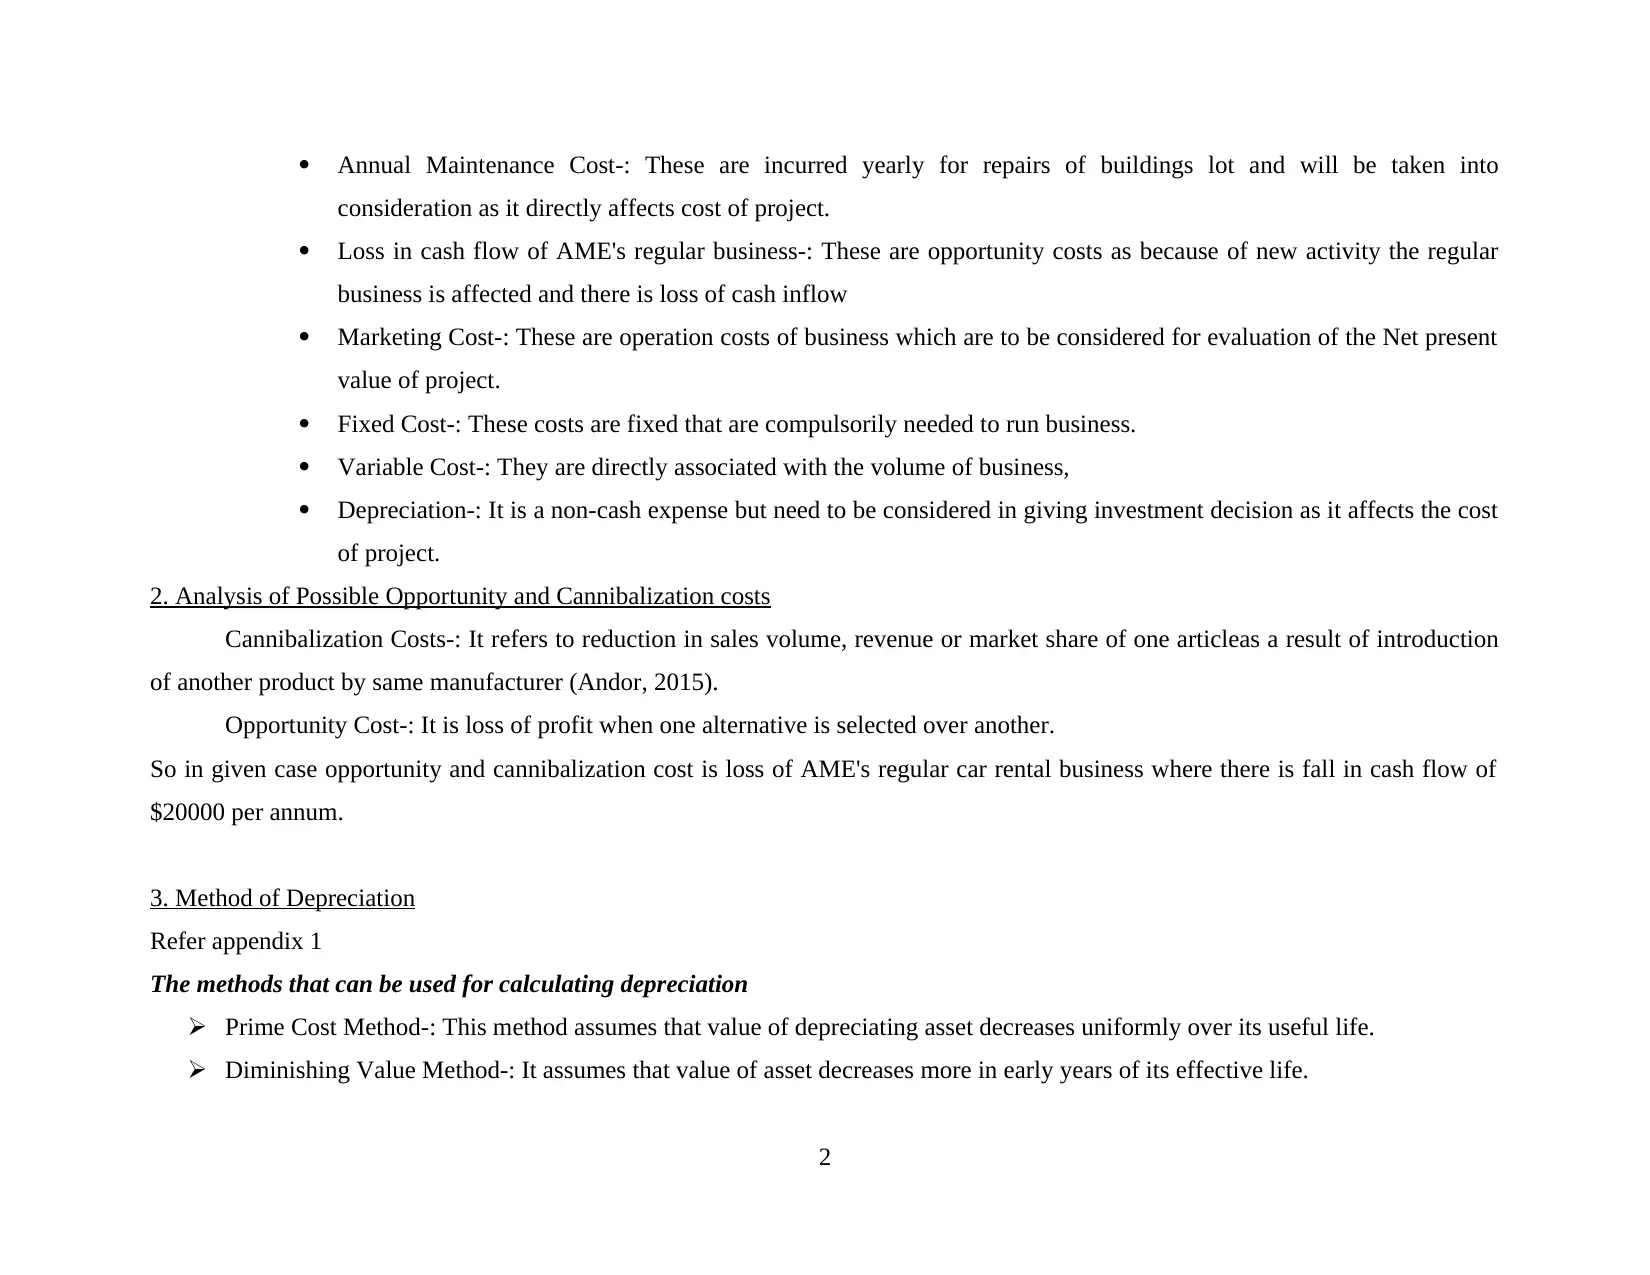
INTRODUCTION
Financial management can be defined as the preparation, direction and management of monetary activities of any company
such as buying, selling and using cash for best results and maximizing wealth to produce best value of money (Harrison, 2017). It can
also be defined as management of finance in order to achieve financial objectives (DeFusco, 2015.). The report will provide
recommendations that will help in decision making to AME's Management.
TASK
1. Costs which have relevance or not for evaluation of project
Cost is the value of money that is used to manufacture something or to deliver a service (Gitman, 2015). It also refers to
monetary expenditure which firm incurs in order to purchase or to hire factors of production.
The given below are cost which helps in decision making.
Opportunity Cost-: It is cost of next best alternative that is sacrificed for pursuing the chosen action.
Sunk Cost-: These can be said as irrevocable cost of past business which has to be incurred and is irrelevant to current
business activity (Daunfeldt, 2014).
Replacement Cost-: Cost that are incurred for replacement of any asset. For Ex-: Setup of roofing for installing machinery.
Conversion Cost-: Cost that are involved in Transformation of raw material in finished goods.
Costs On the Basis of Nature-:
1. Fixed Cost-: These are cost of fixed inputs that are used in production. This does not vary with the change in volume of
production.
2. Variable Costs-: It can be said as cost of variable inputs used in production. These varies with change in volume of
production.
So, in the given case cost that are relevant for evaluation of project are-:
1
⊘ This is a preview!⊘
Do you want full access?
Subscribe today to unlock all pages.
Trusted by 1+ million students worldwide
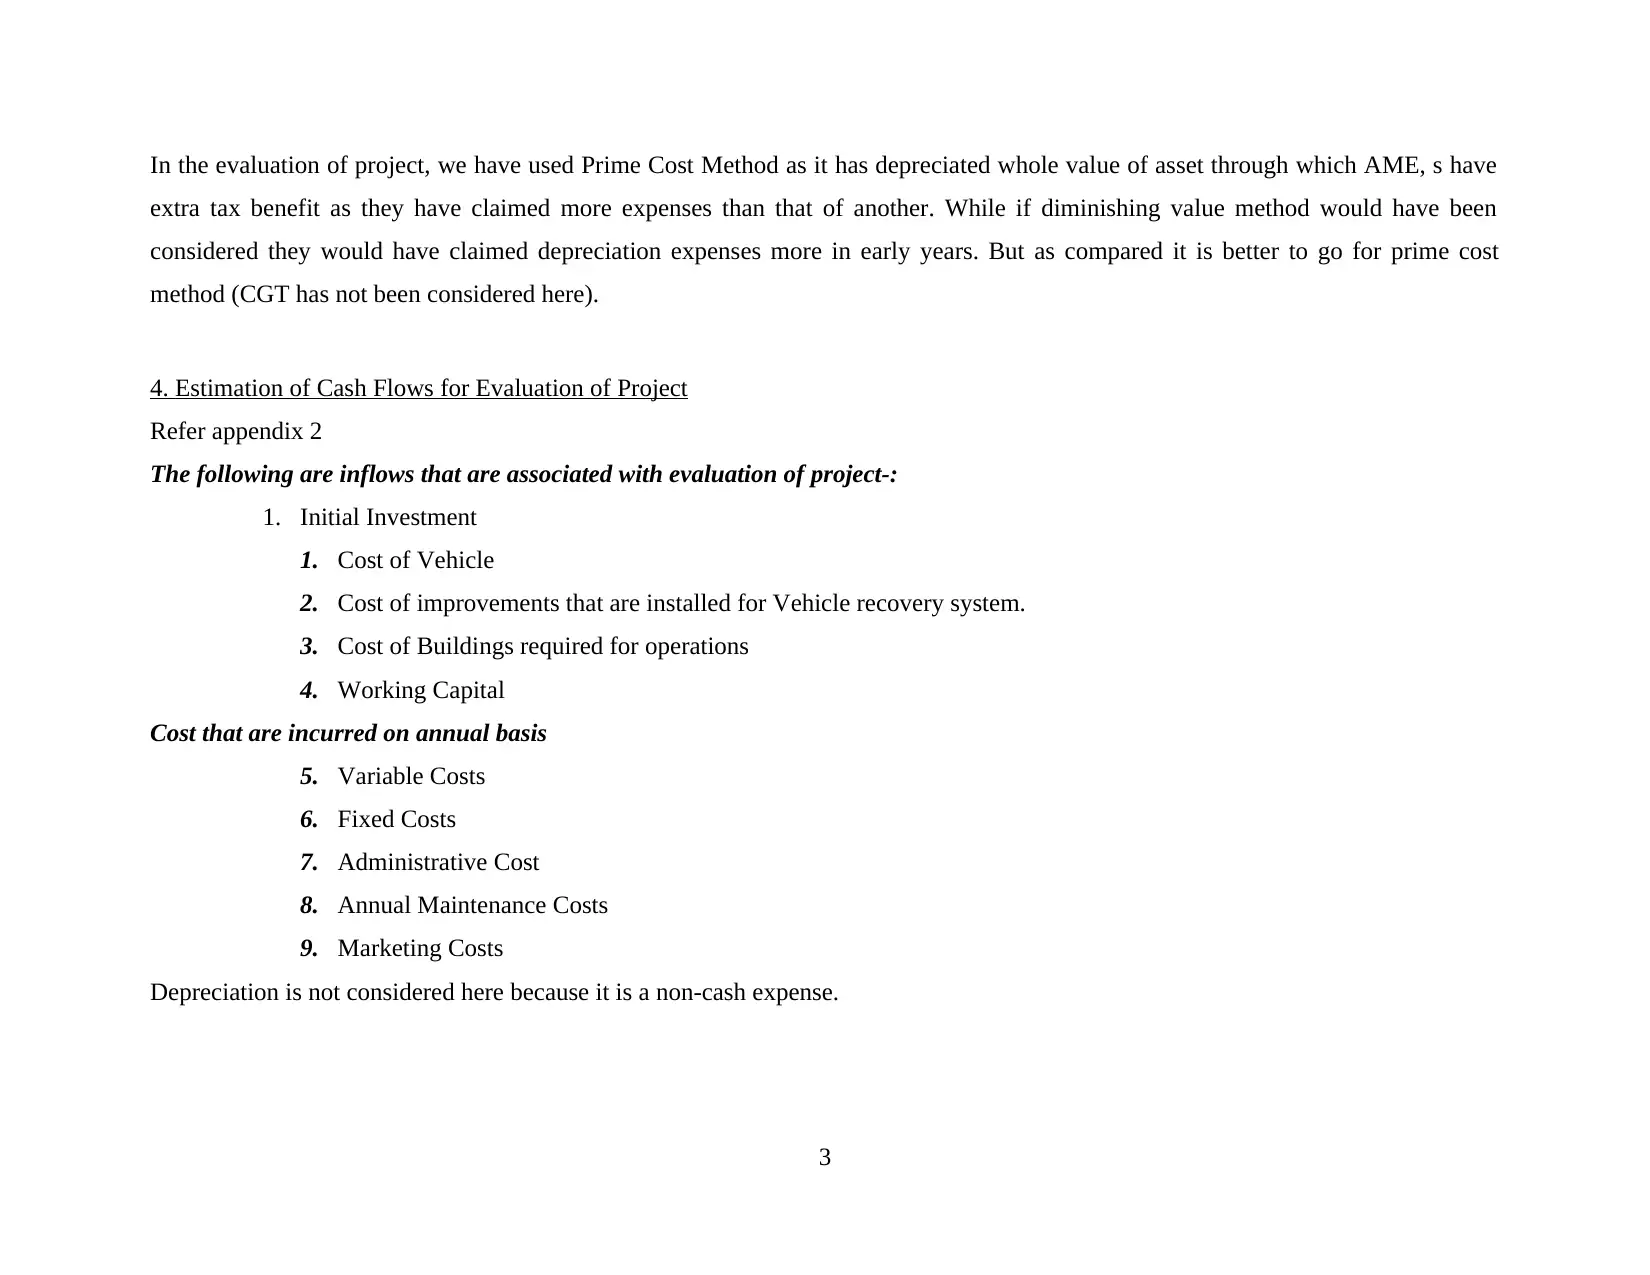
Annual Maintenance Cost-: These are incurred yearly for repairs of buildings lot and will be taken into
consideration as it directly affects cost of project.
Loss in cash flow of AME's regular business-: These are opportunity costs as because of new activity the regular
business is affected and there is loss of cash inflow
Marketing Cost-: These are operation costs of business which are to be considered for evaluation of the Net present
value of project.
Fixed Cost-: These costs are fixed that are compulsorily needed to run business.
Variable Cost-: They are directly associated with the volume of business,
Depreciation-: It is a non-cash expense but need to be considered in giving investment decision as it affects the cost
of project.
2. Analysis of Possible Opportunity and Cannibalization costs
Cannibalization Costs-: It refers to reduction in sales volume, revenue or market share of one articleas a result of introduction
of another product by same manufacturer (Andor, 2015).
Opportunity Cost-: It is loss of profit when one alternative is selected over another.
So in given case opportunity and cannibalization cost is loss of AME's regular car rental business where there is fall in cash flow of
$20000 per annum.
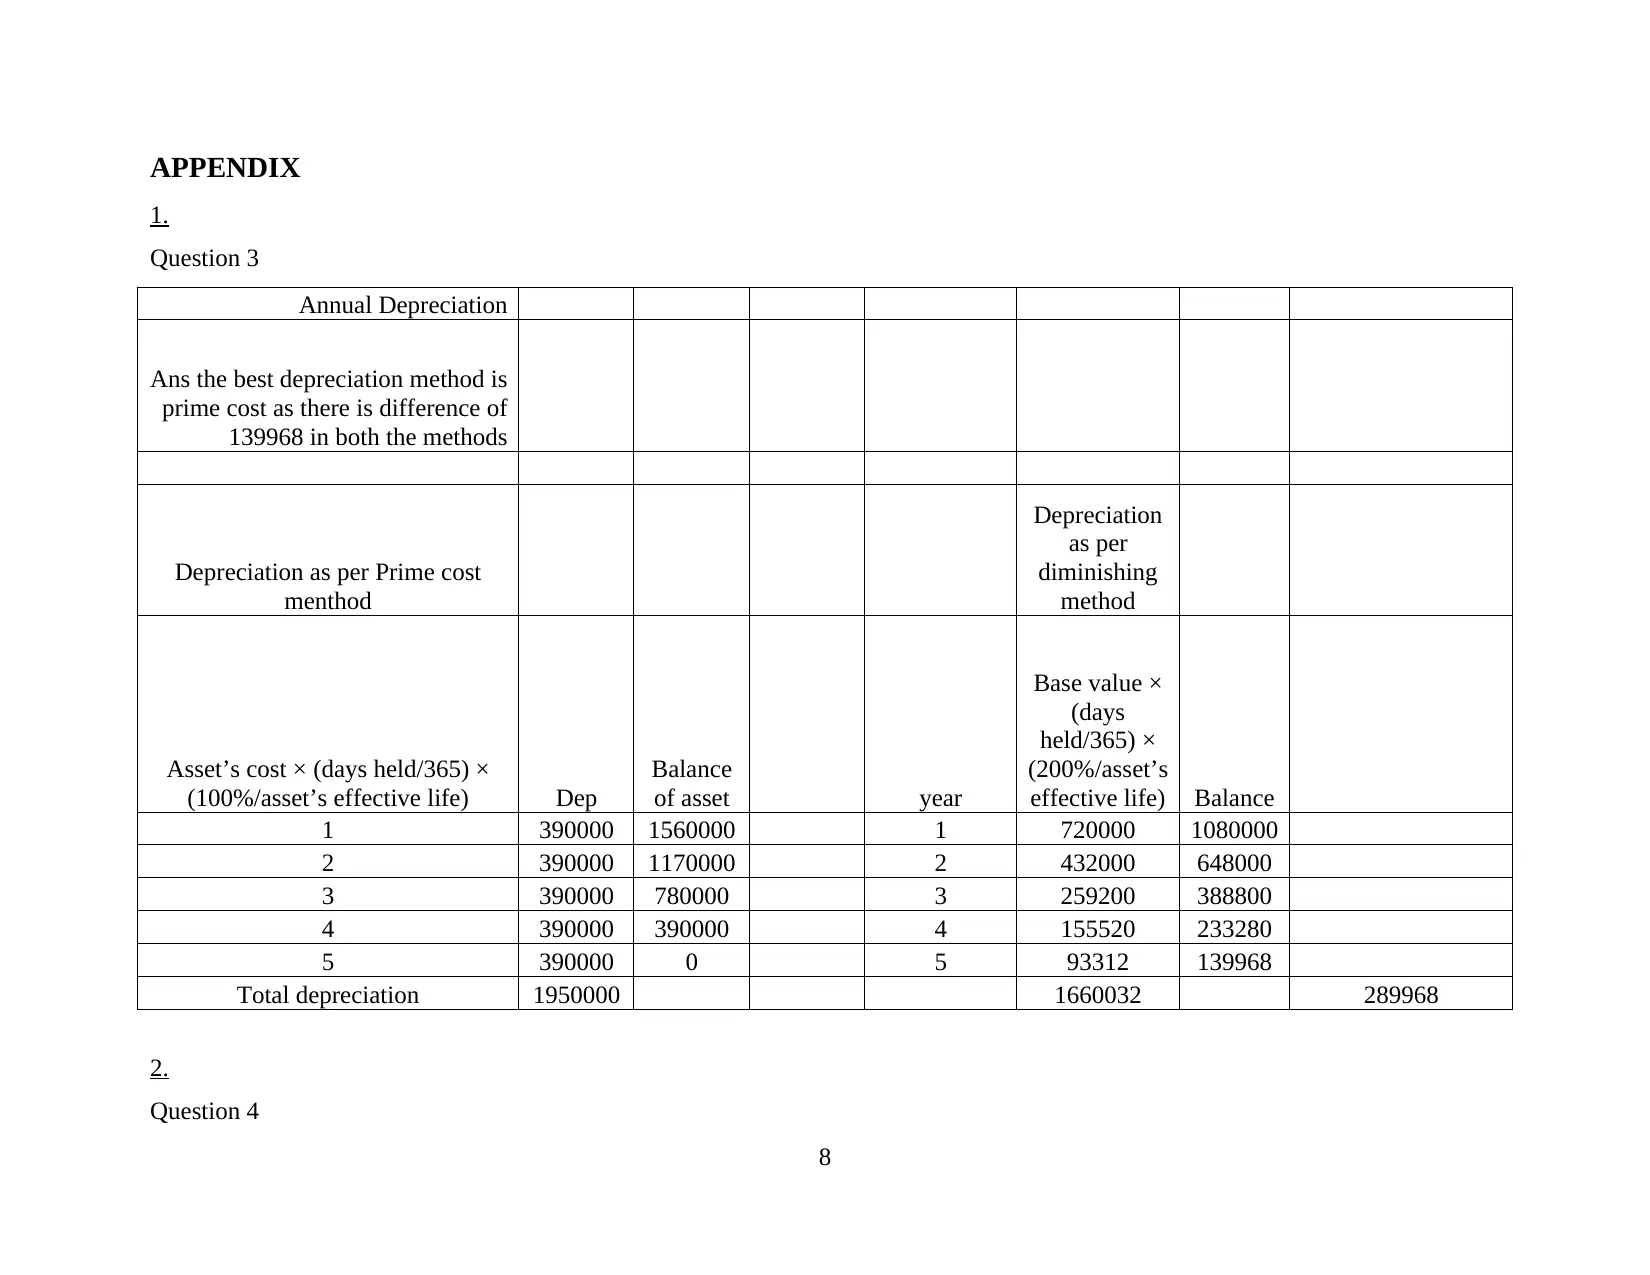
3. Method of Depreciation
Refer appendix 1
The methods that can be used for calculating depreciation
Prime Cost Method-: This method assumes that value of depreciating asset decreases uniformly over its useful life.
Diminishing Value Method-: It assumes that value of asset decreases more in early years of its effective life.
2
consideration as it directly affects cost of project.
Loss in cash flow of AME's regular business-: These are opportunity costs as because of new activity the regular
business is affected and there is loss of cash inflow
Marketing Cost-: These are operation costs of business which are to be considered for evaluation of the Net present
value of project.
Fixed Cost-: These costs are fixed that are compulsorily needed to run business.
Variable Cost-: They are directly associated with the volume of business,
Depreciation-: It is a non-cash expense but need to be considered in giving investment decision as it affects the cost
of project.
2. Analysis of Possible Opportunity and Cannibalization costs
Cannibalization Costs-: It refers to reduction in sales volume, revenue or market share of one articleas a result of introduction
of another product by same manufacturer (Andor, 2015).
Opportunity Cost-: It is loss of profit when one alternative is selected over another.
So in given case opportunity and cannibalization cost is loss of AME's regular car rental business where there is fall in cash flow of
$20000 per annum.
3. Method of Depreciation
Refer appendix 1
The methods that can be used for calculating depreciation
Prime Cost Method-: This method assumes that value of depreciating asset decreases uniformly over its useful life.
Diminishing Value Method-: It assumes that value of asset decreases more in early years of its effective life.
2
Paraphrase This Document
Need a fresh take? Get an instant paraphrase of this document with our AI Paraphraser
In the evaluation of project, we have used Prime Cost Method as it has depreciated whole value of asset through which AME, s have
extra tax benefit as they have claimed more expenses than that of another. While if diminishing value method would have been
considered they would have claimed depreciation expenses more in early years. But as compared it is better to go for prime cost
method (CGT has not been considered here).
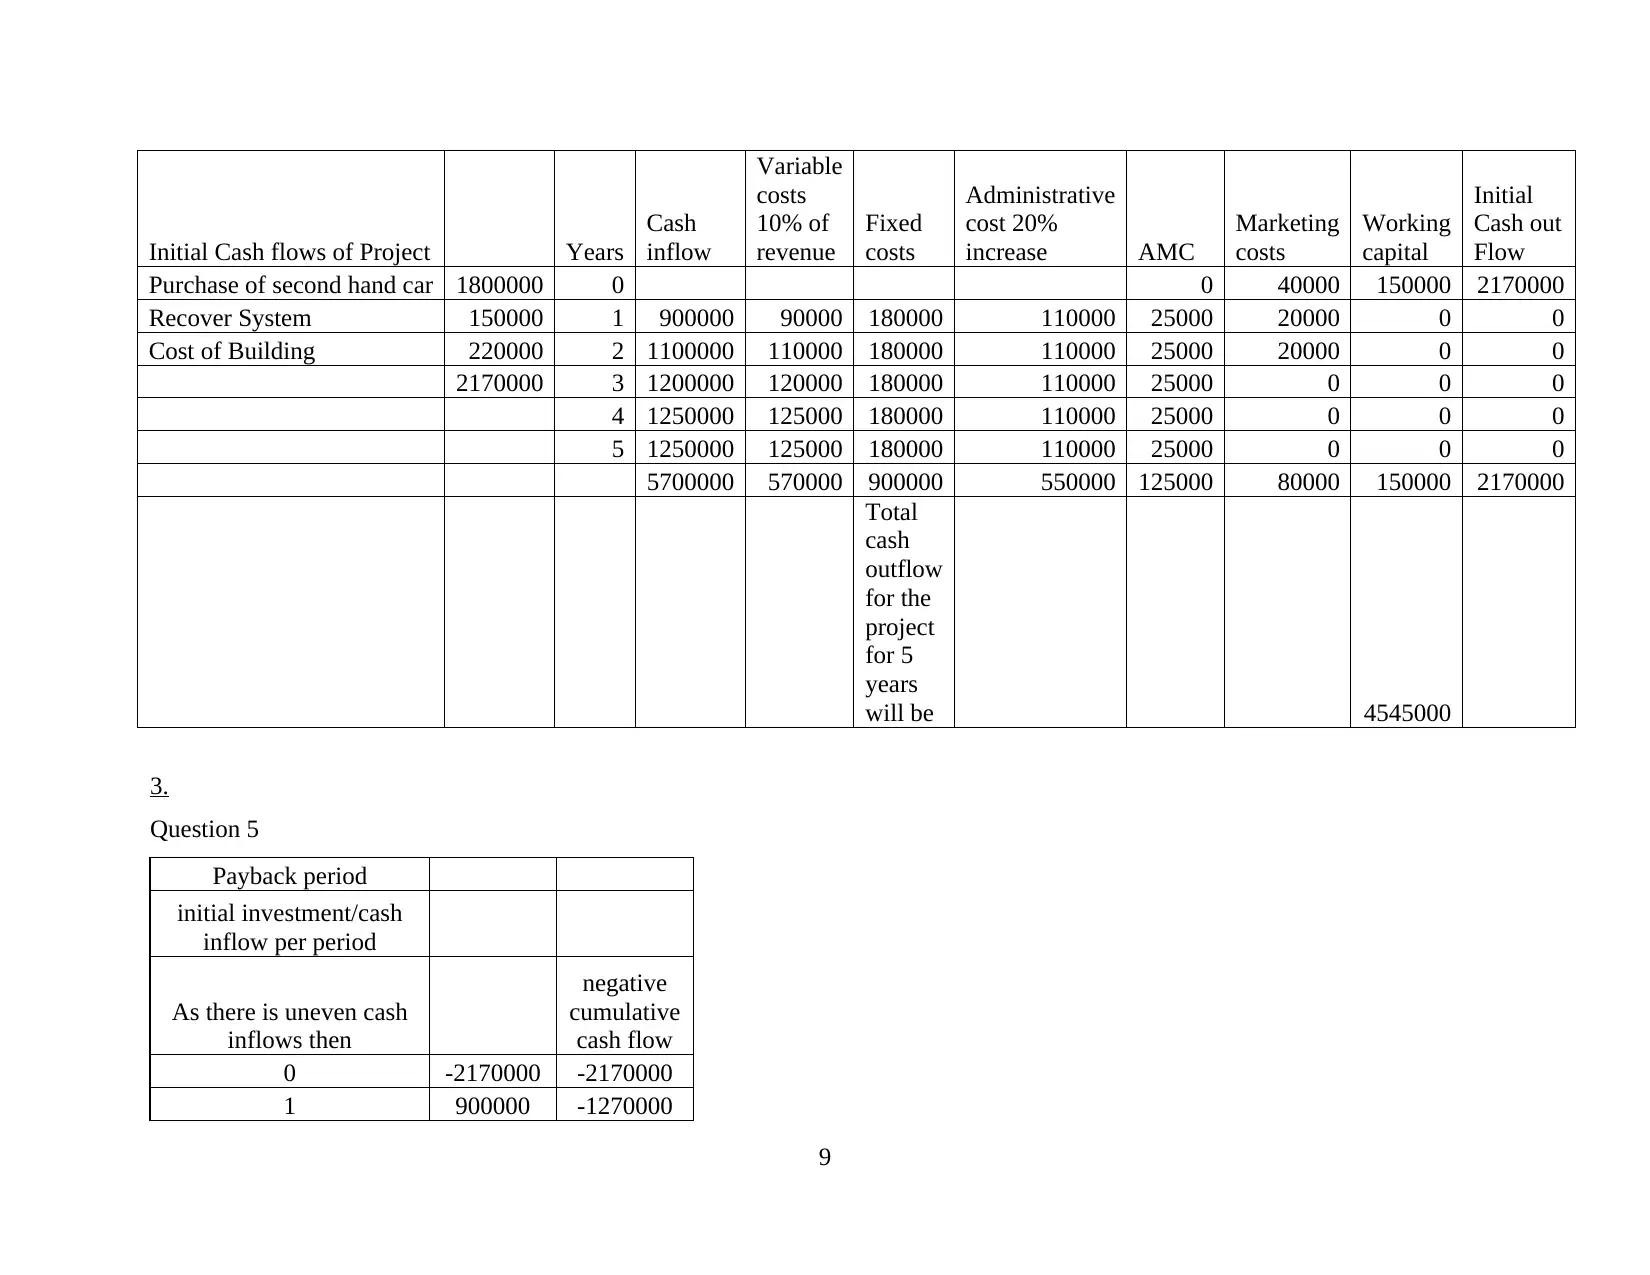
4. Estimation of Cash Flows for Evaluation of Project
Refer appendix 2
The following are inflows that are associated with evaluation of project-:
1. Initial Investment
1. Cost of Vehicle
2. Cost of improvements that are installed for Vehicle recovery system.
3. Cost of Buildings required for operations
4. Working Capital
Cost that are incurred on annual basis
5. Variable Costs
6. Fixed Costs
7. Administrative Cost
8. Annual Maintenance Costs
9. Marketing Costs
Depreciation is not considered here because it is a non-cash expense.
3
extra tax benefit as they have claimed more expenses than that of another. While if diminishing value method would have been
considered they would have claimed depreciation expenses more in early years. But as compared it is better to go for prime cost
method (CGT has not been considered here).
4. Estimation of Cash Flows for Evaluation of Project
Refer appendix 2
The following are inflows that are associated with evaluation of project-:
1. Initial Investment
1. Cost of Vehicle
2. Cost of improvements that are installed for Vehicle recovery system.
3. Cost of Buildings required for operations
4. Working Capital
Cost that are incurred on annual basis
5. Variable Costs
6. Fixed Costs
7. Administrative Cost
8. Annual Maintenance Costs
9. Marketing Costs
Depreciation is not considered here because it is a non-cash expense.
3
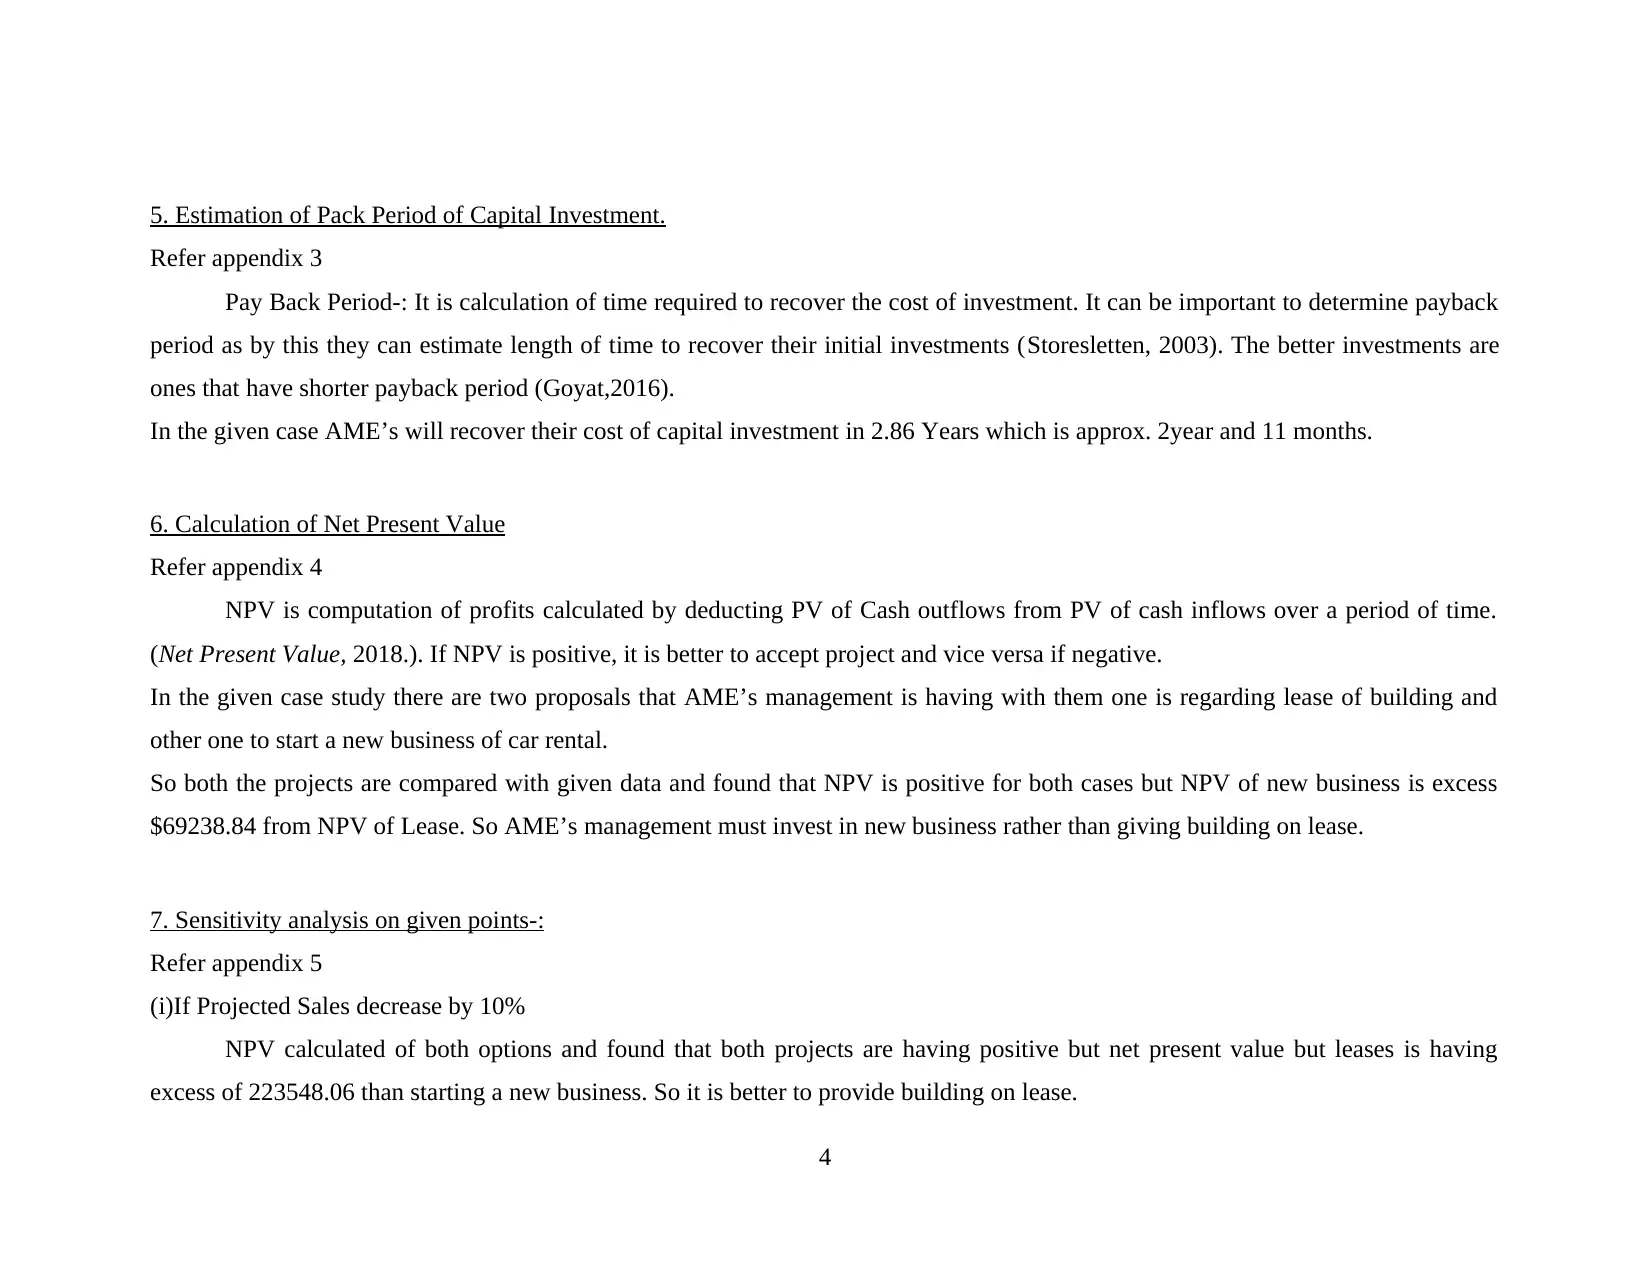
5. Estimation of Pack Period of Capital Investment.
Refer appendix 3
Pay Back Period-: It is calculation of time required to recover the cost of investment. It can be important to determine payback
period as by this they can estimate length of time to recover their initial investments (Storesletten, 2003). The better investments are
ones that have shorter payback period (Goyat,2016).
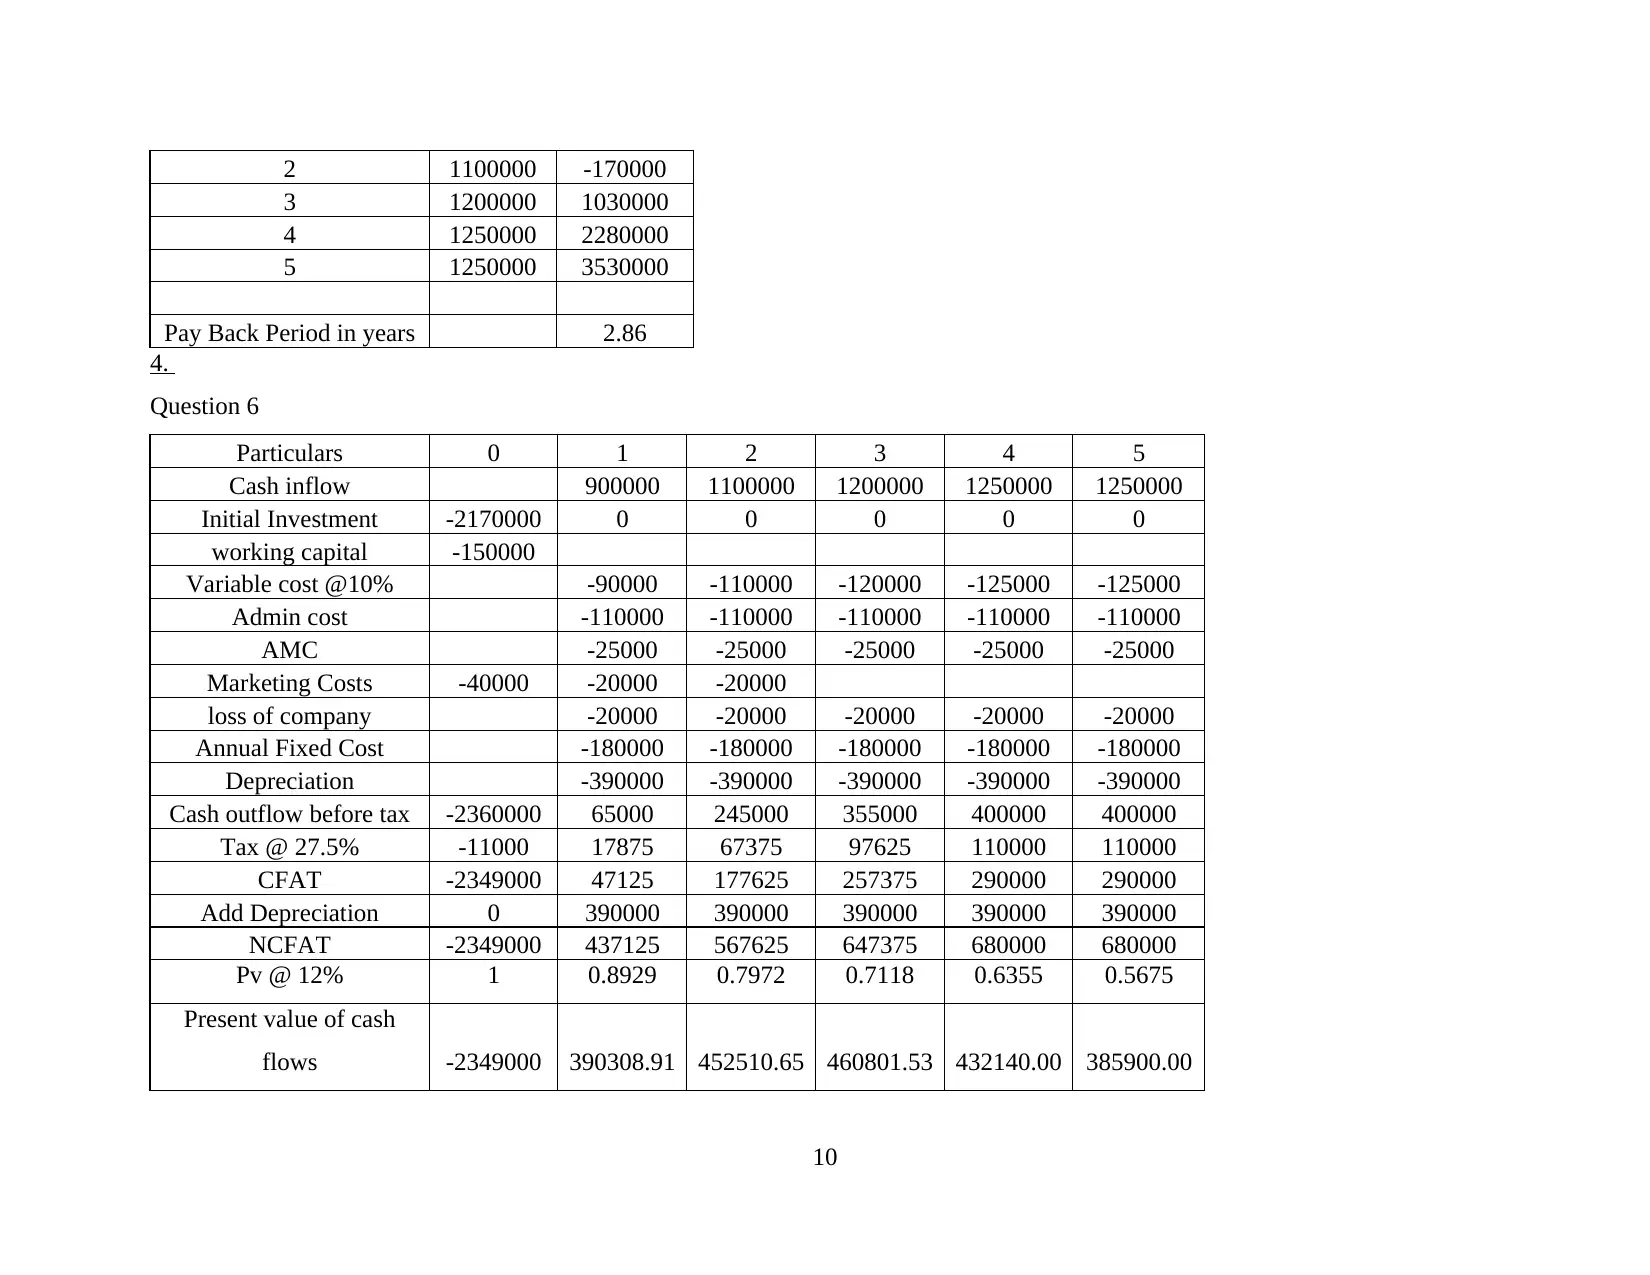
In the given case AME’s will recover their cost of capital investment in 2.86 Years which is approx. 2year and 11 months.
6. Calculation of Net Present Value
Refer appendix 4
NPV is computation of profits calculated by deducting PV of Cash outflows from PV of cash inflows over a period of time.
(Net Present Value, 2018.). If NPV is positive, it is better to accept project and vice versa if negative.
In the given case study there are two proposals that AME’s management is having with them one is regarding lease of building and
other one to start a new business of car rental.
So both the projects are compared with given data and found that NPV is positive for both cases but NPV of new business is excess
$69238.84 from NPV of Lease. So AME’s management must invest in new business rather than giving building on lease.
7. Sensitivity analysis on given points-:
Refer appendix 5
(i)If Projected Sales decrease by 10%
NPV calculated of both options and found that both projects are having positive but net present value but leases is having
excess of 223548.06 than starting a new business. So it is better to provide building on lease.
4
Refer appendix 3
Pay Back Period-: It is calculation of time required to recover the cost of investment. It can be important to determine payback
period as by this they can estimate length of time to recover their initial investments (Storesletten, 2003). The better investments are
ones that have shorter payback period (Goyat,2016).
In the given case AME’s will recover their cost of capital investment in 2.86 Years which is approx. 2year and 11 months.
6. Calculation of Net Present Value
Refer appendix 4
NPV is computation of profits calculated by deducting PV of Cash outflows from PV of cash inflows over a period of time.
(Net Present Value, 2018.). If NPV is positive, it is better to accept project and vice versa if negative.
In the given case study there are two proposals that AME’s management is having with them one is regarding lease of building and
other one to start a new business of car rental.
So both the projects are compared with given data and found that NPV is positive for both cases but NPV of new business is excess
$69238.84 from NPV of Lease. So AME’s management must invest in new business rather than giving building on lease.
7. Sensitivity analysis on given points-:
Refer appendix 5
(i)If Projected Sales decrease by 10%
NPV calculated of both options and found that both projects are having positive but net present value but leases is having
excess of 223548.06 than starting a new business. So it is better to provide building on lease.
4
⊘ This is a preview!⊘
Do you want full access?
Subscribe today to unlock all pages.
Trusted by 1+ million students worldwide
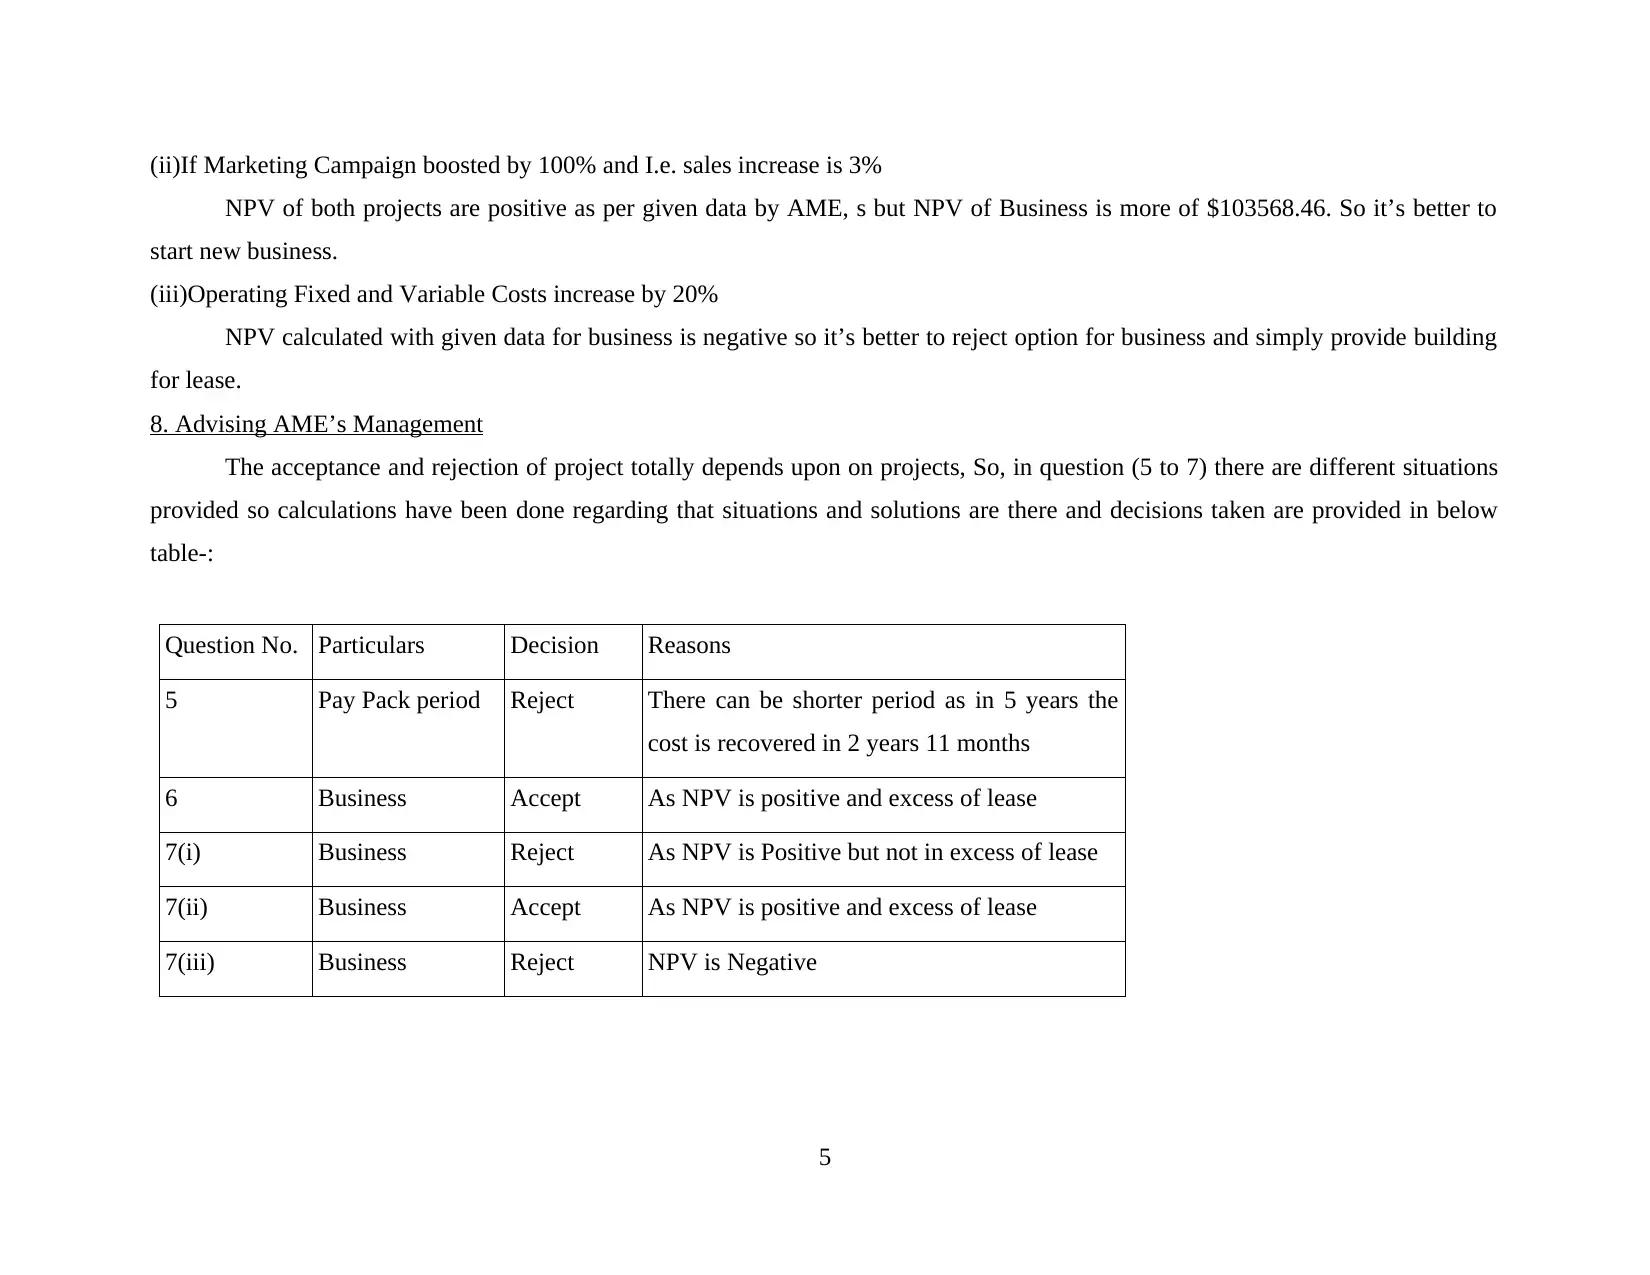
(ii)If Marketing Campaign boosted by 100% and I.e. sales increase is 3%
NPV of both projects are positive as per given data by AME, s but NPV of Business is more of $103568.46. So it’s better to
start new business.
(iii)Operating Fixed and Variable Costs increase by 20%
NPV calculated with given data for business is negative so it’s better to reject option for business and simply provide building
for lease.
8. Advising AME’s Management
The acceptance and rejection of project totally depends upon on projects, So, in question (5 to 7) there are different situations
provided so calculations have been done regarding that situations and solutions are there and decisions taken are provided in below
table-:
Question No. Particulars Decision Reasons
5 Pay Pack period Reject There can be shorter period as in 5 years the
cost is recovered in 2 years 11 months
6 Business Accept As NPV is positive and excess of lease
7(i) Business Reject As NPV is Positive but not in excess of lease
7(ii) Business Accept As NPV is positive and excess of lease
7(iii) Business Reject NPV is Negative
5
Paraphrase This Document
Need a fresh take? Get an instant paraphrase of this document with our AI Paraphraser
CONCLUSION
This project report is solution for case study regarding investment in new business. So with data given by AME, management
the calculations have been done and provided decisions in different situations. There have been taken some assumptions where
needed. All the decisions are totally dependent on data given by AME’s management. The calculations have been made with different
techniques of capital budgeting.
6
REFERENCES
Books and Journals:
Andor, G., Mohanty, S.K. and Toth, T., 2015. Capital budgeting practices: A survey of Central and Eastern European firms. Emerging
Markets Review. 23.pp.148-172
Daunfeldt, S.O. and Hartwig, F. 2014. What determines the use of capital budgeting methods? Evidence from Swedish listed
companies. Journal of Finance and Economics.2(4). pp.101-112.
DeFusco, R.A., and et.al. 2015. Quantitative investment analysis. John Wiley & Sons.
Gitman, L.J., Juchau, R. and Flanagan, J. 2015. Principles of managerial finance. Pearson Higher Education AU.
Goyat, S. and Nain, A., 2016. Methods of Evaluating Investment Proposals. International Journal of Engineering and Management
Research (IJEMR).6(5). pp.278-280.
Harrison, F. and Lock, D. 2017. Advanced project management: a structured approach. Routledge
Storesletten, K., 2003. Fiscal implications of immigration—A net present value calculation. Scandinavian Journal of Economics.
105(3). pp.487-506.
Online:
Net Present Value. 2018. [Online]. Available through: <https://investinganswers.com/financial-dictionary/technical-analysis/
net-present-value-npv-2995>.
7
⊘ This is a preview!⊘
Do you want full access?
Subscribe today to unlock all pages.
Trusted by 1+ million students worldwide
APPENDIX
1.
Question 3
Annual Depreciation
Ans the best depreciation method is
prime cost as there is difference of
139968 in both the methods
Depreciation as per Prime cost
menthod
Depreciation
as per
diminishing
method
Asset’s cost × (days held/365) ×
(100%/asset’s effective life) Dep
Balance
of asset year
Base value ×
(days
held/365) ×
(200%/asset’s
effective life) Balance
1 390000 1560000 1 720000 1080000
2 390000 1170000 2 432000 648000
3 390000 780000 3 259200 388800
4 390000 390000 4 155520 233280
5 390000 0 5 93312 139968
Total depreciation 1950000 1660032 289968
2.
Question 4
8
Paraphrase This Document
Need a fresh take? Get an instant paraphrase of this document with our AI Paraphraser
Initial Cash flows of Project Years
Cash
inflow
Variable
costs
10% of
revenue
Fixed
costs
Administrative
cost 20%
increase AMC
Marketing
costs
Working
capital
Initial
Cash out
Flow
Purchase of second hand car 1800000 0 0 40000 150000 2170000
Recover System 150000 1 900000 90000 180000 110000 25000 20000 0 0
Cost of Building 220000 2 1100000 110000 180000 110000 25000 20000 0 0
2170000 3 1200000 120000 180000 110000 25000 0 0 0
4 1250000 125000 180000 110000 25000 0 0 0
5 1250000 125000 180000 110000 25000 0 0 0
5700000 570000 900000 550000 125000 80000 150000 2170000
Total
cash
outflow
for the
project
for 5
years
will be 4545000
3.
Question 5
Payback period
initial investment/cash
inflow per period
As there is uneven cash
inflows then
negative
cumulative
cash flow
0 -2170000 -2170000
1 900000 -1270000
9
2 1100000 -170000
3 1200000 1030000
4 1250000 2280000
5 1250000 3530000
Pay Back Period in years 2.86
4.
Question 6
Particulars 0 1 2 3 4 5
Cash inflow 900000 1100000 1200000 1250000 1250000
Initial Investment -2170000 0 0 0 0 0
working capital -150000
Variable cost @10% -90000 -110000 -120000 -125000 -125000
Admin cost -110000 -110000 -110000 -110000 -110000
AMC -25000 -25000 -25000 -25000 -25000
Marketing Costs -40000 -20000 -20000
loss of company -20000 -20000 -20000 -20000 -20000
Annual Fixed Cost -180000 -180000 -180000 -180000 -180000
Depreciation -390000 -390000 -390000 -390000 -390000
Cash outflow before tax -2360000 65000 245000 355000 400000 400000
Tax @ 27.5% -11000 17875 67375 97625 110000 110000
CFAT -2349000 47125 177625 257375 290000 290000
Add Depreciation 0 390000 390000 390000 390000 390000
NCFAT -2349000 437125 567625 647375 680000 680000
Pv @ 12% 1 0.8929 0.7972 0.7118 0.6355 0.5675
Present value of cash
flows -2349000 390308.91 452510.65 460801.53 432140.00 385900.00
10
⊘ This is a preview!⊘
Do you want full access?
Subscribe today to unlock all pages.
Trusted by 1+ million students worldwide
1 out of 18
Related Documents


Your All-in-One AI-Powered Toolkit for Academic Success.
+13062052269
info@desklib.com
Available 24*7 on WhatsApp / Email
![[object Object]](/_next/static/media/star-bottom.7253800d.svg)
Unlock your academic potential
Copyright © 2020–2026 A2Z Services. All Rights Reserved. Developed and managed by ZUCOL.