University Tableau Assignment: American Trends Panel Wave 35 Analysis
VerifiedAdded on 2022/09/09
|7
|894
|19
Practical Assignment
AI Summary
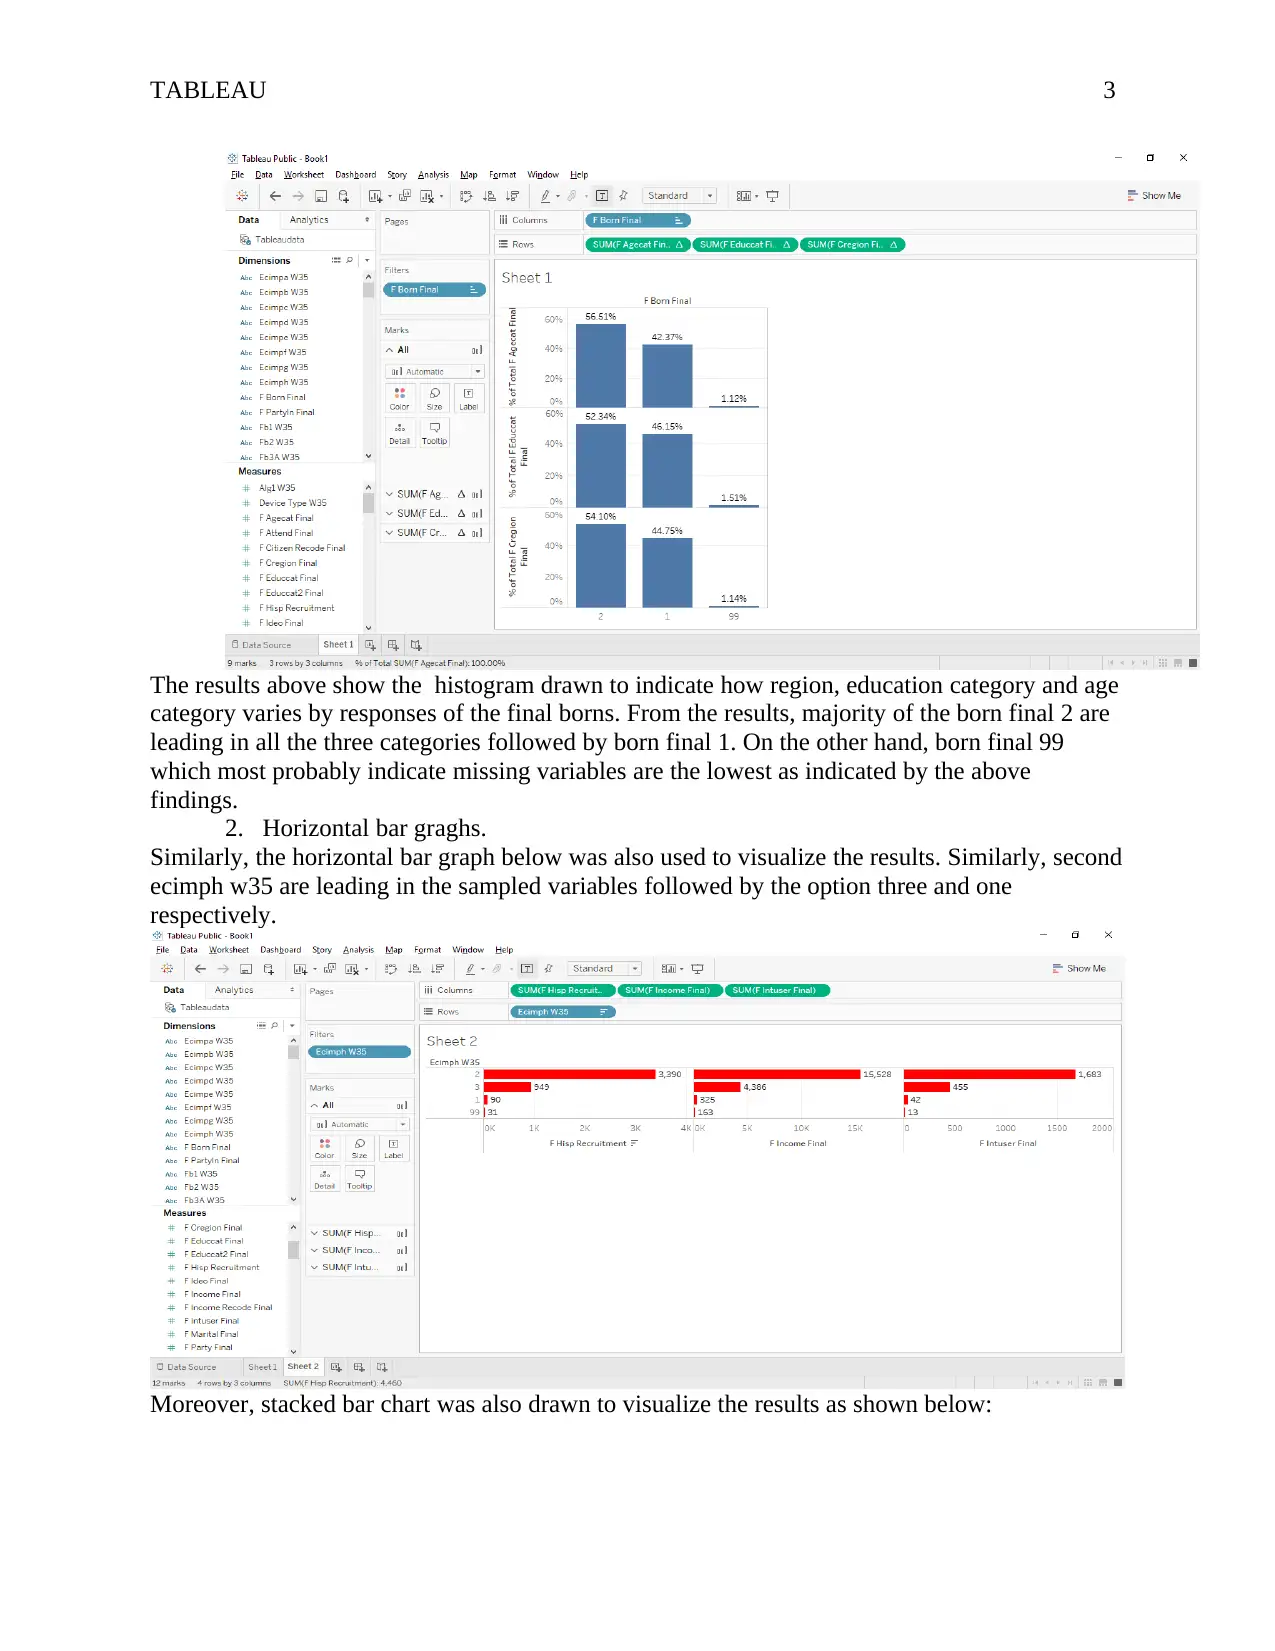
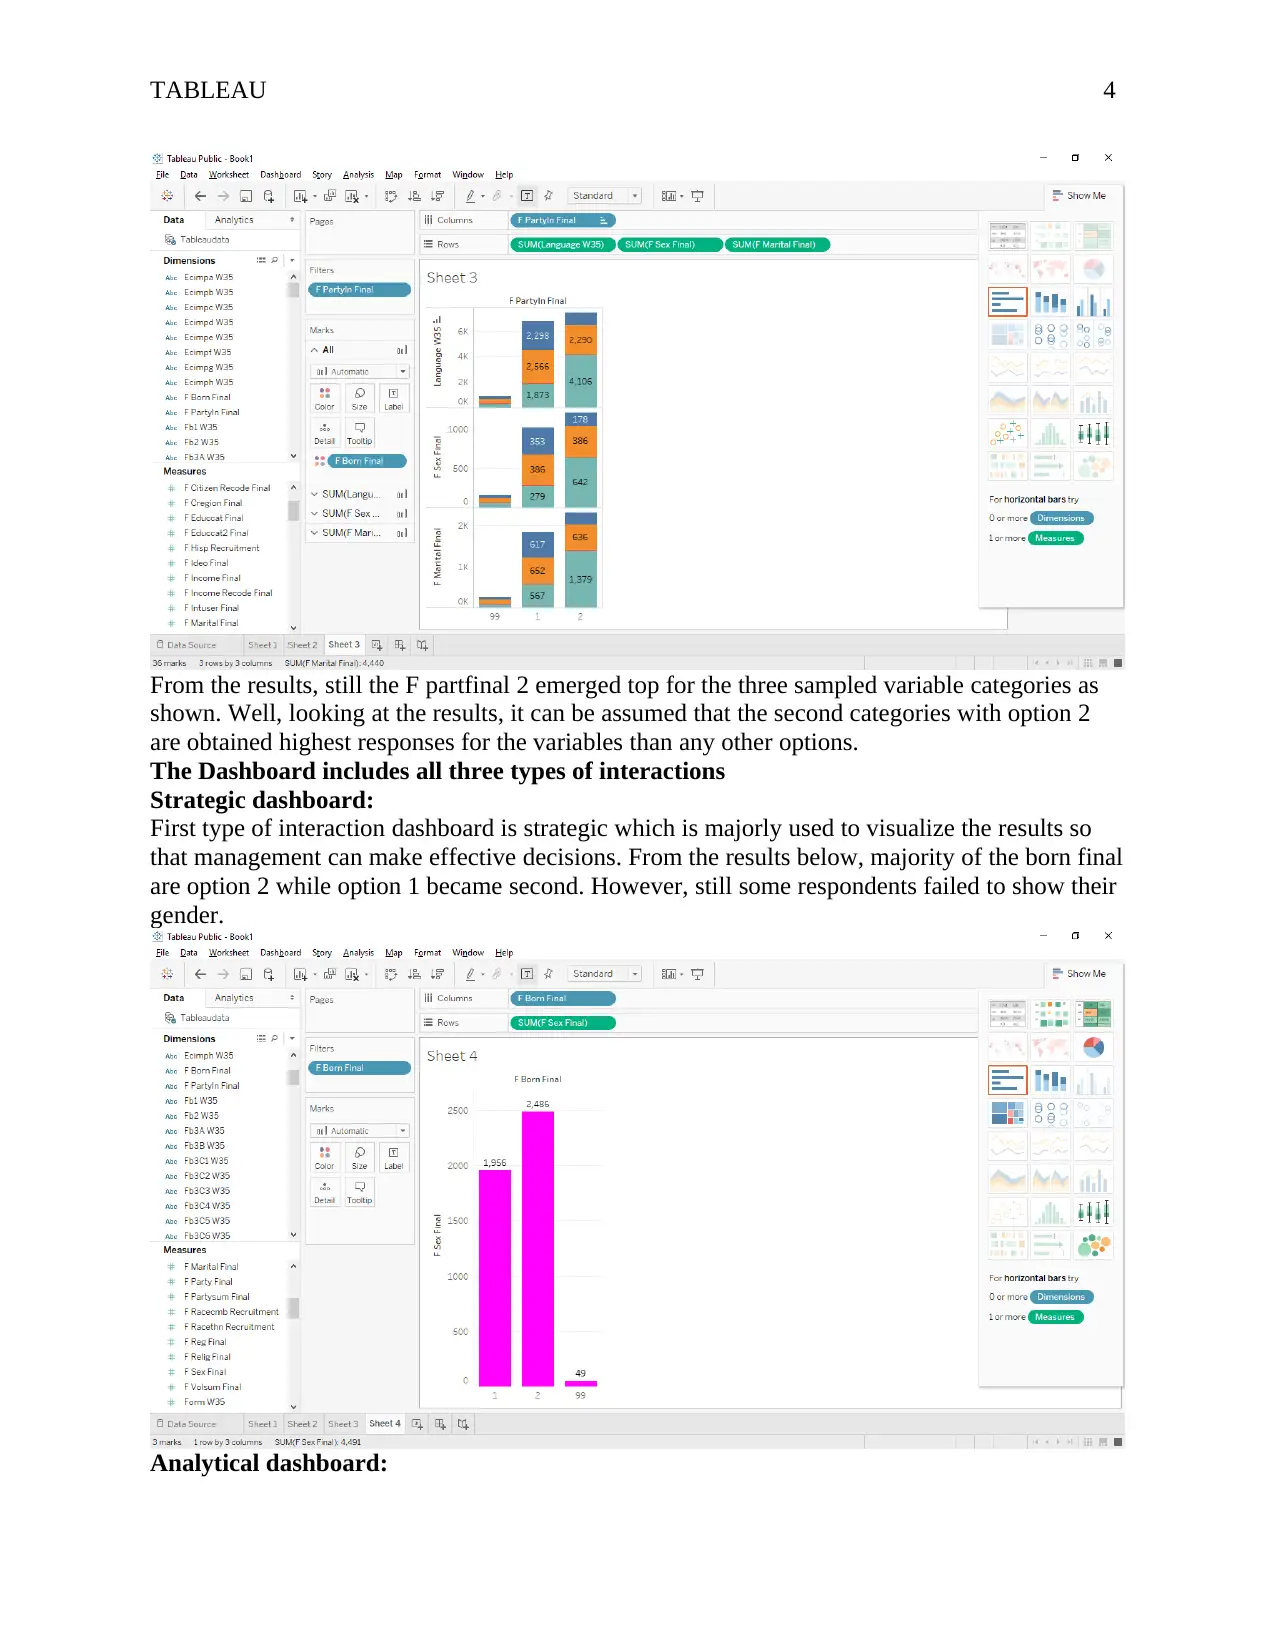
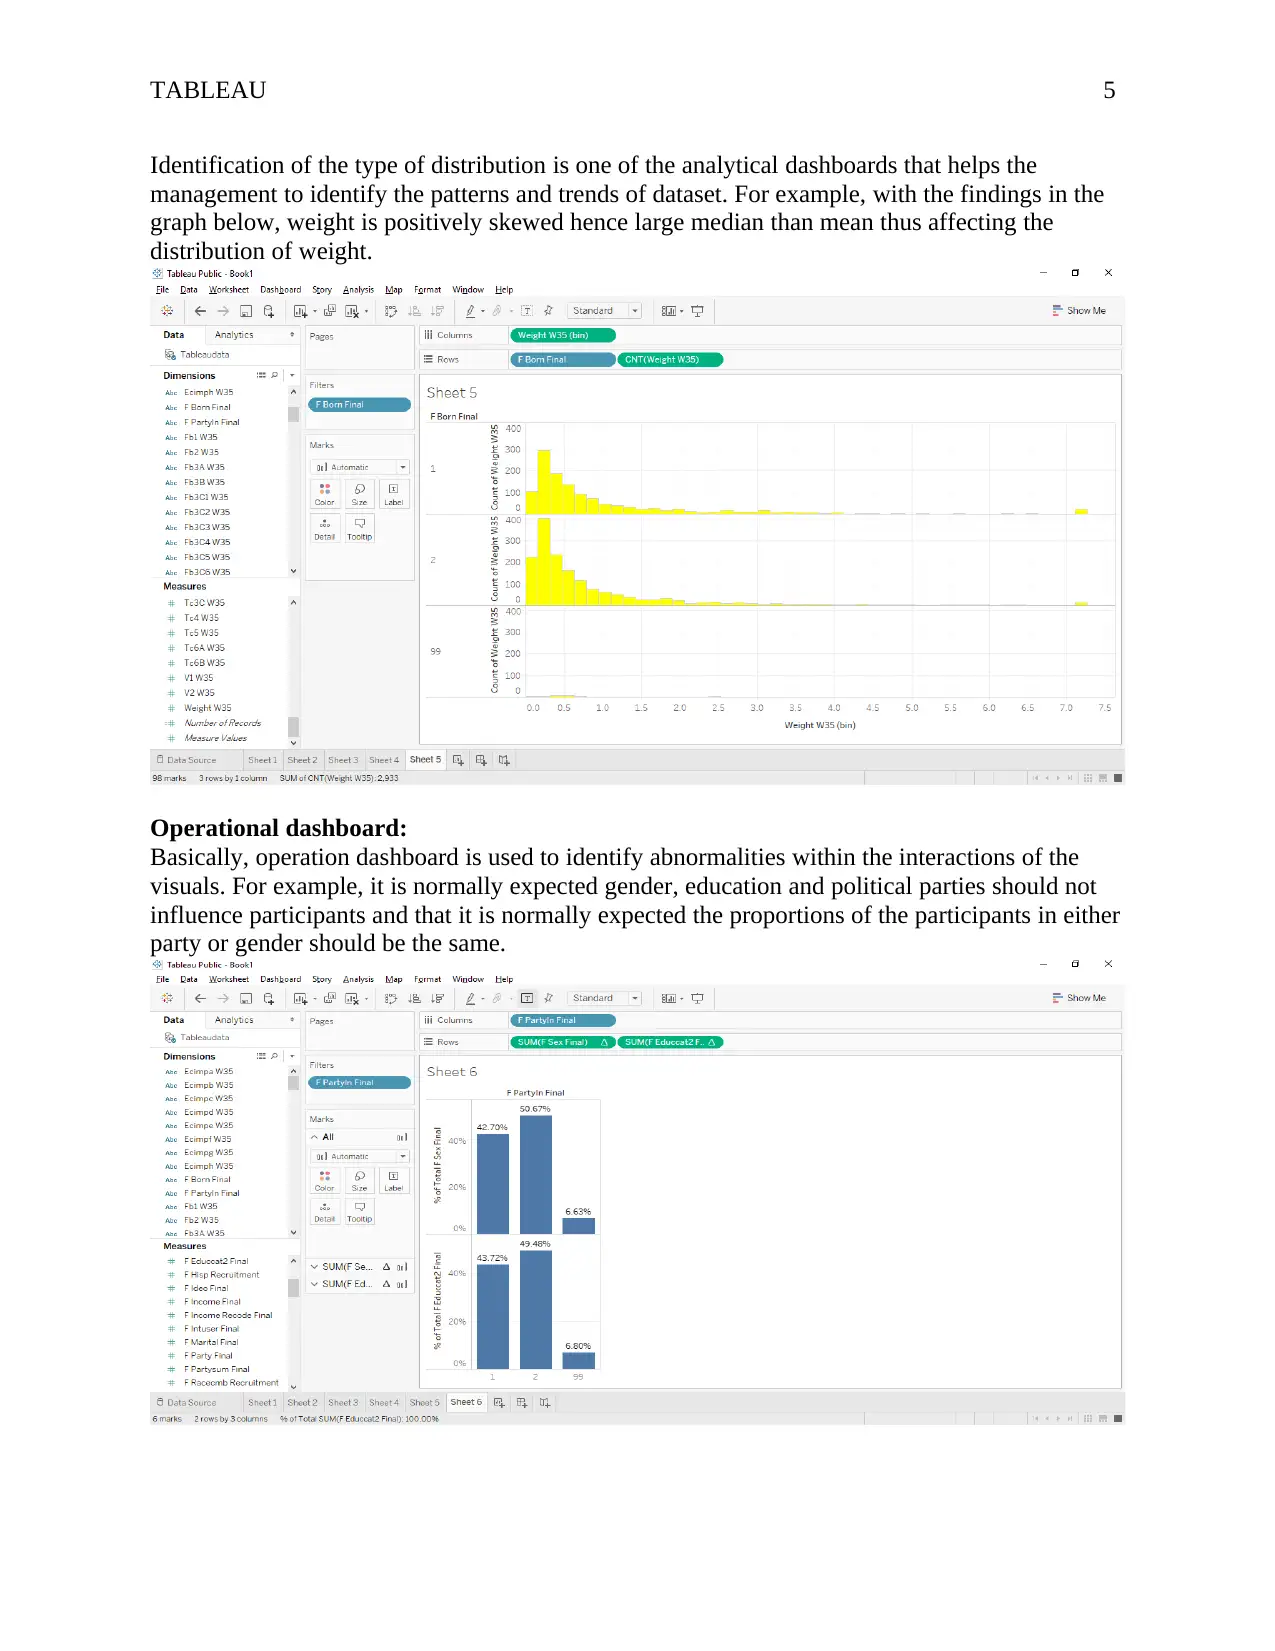
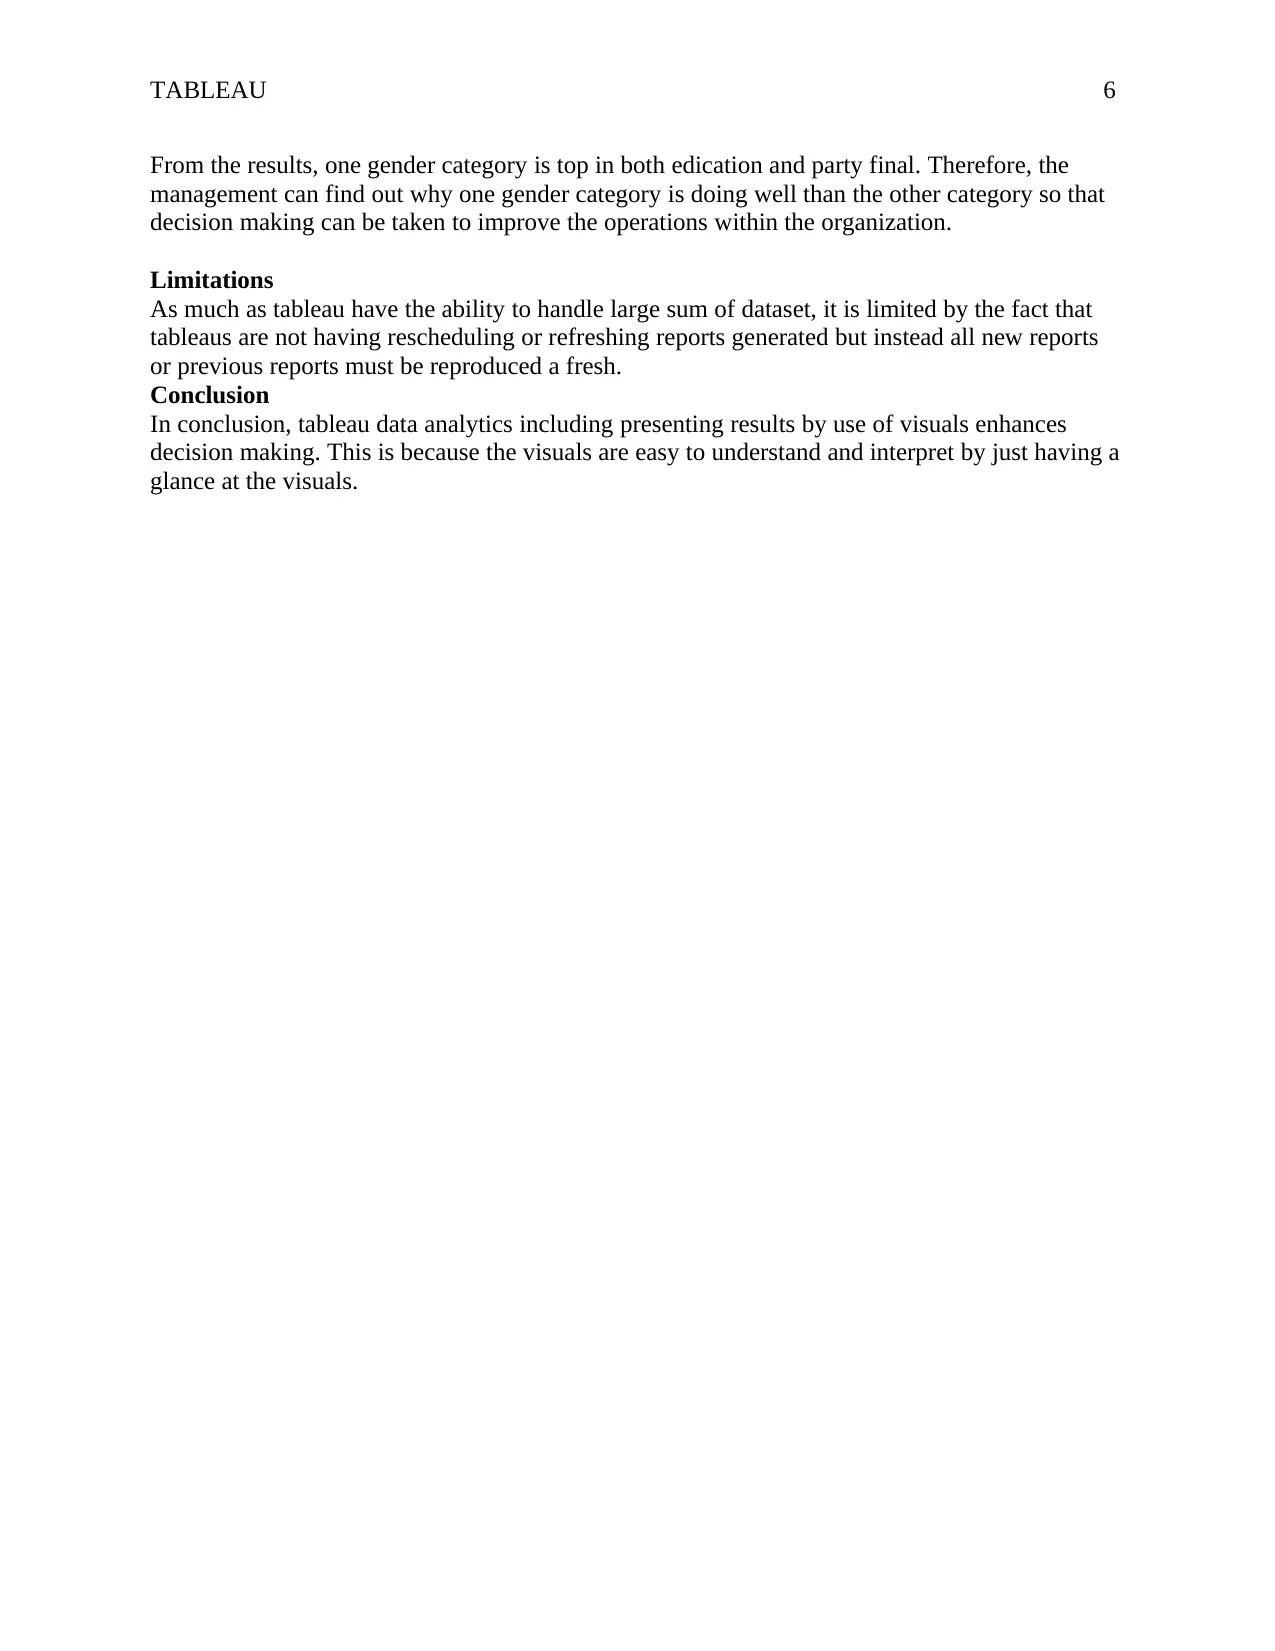
This assignment focuses on using Tableau to analyze and visualize data from the Pew Research Center's American Trends Panel Wave 35 survey. The student utilized Tableau to create interactive dashboards, including histograms, horizontal bar graphs, and stacked bar charts, to explore relationships between various variables such as gender, education, income, and political affiliations. The technical approach involved transferring variables to columns and rows, using both frequency counts and percentages to present the findings. The analysis identified key themes and presented them through strategic, analytical, and operational dashboards to facilitate decision-making. The assignment also acknowledged the limitations of Tableau regarding report refreshing and concluded that Tableau enhances decision-making through easily interpretable visuals. The dataset was quantitative, with null observations filtered. The dashboards showcase the distribution of data, identify trends, and uncover potential abnormalities within the dataset, aiding in effective data interpretation.
1 out of 7


Your All-in-One AI-Powered Toolkit for Academic Success.
+13062052269
info@desklib.com
Available 24*7 on WhatsApp / Email
![[object Object]](/_next/static/media/star-bottom.7253800d.svg)
Copyright © 2020–2026 A2Z Services. All Rights Reserved. Developed and managed by ZUCOL.