Business Decision Making: Detailed Analysis of Amistar Sales & Profit
VerifiedAdded on 2023/04/11
|14
|610
|267
Report
AI Summary
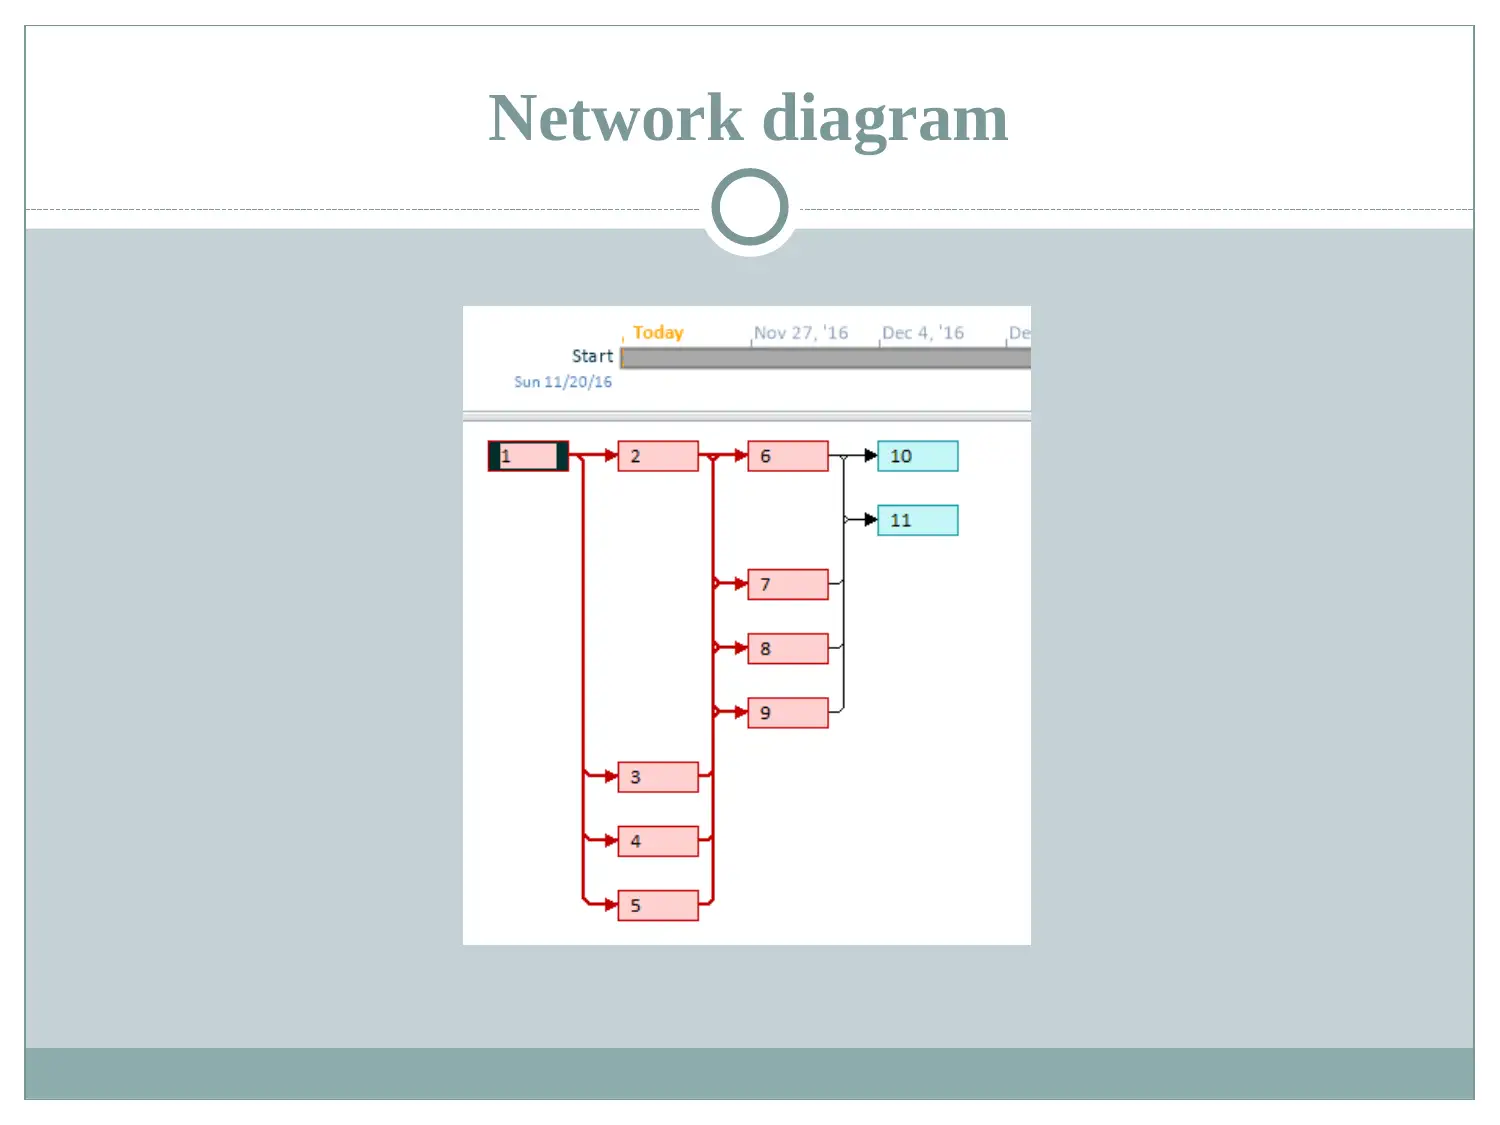
This report provides an analysis of Amistar's sales and profit trends, focusing on the Japanese market and using various analytical tools. The analysis indicates increasing sales and profit in the Japanese market, suggesting it as a lucrative opportunity for investment by Syngenta. The report also discusses the use of trend analysis, time series analysis (moving average and decomposition), and GANTT charts to aid in decision-making and project management. Critical path analysis identifies the sequence of activities essential for project completion within a specific timeframe, and references are provided for further reading on statistics, data analytics, geovisual analytics, and predictive analytics.


1 out of 14
Related Documents


Your All-in-One AI-Powered Toolkit for Academic Success.
+13062052269
info@desklib.com
Available 24*7 on WhatsApp / Email
![[object Object]](/_next/static/media/star-bottom.7253800d.svg)
Copyright © 2020–2026 A2Z Services. All Rights Reserved. Developed and managed by ZUCOL.