Syngenta's Amistar Launch: Data Analysis and Market Survey Report
VerifiedAdded on 2020/02/05
|23
|7013
|61
Report
AI Summary
This report provides a detailed analysis of Syngenta's Amistar launch strategy. It begins with a country selection (the US) and the rationale behind it, followed by data collection methods (primary and secondary research) and survey methodologies, including questionnaire design and sampling techniques. The report then delves into data analysis, covering skewness calculation, central tendency measurements (mean, median), dispersion measurements, and the use of quartiles, percentiles, and correlation coefficients. Furthermore, it includes the creation of graphs (column and bar) to represent sales, cost, and profits in the Japanese market, as well as a sales and profit trend line with a regression equation. The report also covers project management tools like Gantt charts and network diagrams for warehouse construction, along with investment decisions using capital budgeting tools such as Internal Rate of Return (IRR). The report concludes with an evaluation of capital budgeting techniques and provides a comprehensive overview of the decision-making process for launching Amistar.

BUSINESS DECISION
MAKING
MAKING
Paraphrase This Document
Need a fresh take? Get an instant paraphrase of this document with our AI Paraphraser
TABLE OF CONTENTS
INTRODUCTION......................................................................................................................1
TASK 1......................................................................................................................................1
Q.1. Select country for Launching Amistar, data collection, survey methodology and
sampling technique...........................................................................................................1
Q.2. Designing a questionnaire for market survey...........................................................3
M1..............................................................................................................................................5
Skewness calculation and use in decision-making process..............................................5
TASK 2......................................................................................................................................5
Q.1. Measurement of central tendency.............................................................................5
Q. 2. Dispersion measurement..........................................................................................7
Q.3. Use of quartile, percentile and correlation coefficient..............................................9
TASK 3....................................................................................................................................11
Q. 1. Producing column and bar graph showing sales, cost and profits in Japanese market
.........................................................................................................................................11
Q.2. Presenting sales and profit trend line along with regression equation....................13
Q.3. PowerPoint presentation.........................................................................................14
D1.............................................................................................................................................14
Time series analysis........................................................................................................14
TASK 4....................................................................................................................................15
Q. 1. Constructing Gantt chart and its benefits for project management tool................15
Q. 2. Preparing the network diagram for warehouse construction project.....................17
Q. 3. Investment decisions through using various capital budgeting tools.....................17
D3.............................................................................................................................................19
(1) Internal rate of return.................................................................................................19
(2) Critical evaluation of capital budgeting techniques..................................................20
CONCLUSION........................................................................................................................20
REFERENCES.........................................................................................................................21
INTRODUCTION
Each and every entrepreneur has to make various decisions at different point of time.
Decisions can be defined as a process of analysis between two or more available alternatives
to select the best course of action. In context to business, it is a continuous and indispensable
component because every firm has to take number of decisions to sustain organizational
functioning. Mangers are responsible to take better quality of decisions and ensure business
growth in future period. Management use their technical and managerial skills in decision
making process of business. Initially, they determine the problems, collect information and
make in-depth analysis of it so as to take strategic decisions. It helps to improve strategic
capabilities and compete effectively in the highly competitive market place.
According to the present case study, Syngenta is a global leading corporation which
has more than 28000 employees. It serves large number of people through operating in 90
countries in all over the world. It was established with the purpose of “Bringing plant
potential to life”. Amistar has its broad spectrum fungicide products which are accomplishing
company's target through establishing effective integrated pest management. The present
project will explain various techniques of data collection, processing as well as storage and
significance of tools to create useful information from gathered data. It makes Syngenta able
to take qualified business decisions and enjoy success.
TASK 1
Q.1. Select country for Launching Amistar, data collection, survey methodology and
sampling technique
Amistar launching: As per the given scenario, line manager of company is currently
planning to launch Amistar in new market. US country will be the best suited for this
expansion programme. The reason behind this is that in the United States, agriculture is one
of the major industries and a large exporter of various food items. Large proportion of US
population is engaged in agricultural activities, especially concentrated in Great Plains. US is
a major country for seed improvement, hybridization and expanded use of crops for the
development of bioplastic and bio-fuels. Wheat, Corn, Soybeans, Tobacco, Hay, Alfalfa,
Cotton, Sorghum, Barley and Rice are its major crops. Moreover, it produces variety of
products such as Tomatoes, Potatoes, Cotton lint, Grapes, Oranges, Apples, Rice, Cotton
seed, Sugar beets, Sorghum and others. US gains first position in corn production.
Henceforth, the demand for fungicide products is very high. Therefore, it is clear that by
launching Amistar in the US, Syngenta Company can possess high growth in revenues. This
1 | P a g e
⊘ This is a preview!⊘
Do you want full access?
Subscribe today to unlock all pages.
Trusted by 1+ million students worldwide
in turn, firm will be able to make high growth in market share through satisfying the
producer's requirement. Thus, it has become clear that United States will be an appropriate
country for Syngenta's expansion program.
Data gathering: For supporting this launching decision, line manager will require
numerous information about US market. There are two types of sources for collecting
information that are refereed as primary and secondary data. Description for the same has
been described hereunder: Primary research: Primary data refers to the information that has been collected by
researcher for the first time. It is a type of new research which carries out to acquire
some specific kind of information (Ohgaki, Burger and Kleihues, 2014).
Questionnaire, interview and survey methodology are the type of primary research
techniques. The benefit of these resources is that they help to mitigate investigator’s
specific information need. However, the weakness of such research techniques is that
these consume lot of time and need lot of money for the purpose of collecting
information. Syngenta’s line manager can use such techniques to determine available
market opportunities in the US. By using these, they can determine market demand,
customer choices, their requirements, purchasing decisions and their buying
behaviour.
Secondary research: This type of information is already available in the market. Thus,
researcher does not need to conduct any surveys and getting information from the
respondents. Books, magazines, trade reports, newspapers, scholarly articles,
literature review, published economic reports, published government reports and
agricultural board reports are the techniques of secondary information collection.
Moreover, in the present technological age, internet is the best source of collecting
secondary information (Lyratzopoulos and et.al., 2013). Amistar’s manager can
generate secondary information through using web facilities, report published by
National Agricultural Statistics Services (NASS), Economic Research Services (ERS)
and Foreign Agricultural services (FAS) etc. Moreover, they can make analysis of
current food production through getting historical data of US agricultural industry.
They can estimate potential customer demand for pesticide products through using
this technique. The benefit of this technique is that it utilizes less time and requires
less money. However, its drawback is that it does not provide specific kind of
information which investigator requires for effective decision making process.
2 | P a g e
Paraphrase This Document
Need a fresh take? Get an instant paraphrase of this document with our AI Paraphraser
Survey methodology: Line manager can conduct market surveys to gather required
quantity of data. Questionnaire is an effective way for this purpose. He or she can collect
wide range of information through constructing different open-ended, close-ended and
dichotomous questions (Fowler Jr., 2013). Further, he or she can also acquire information
about product’s preferences, price, place, promotion and customer’s buying habits. Along
with this, it assists manager to acquire information from a wider geographical place. It is
because web questionnaire can be designed and sent to the respondents through using web
facilities. It takes very less time to fill up and satisfy researcher’s information need.
Sampling frame: It is the method which facilitates investigator to acquire
information about the universe through selecting an adequate size of sample (Allison and
et.al., 2016). It is also an effective tool for data gathering because it is not possible for the line
manager to study overall US population. Henceforth, sampling frame can be used in which
researcher has to choose an appropriate sample of customers who make extensive use of
fungicide products. This sample must include all the characteristics of universe otherwise
harmful decisions may be taken. Sampling frame can be constructed by using probabilistic or
non-probabilistic sampling (Levy and Lemeshow, 2013). Under the probabilistic sampling,
each customer has an equal chance of inclusion in sample. While, it is not so happen with the
non-probabilistic sampling. Probabilistic sampling method will be used for the present case
study in which Line manager has been taken a sample of 35 customers who are engaged in
agricultural activities and use various pesticide products offered by Syngenta for crop
protection.
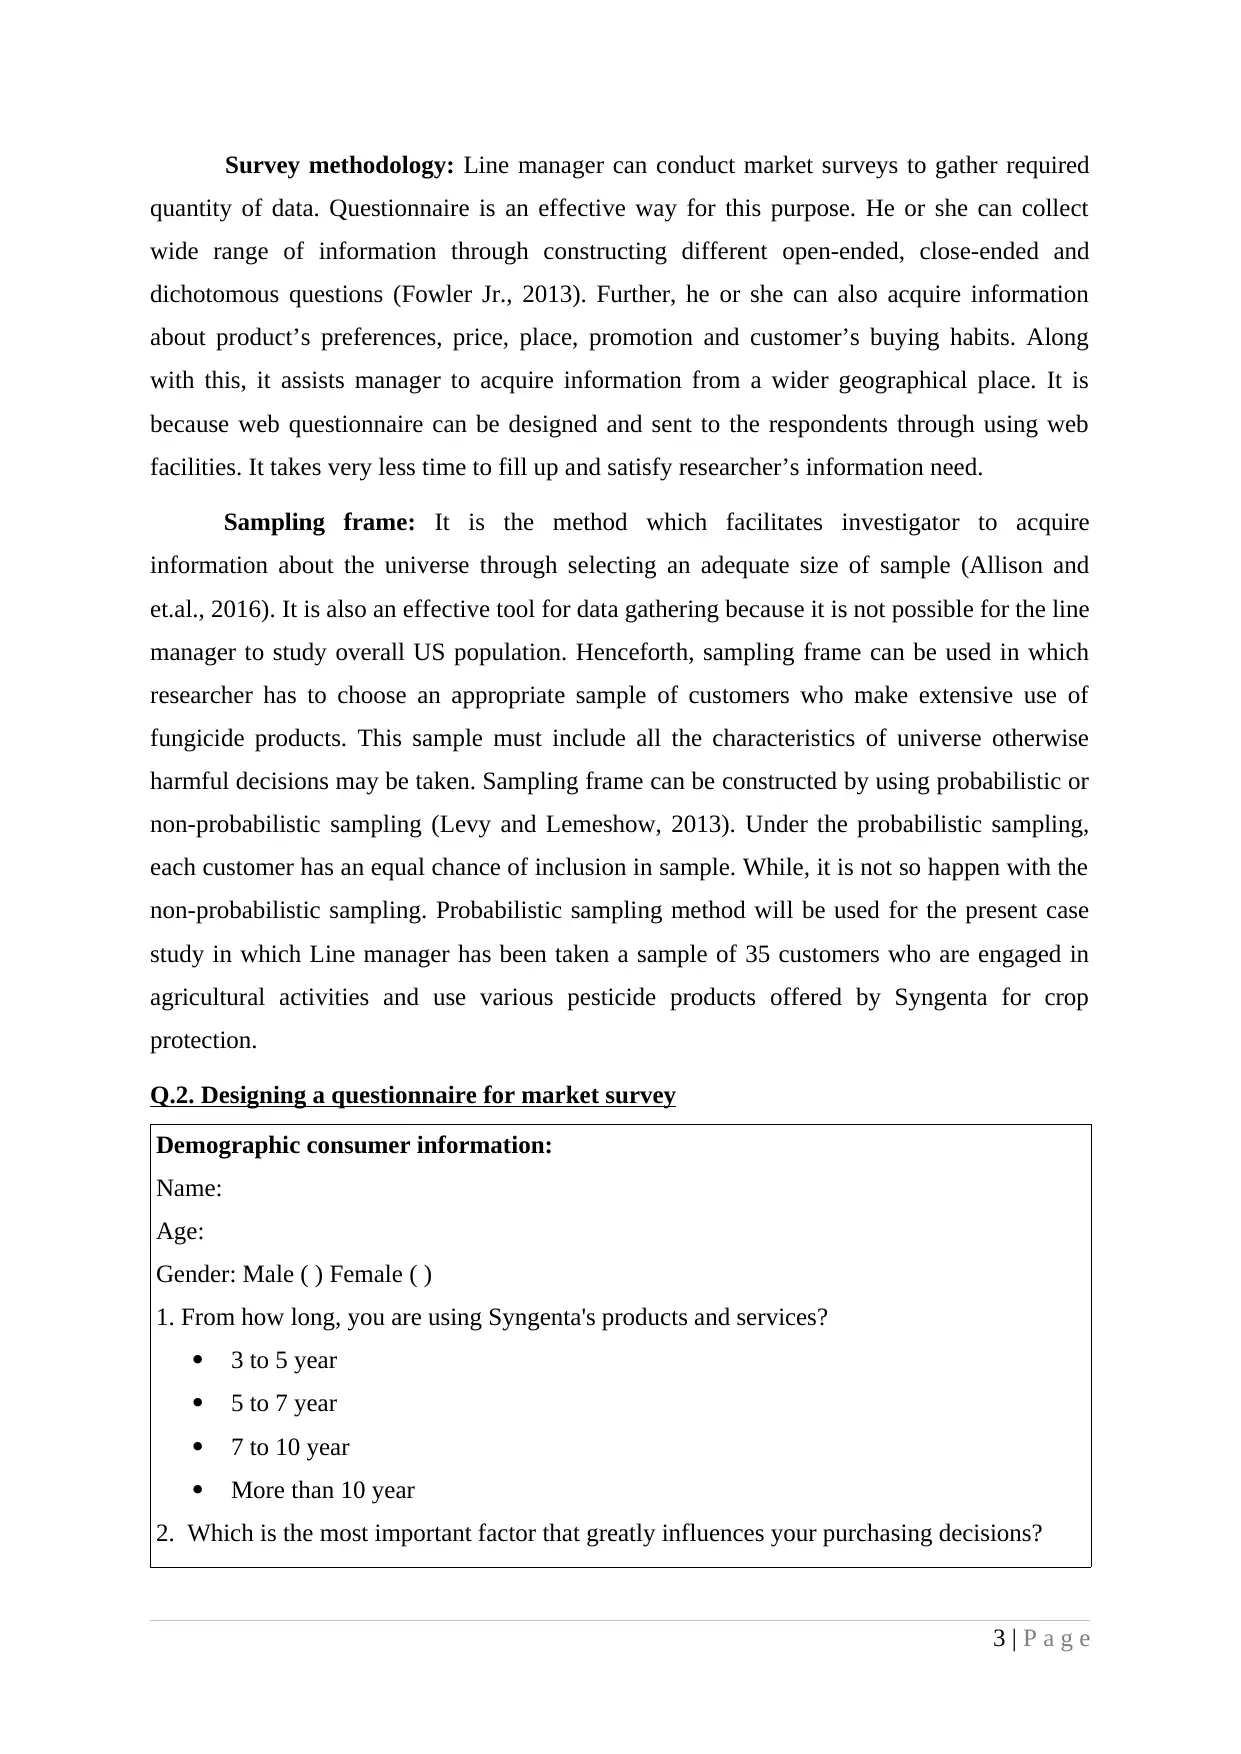
Q.2. Designing a questionnaire for market survey
Demographic consumer information:
Name:
Age:
Gender: Male ( ) Female ( )
1. From how long, you are using Syngenta's products and services?
3 to 5 year
5 to 7 year
7 to 10 year
More than 10 year
2. Which is the most important factor that greatly influences your purchasing decisions?
3 | P a g e
quantity of data. Questionnaire is an effective way for this purpose. He or she can collect
wide range of information through constructing different open-ended, close-ended and
dichotomous questions (Fowler Jr., 2013). Further, he or she can also acquire information
about product’s preferences, price, place, promotion and customer’s buying habits. Along
with this, it assists manager to acquire information from a wider geographical place. It is
because web questionnaire can be designed and sent to the respondents through using web
facilities. It takes very less time to fill up and satisfy researcher’s information need.
Sampling frame: It is the method which facilitates investigator to acquire
information about the universe through selecting an adequate size of sample (Allison and
et.al., 2016). It is also an effective tool for data gathering because it is not possible for the line
manager to study overall US population. Henceforth, sampling frame can be used in which
researcher has to choose an appropriate sample of customers who make extensive use of
fungicide products. This sample must include all the characteristics of universe otherwise
harmful decisions may be taken. Sampling frame can be constructed by using probabilistic or
non-probabilistic sampling (Levy and Lemeshow, 2013). Under the probabilistic sampling,
each customer has an equal chance of inclusion in sample. While, it is not so happen with the
non-probabilistic sampling. Probabilistic sampling method will be used for the present case
study in which Line manager has been taken a sample of 35 customers who are engaged in
agricultural activities and use various pesticide products offered by Syngenta for crop
protection.
Q.2. Designing a questionnaire for market survey
Demographic consumer information:
Name:
Age:
Gender: Male ( ) Female ( )
1. From how long, you are using Syngenta's products and services?
3 to 5 year
5 to 7 year
7 to 10 year
More than 10 year
2. Which is the most important factor that greatly influences your purchasing decisions?
3 | P a g e
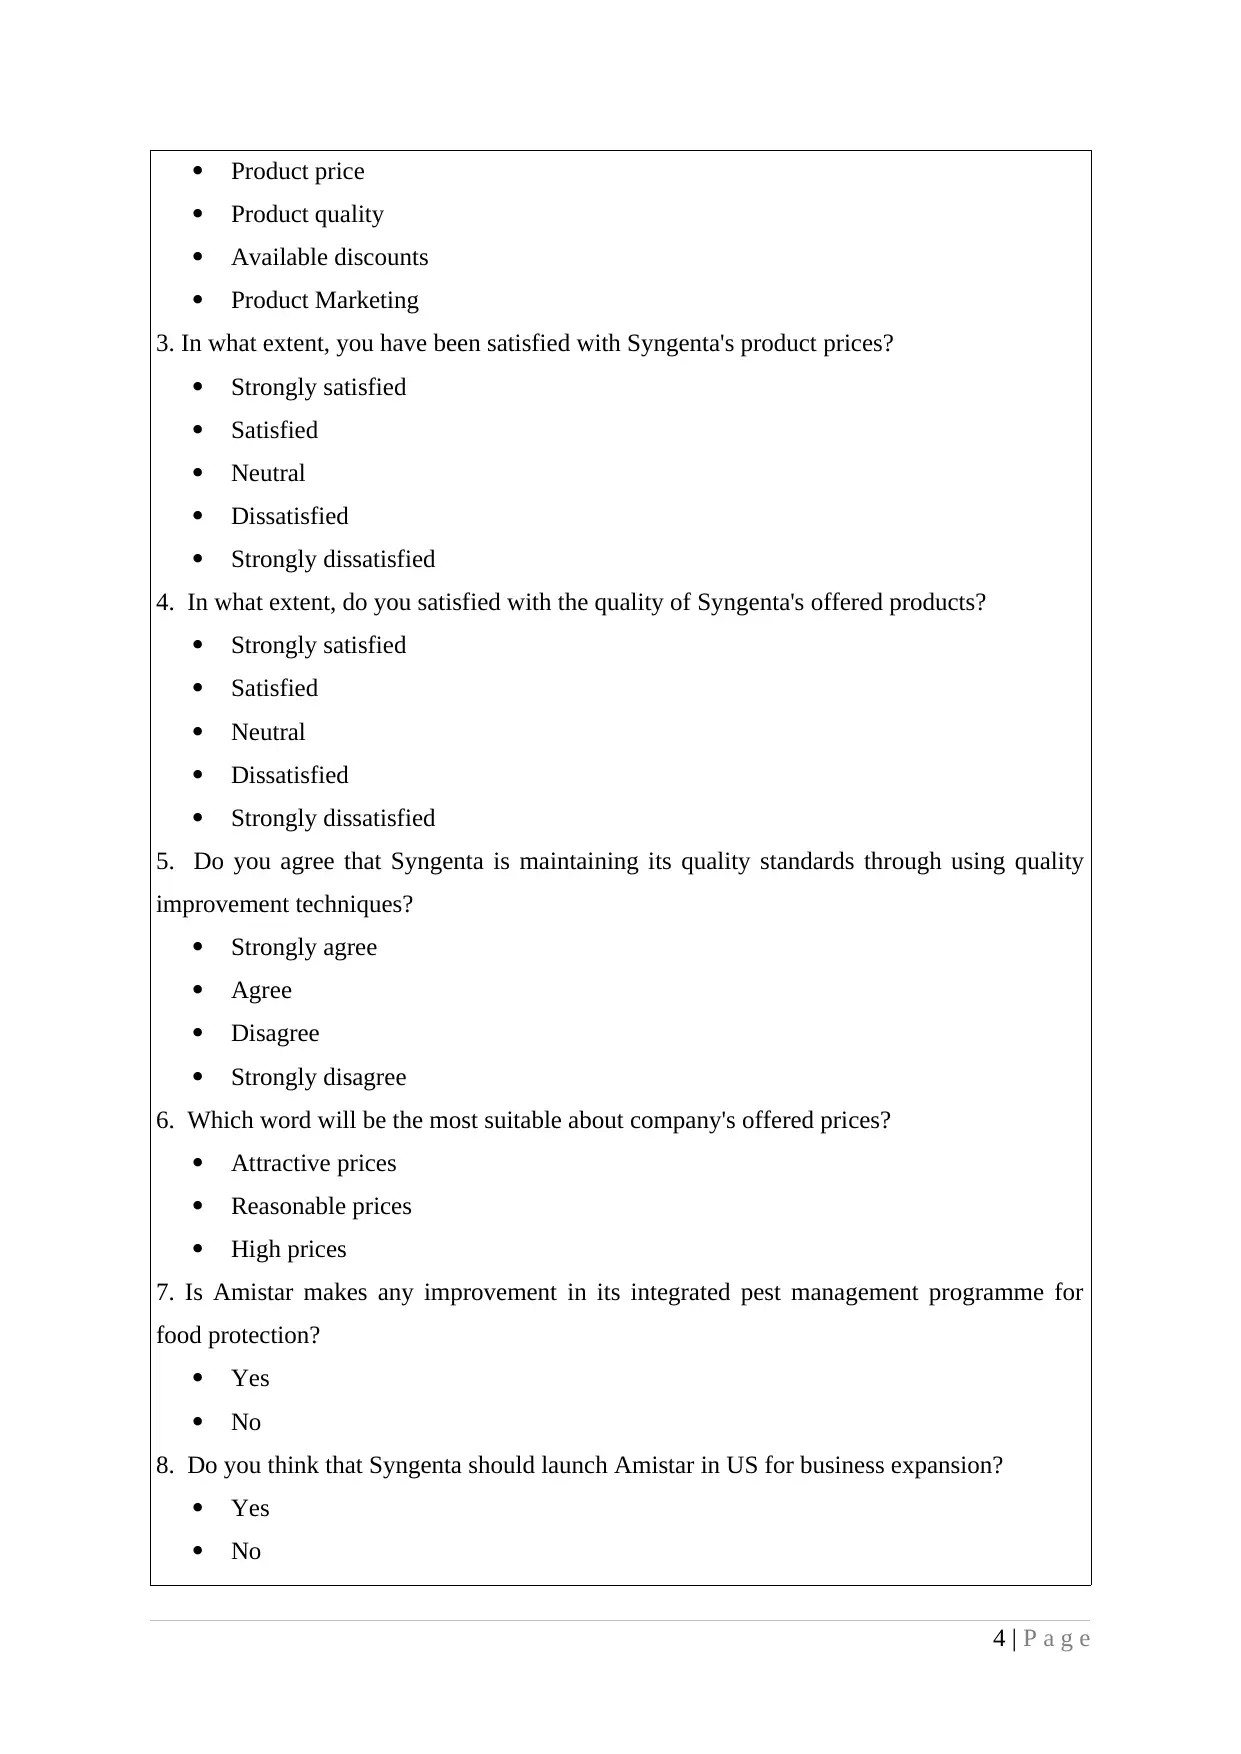
Product price
Product quality
Available discounts
Product Marketing
3. In what extent, you have been satisfied with Syngenta's product prices?
Strongly satisfied
Satisfied
Neutral
Dissatisfied
Strongly dissatisfied
4. In what extent, do you satisfied with the quality of Syngenta's offered products?
Strongly satisfied
Satisfied
Neutral
Dissatisfied
Strongly dissatisfied
5. Do you agree that Syngenta is maintaining its quality standards through using quality
improvement techniques?
Strongly agree
Agree
Disagree
Strongly disagree
6. Which word will be the most suitable about company's offered prices?
Attractive prices
Reasonable prices
High prices
7. Is Amistar makes any improvement in its integrated pest management programme for
food protection?
Yes
No
8. Do you think that Syngenta should launch Amistar in US for business expansion?
Yes
No
4 | P a g e
⊘ This is a preview!⊘
Do you want full access?
Subscribe today to unlock all pages.
Trusted by 1+ million students worldwide
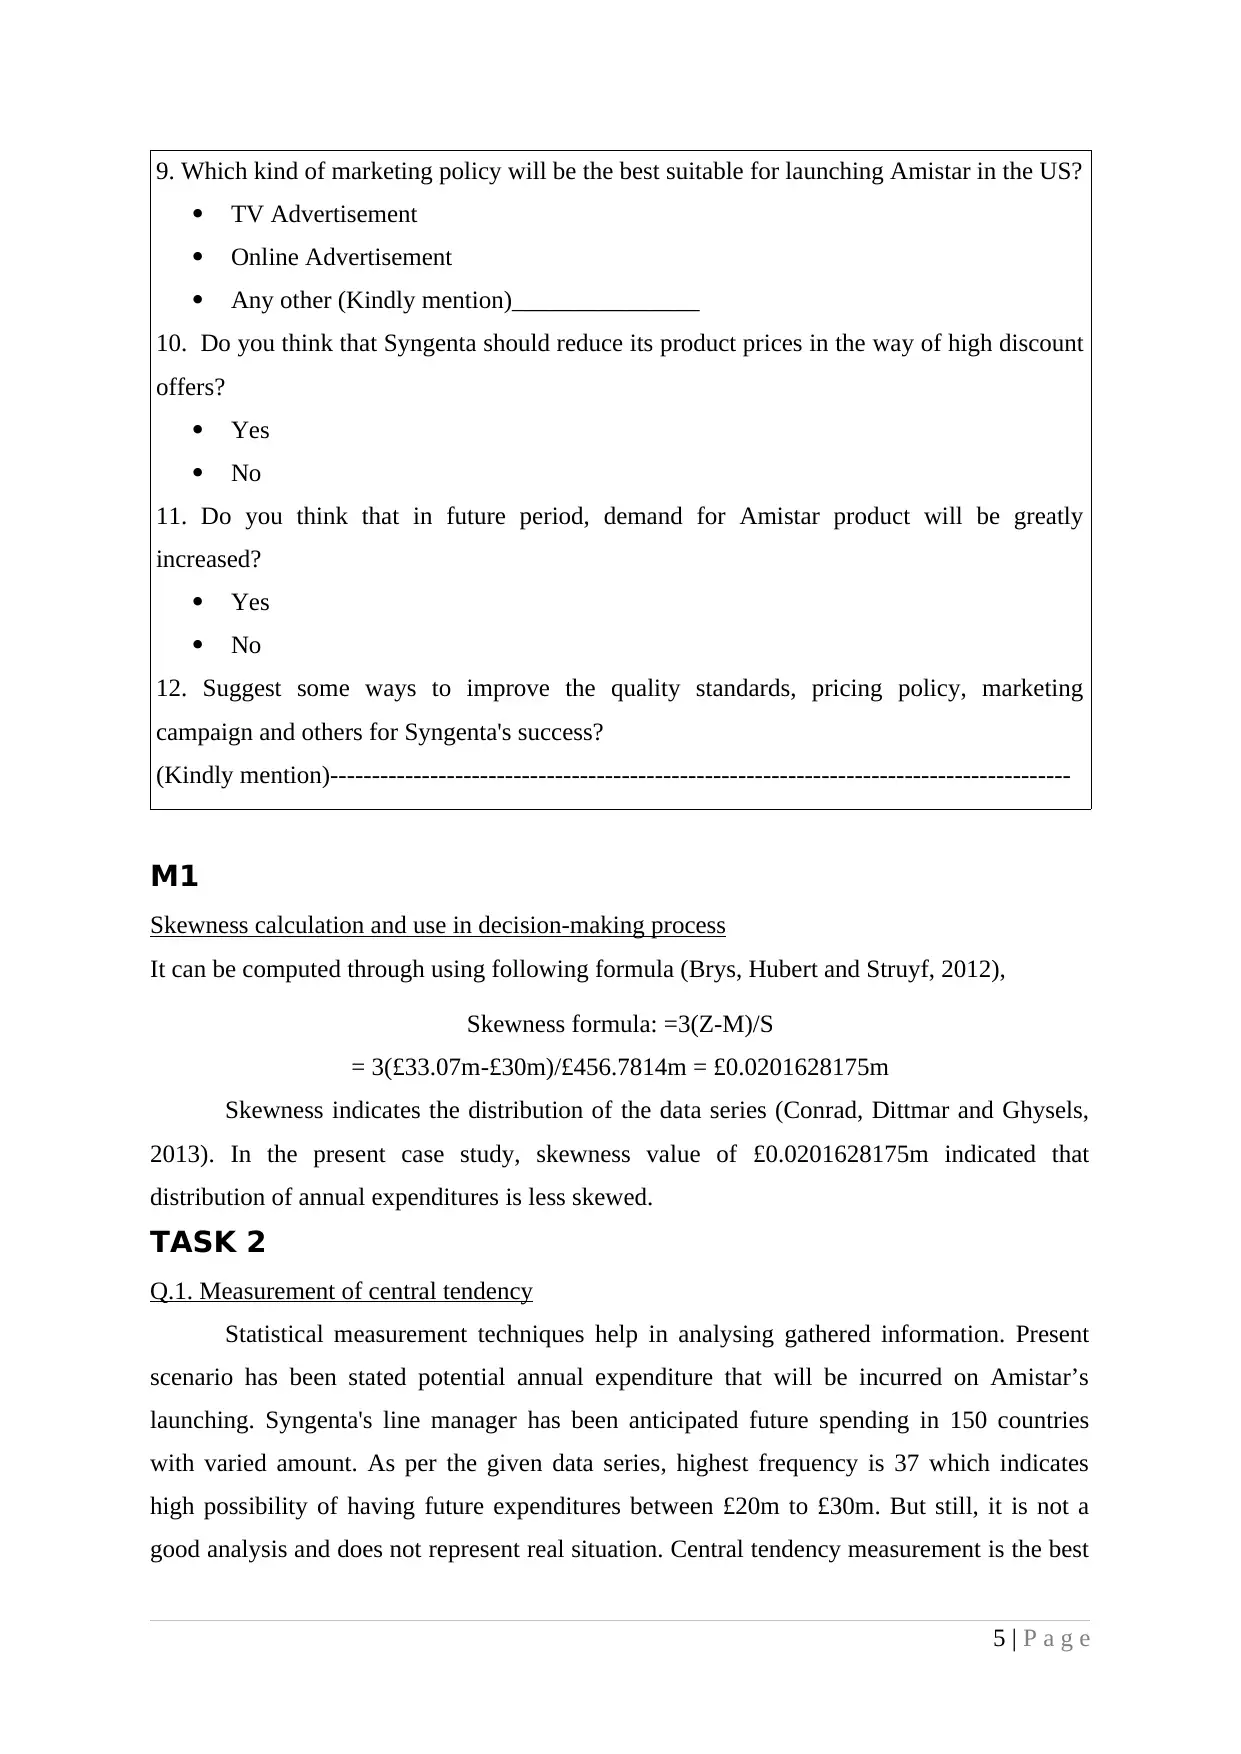
9. Which kind of marketing policy will be the best suitable for launching Amistar in the US?
TV Advertisement
Online Advertisement
Any other (Kindly mention)_______________
10. Do you think that Syngenta should reduce its product prices in the way of high discount
offers?
Yes
No
11. Do you think that in future period, demand for Amistar product will be greatly
increased?
Yes
No
12. Suggest some ways to improve the quality standards, pricing policy, marketing
campaign and others for Syngenta's success?
(Kindly mention)-----------------------------------------------------------------------------------------
M1
Skewness calculation and use in decision-making process
It can be computed through using following formula (Brys, Hubert and Struyf, 2012),
Skewness formula: =3(Z-M)/S
= 3(£33.07m-£30m)/£456.7814m = £0.0201628175m
Skewness indicates the distribution of the data series (Conrad, Dittmar and Ghysels,
2013). In the present case study, skewness value of £0.0201628175m indicated that
distribution of annual expenditures is less skewed.
TASK 2
Q.1. Measurement of central tendency
Statistical measurement techniques help in analysing gathered information. Present
scenario has been stated potential annual expenditure that will be incurred on Amistar’s
launching. Syngenta's line manager has been anticipated future spending in 150 countries
with varied amount. As per the given data series, highest frequency is 37 which indicates
high possibility of having future expenditures between £20m to £30m. But still, it is not a
good analysis and does not represent real situation. Central tendency measurement is the best
5 | P a g e
Paraphrase This Document
Need a fresh take? Get an instant paraphrase of this document with our AI Paraphraser
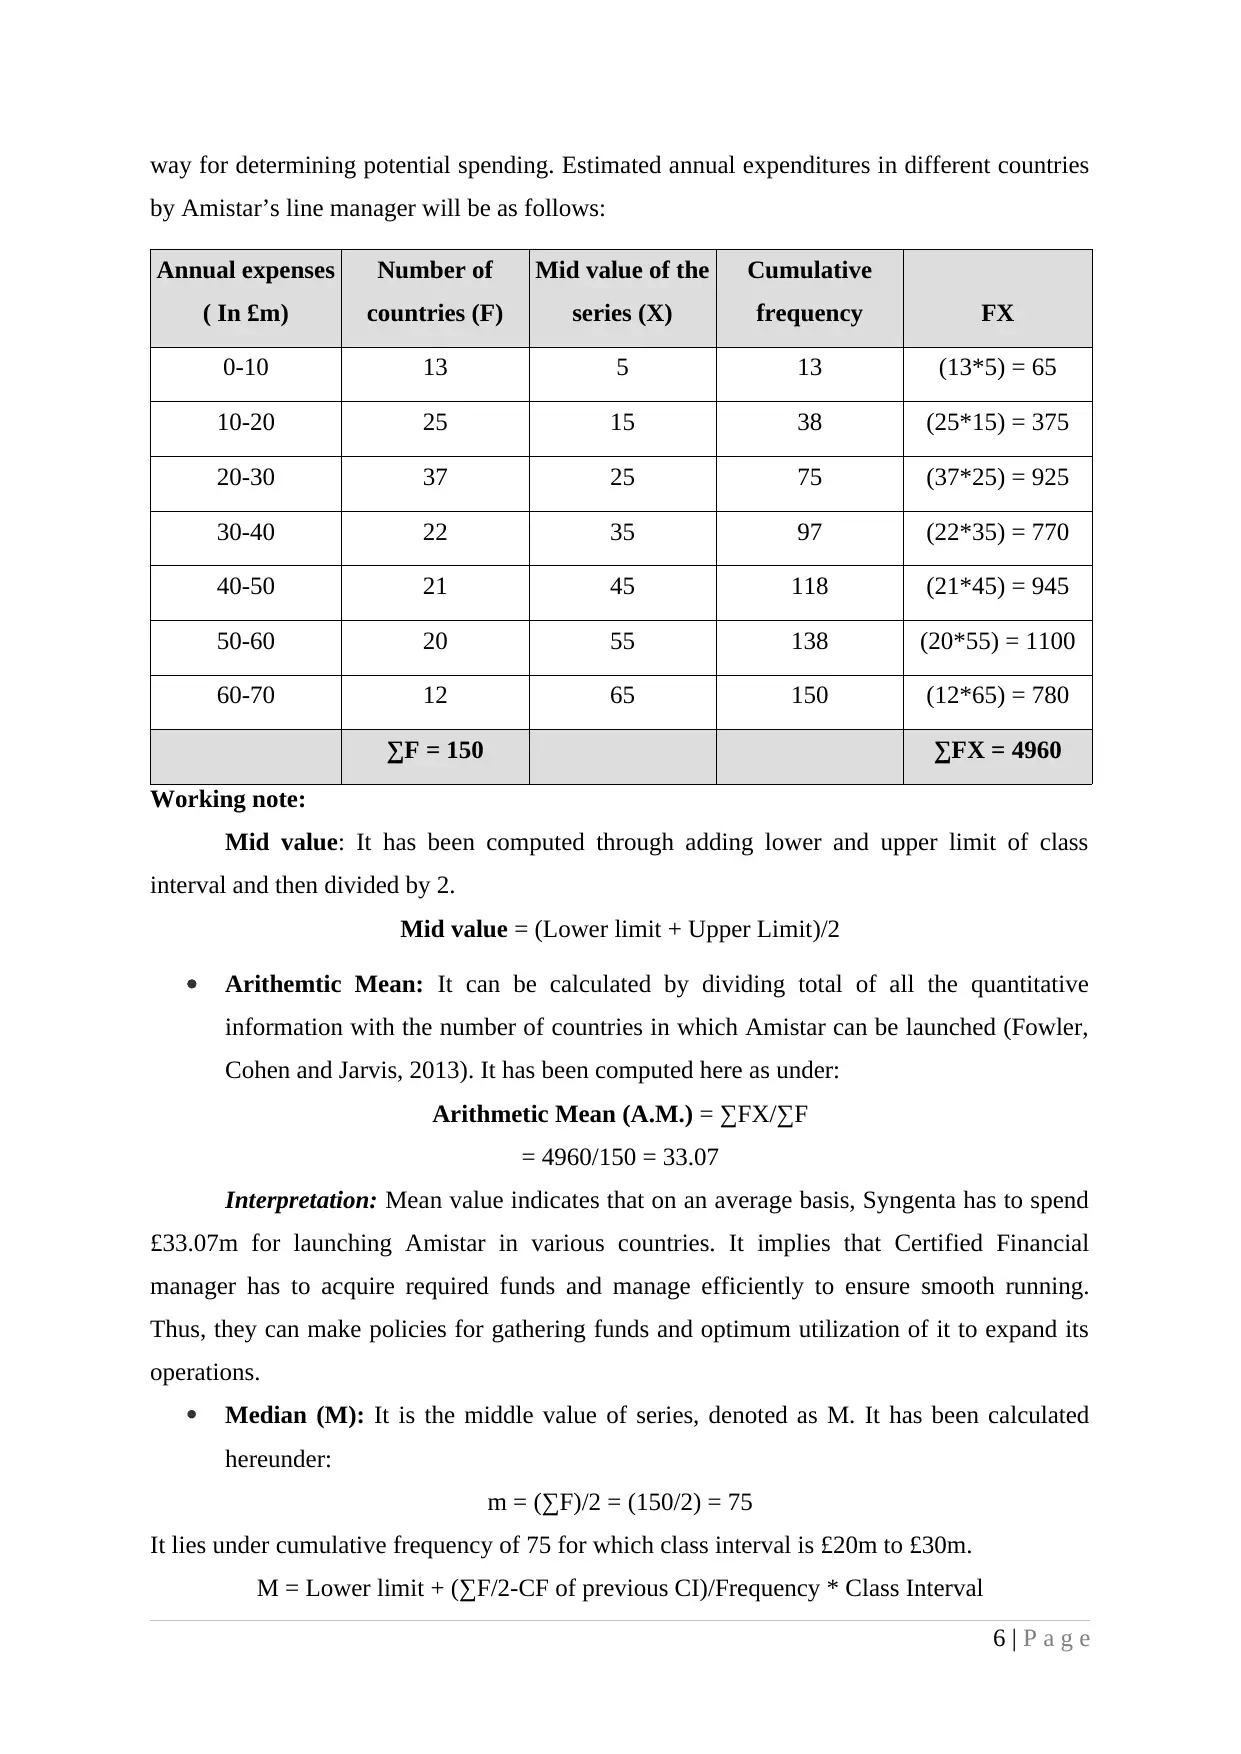
way for determining potential spending. Estimated annual expenditures in different countries
by Amistar’s line manager will be as follows:
Annual expenses
( In £m)
Number of
countries (F)
Mid value of the
series (X)
Cumulative
frequency FX
0-10 13 5 13 (13*5) = 65
10-20 25 15 38 (25*15) = 375
20-30 37 25 75 (37*25) = 925
30-40 22 35 97 (22*35) = 770
40-50 21 45 118 (21*45) = 945
50-60 20 55 138 (20*55) = 1100
60-70 12 65 150 (12*65) = 780
∑F = 150 ∑FX = 4960
Working note:
Mid value: It has been computed through adding lower and upper limit of class
interval and then divided by 2.
Mid value = (Lower limit + Upper Limit)/2
Arithemtic Mean: It can be calculated by dividing total of all the quantitative
information with the number of countries in which Amistar can be launched (Fowler,
Cohen and Jarvis, 2013). It has been computed here as under:
Arithmetic Mean (A.M.) = ∑FX/∑F
= 4960/150 = 33.07
Interpretation: Mean value indicates that on an average basis, Syngenta has to spend
£33.07m for launching Amistar in various countries. It implies that Certified Financial
manager has to acquire required funds and manage efficiently to ensure smooth running.
Thus, they can make policies for gathering funds and optimum utilization of it to expand its
operations.
Median (M): It is the middle value of series, denoted as M. It has been calculated
hereunder:
m = (∑F)/2 = (150/2) = 75
It lies under cumulative frequency of 75 for which class interval is £20m to £30m.
M = Lower limit + (∑F/2-CF of previous CI)/Frequency * Class Interval
6 | P a g e
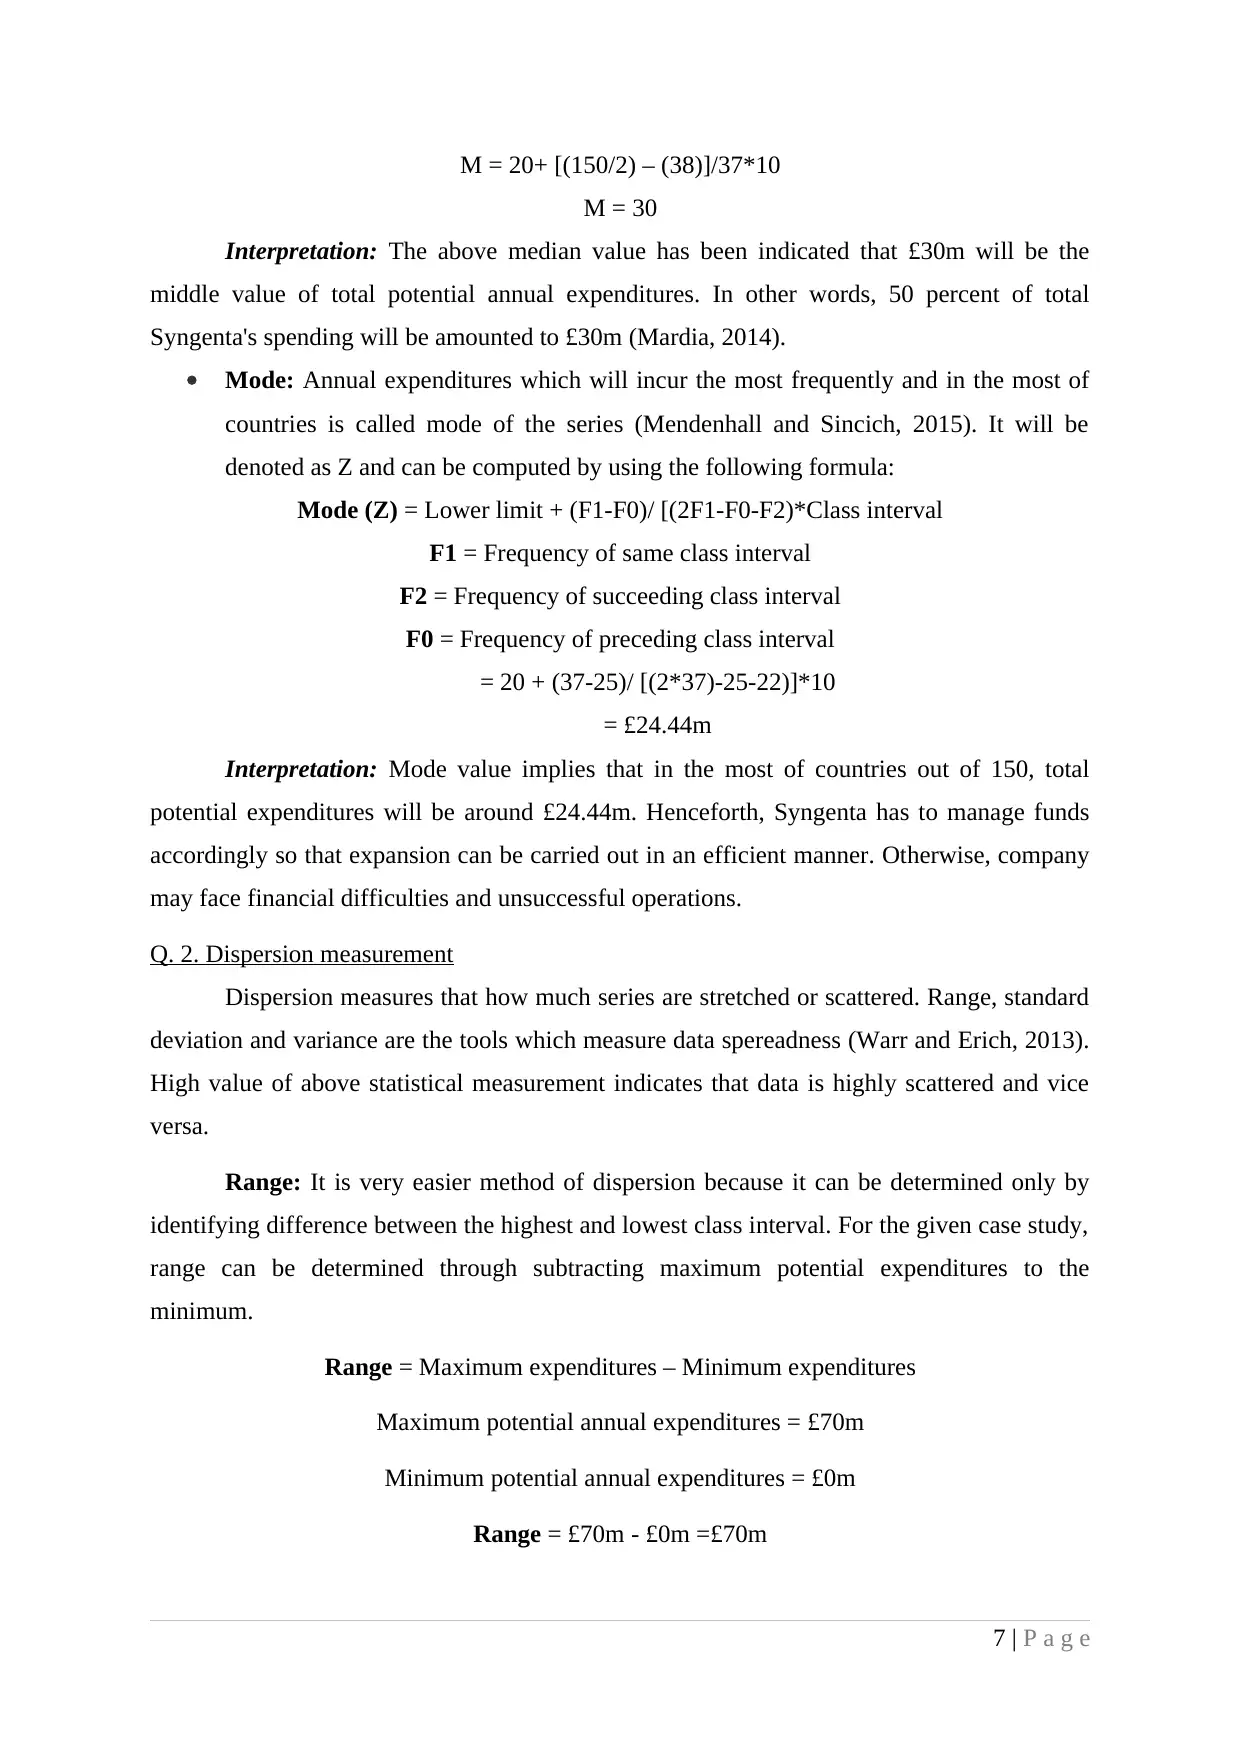
M = 20+ [(150/2) – (38)]/37*10
M = 30
Interpretation: The above median value has been indicated that £30m will be the
middle value of total potential annual expenditures. In other words, 50 percent of total
Syngenta's spending will be amounted to £30m (Mardia, 2014).
Mode: Annual expenditures which will incur the most frequently and in the most of
countries is called mode of the series (Mendenhall and Sincich, 2015). It will be
denoted as Z and can be computed by using the following formula:
Mode (Z) = Lower limit + (F1-F0)/ [(2F1-F0-F2)*Class interval
F1 = Frequency of same class interval
F2 = Frequency of succeeding class interval
F0 = Frequency of preceding class interval
= 20 + (37-25)/ [(2*37)-25-22)]*10
= £24.44m
Interpretation: Mode value implies that in the most of countries out of 150, total
potential expenditures will be around £24.44m. Henceforth, Syngenta has to manage funds
accordingly so that expansion can be carried out in an efficient manner. Otherwise, company
may face financial difficulties and unsuccessful operations.
Q. 2. Dispersion measurement
Dispersion measures that how much series are stretched or scattered. Range, standard
deviation and variance are the tools which measure data spereadness (Warr and Erich, 2013).
High value of above statistical measurement indicates that data is highly scattered and vice
versa.
Range: It is very easier method of dispersion because it can be determined only by
identifying difference between the highest and lowest class interval. For the given case study,
range can be determined through subtracting maximum potential expenditures to the
minimum.
Range = Maximum expenditures – Minimum expenditures
Maximum potential annual expenditures = £70m
Minimum potential annual expenditures = £0m
Range = £70m - £0m =£70m
7 | P a g e
⊘ This is a preview!⊘
Do you want full access?
Subscribe today to unlock all pages.
Trusted by 1+ million students worldwide
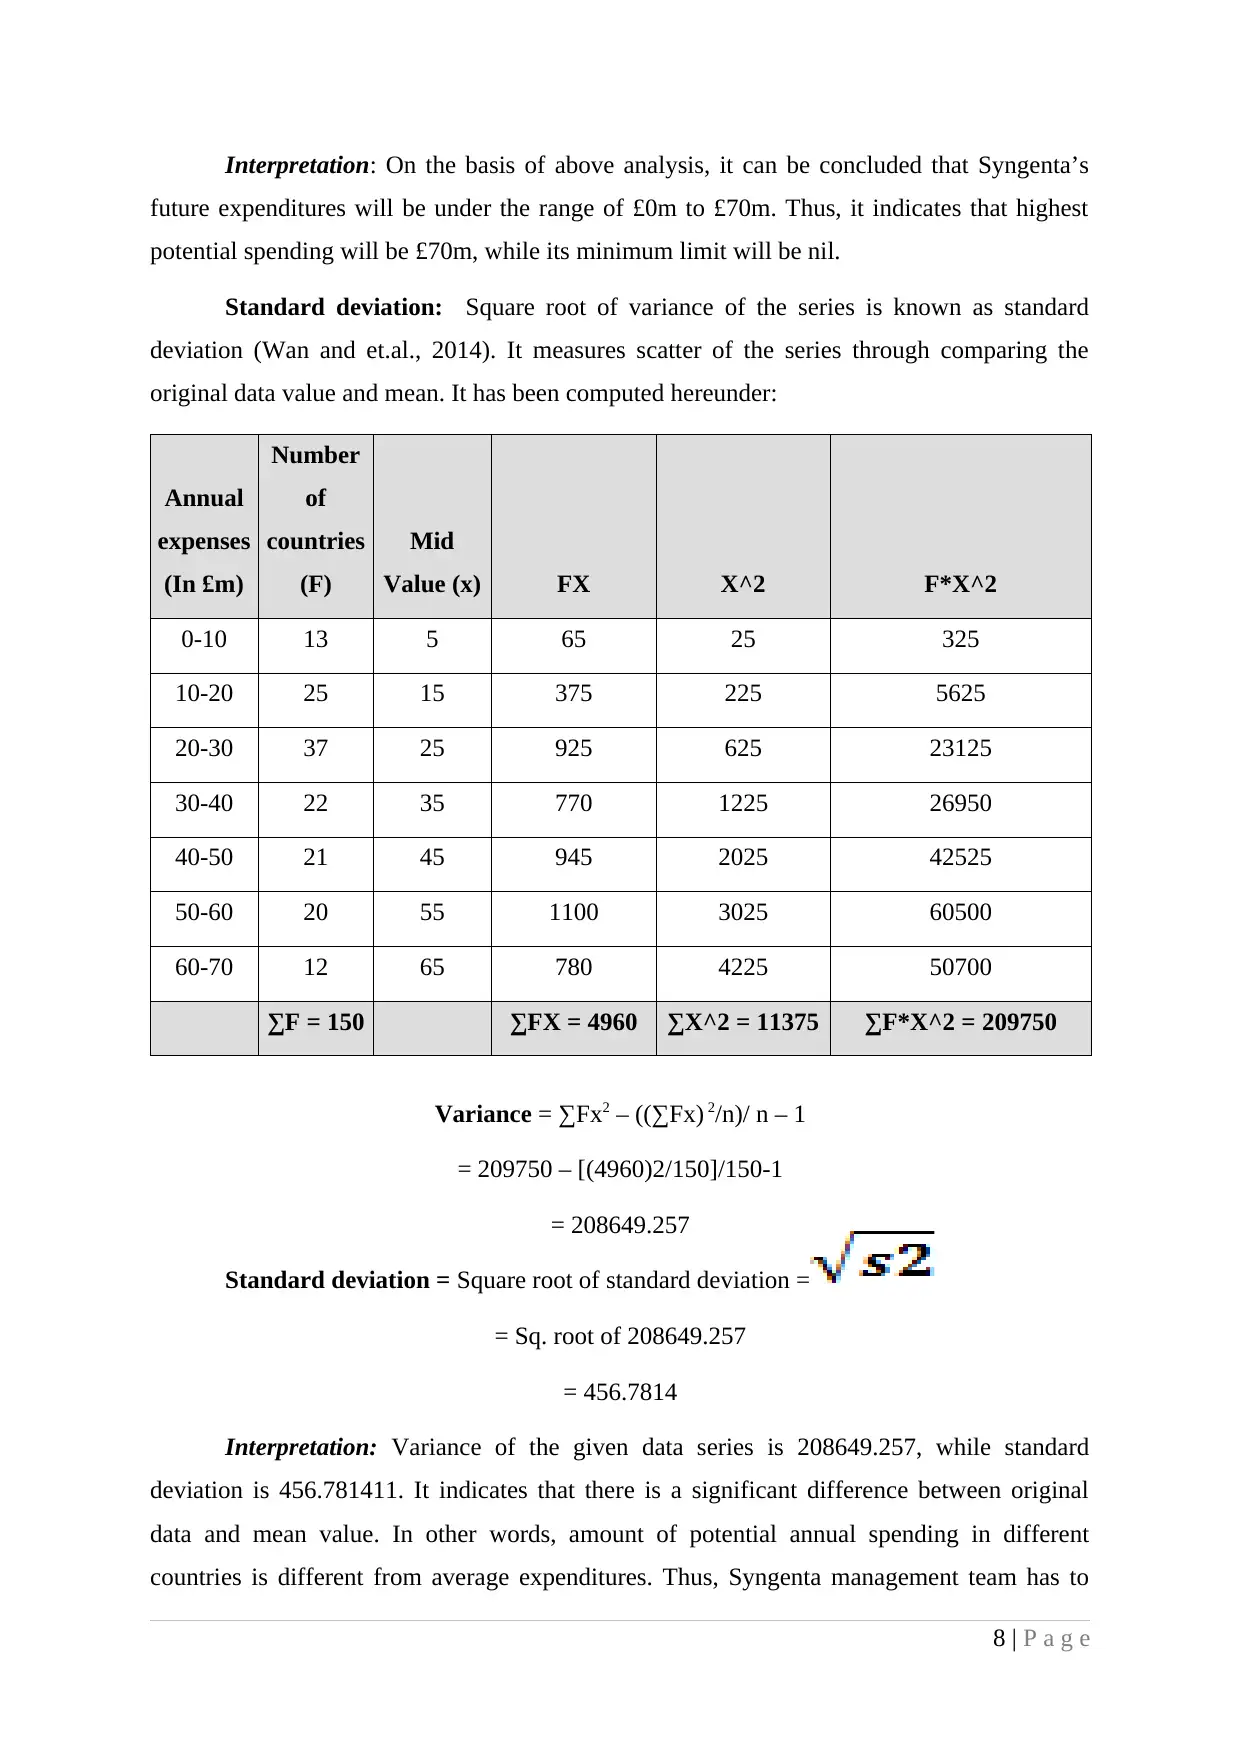
Interpretation: On the basis of above analysis, it can be concluded that Syngenta’s
future expenditures will be under the range of £0m to £70m. Thus, it indicates that highest
potential spending will be £70m, while its minimum limit will be nil.
Standard deviation: Square root of variance of the series is known as standard
deviation (Wan and et.al., 2014). It measures scatter of the series through comparing the
original data value and mean. It has been computed hereunder:
Annual
expenses
(In £m)
Number
of
countries
(F)
Mid
Value (x) FX X^2 F*X^2
0-10 13 5 65 25 325
10-20 25 15 375 225 5625
20-30 37 25 925 625 23125
30-40 22 35 770 1225 26950
40-50 21 45 945 2025 42525
50-60 20 55 1100 3025 60500
60-70 12 65 780 4225 50700
∑F = 150 ∑FX = 4960 ∑X^2 = 11375 ∑F*X^2 = 209750
Variance = ∑Fx2 – ((∑Fx) 2/n)/ n – 1
= 209750 – [(4960)2/150]/150-1
= 208649.257
Standard deviation = Square root of standard deviation =
= Sq. root of 208649.257
= 456.7814
Interpretation: Variance of the given data series is 208649.257, while standard
deviation is 456.781411. It indicates that there is a significant difference between original
data and mean value. In other words, amount of potential annual spending in different
countries is different from average expenditures. Thus, Syngenta management team has to
8 | P a g e
Paraphrase This Document
Need a fresh take? Get an instant paraphrase of this document with our AI Paraphraser
consider annual expenses in all the countries for launching of Amistar. Otherwise, operations
cannot be done effectively. In some countries, annual expenditures will be very high than
mean. However, in other countries, it may be comparatively less than average (Nakajima and
et.al., 2013). Thus, manager has to manage funds accordingly so that firm will be able to
remove financial difficulties.
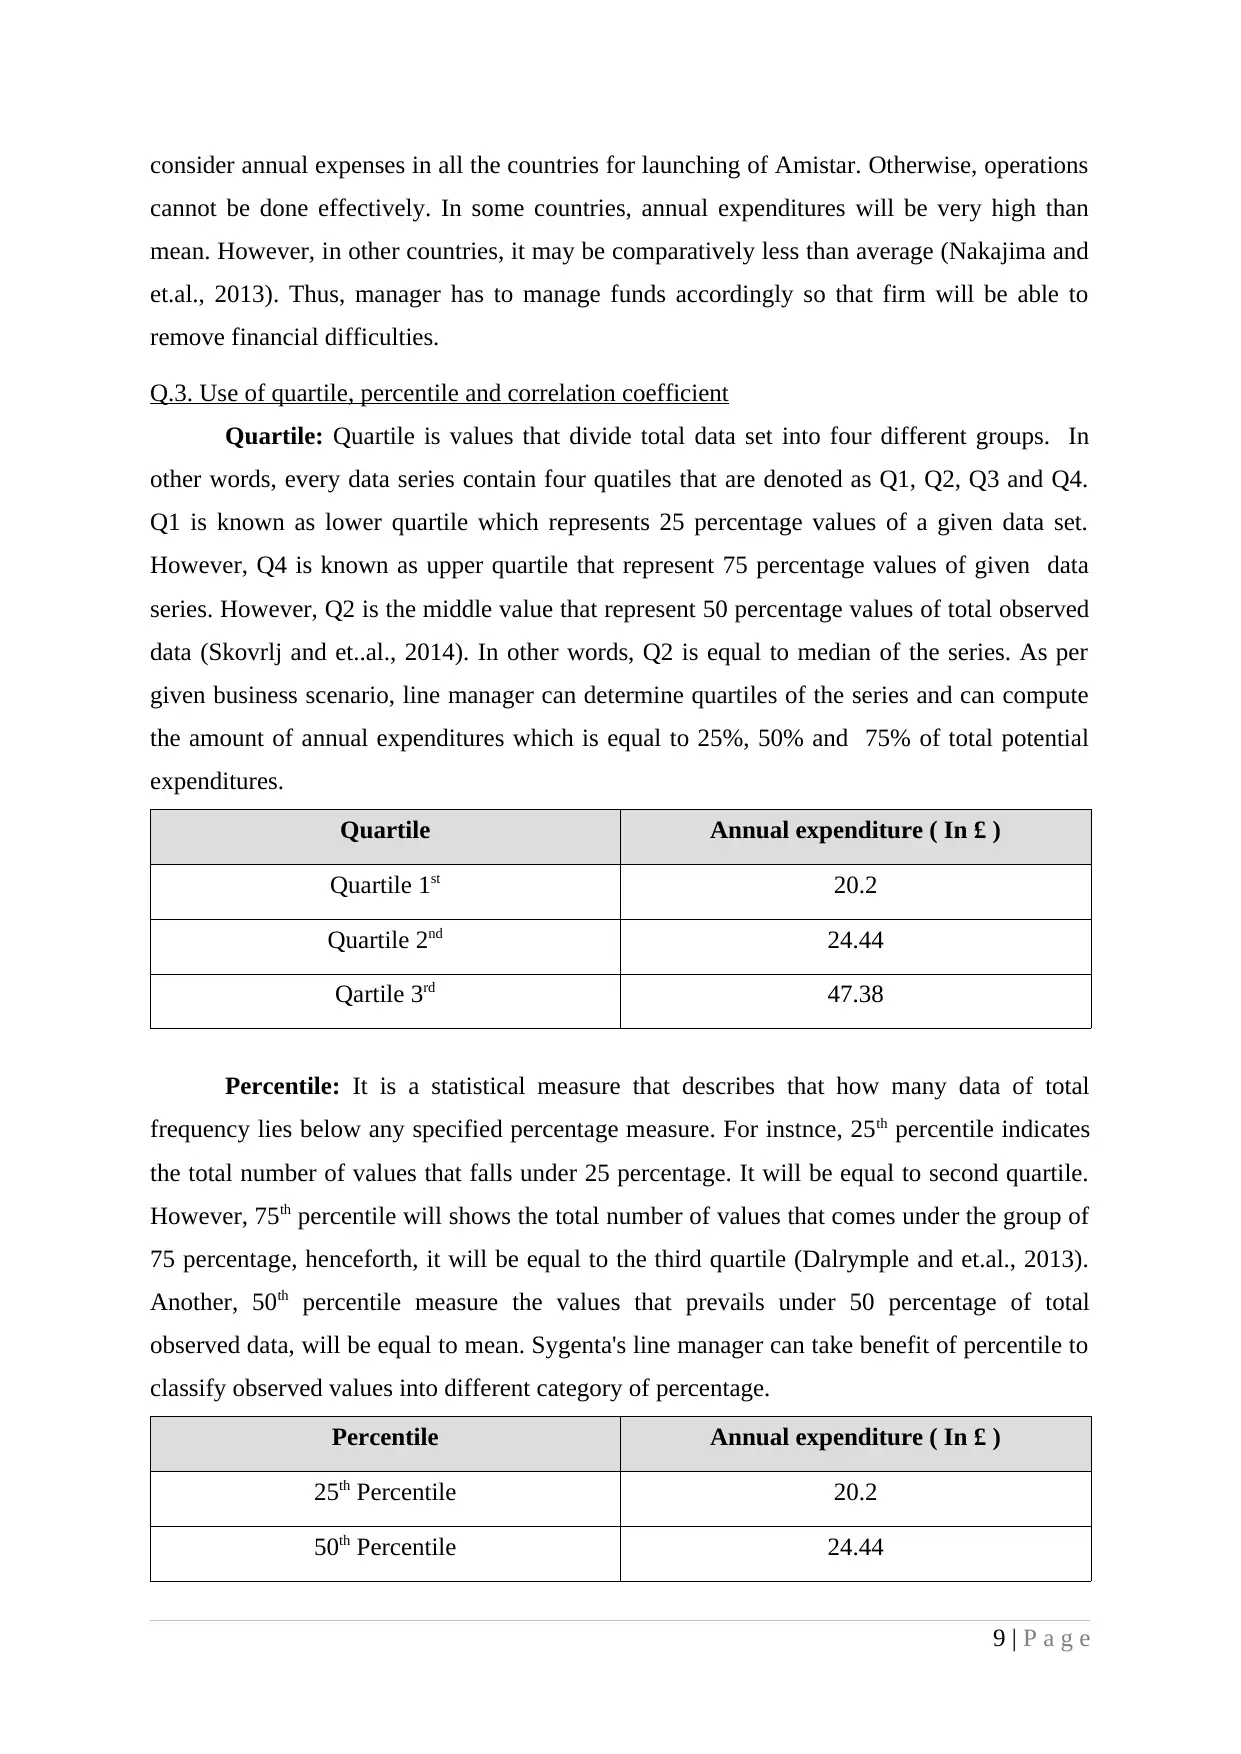
Q.3. Use of quartile, percentile and correlation coefficient
Quartile: Quartile is values that divide total data set into four different groups. In
other words, every data series contain four quatiles that are denoted as Q1, Q2, Q3 and Q4.
Q1 is known as lower quartile which represents 25 percentage values of a given data set.
However, Q4 is known as upper quartile that represent 75 percentage values of given data
series. However, Q2 is the middle value that represent 50 percentage values of total observed
data (Skovrlj and et..al., 2014). In other words, Q2 is equal to median of the series. As per
given business scenario, line manager can determine quartiles of the series and can compute
the amount of annual expenditures which is equal to 25%, 50% and 75% of total potential
expenditures.
Quartile Annual expenditure ( In £ )
Quartile 1st 20.2
Quartile 2nd 24.44
Qartile 3rd 47.38
Percentile: It is a statistical measure that describes that how many data of total
frequency lies below any specified percentage measure. For instnce, 25th percentile indicates
the total number of values that falls under 25 percentage. It will be equal to second quartile.
However, 75th percentile will shows the total number of values that comes under the group of
75 percentage, henceforth, it will be equal to the third quartile (Dalrymple and et.al., 2013).
Another, 50th percentile measure the values that prevails under 50 percentage of total
observed data, will be equal to mean. Sygenta's line manager can take benefit of percentile to
classify observed values into different category of percentage.
Percentile Annual expenditure ( In £ )
25th Percentile 20.2
50th Percentile 24.44
9 | P a g e
cannot be done effectively. In some countries, annual expenditures will be very high than
mean. However, in other countries, it may be comparatively less than average (Nakajima and
et.al., 2013). Thus, manager has to manage funds accordingly so that firm will be able to
remove financial difficulties.
Q.3. Use of quartile, percentile and correlation coefficient
Quartile: Quartile is values that divide total data set into four different groups. In
other words, every data series contain four quatiles that are denoted as Q1, Q2, Q3 and Q4.
Q1 is known as lower quartile which represents 25 percentage values of a given data set.
However, Q4 is known as upper quartile that represent 75 percentage values of given data
series. However, Q2 is the middle value that represent 50 percentage values of total observed
data (Skovrlj and et..al., 2014). In other words, Q2 is equal to median of the series. As per
given business scenario, line manager can determine quartiles of the series and can compute
the amount of annual expenditures which is equal to 25%, 50% and 75% of total potential
expenditures.
Quartile Annual expenditure ( In £ )
Quartile 1st 20.2
Quartile 2nd 24.44
Qartile 3rd 47.38
Percentile: It is a statistical measure that describes that how many data of total
frequency lies below any specified percentage measure. For instnce, 25th percentile indicates
the total number of values that falls under 25 percentage. It will be equal to second quartile.
However, 75th percentile will shows the total number of values that comes under the group of
75 percentage, henceforth, it will be equal to the third quartile (Dalrymple and et.al., 2013).
Another, 50th percentile measure the values that prevails under 50 percentage of total
observed data, will be equal to mean. Sygenta's line manager can take benefit of percentile to
classify observed values into different category of percentage.
Percentile Annual expenditure ( In £ )
25th Percentile 20.2
50th Percentile 24.44
9 | P a g e
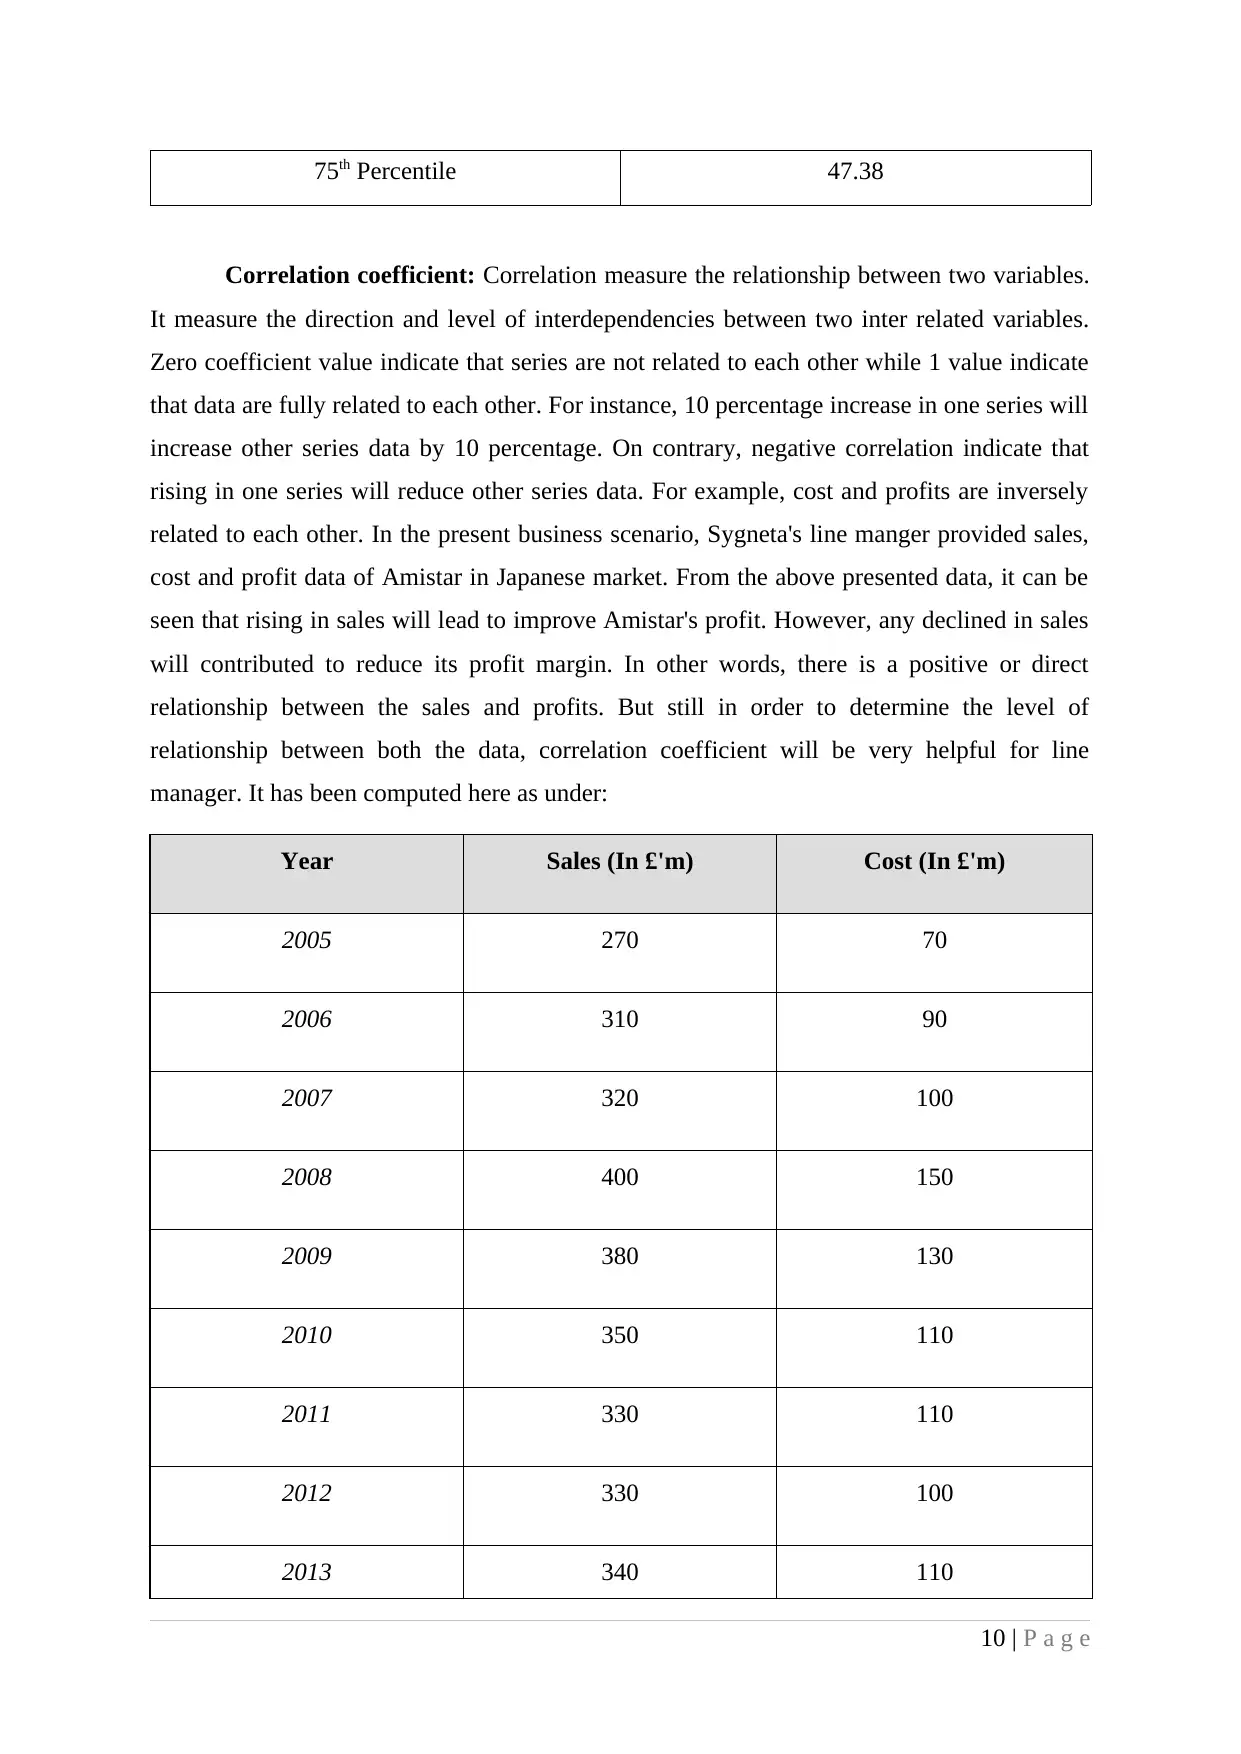
75th Percentile 47.38
Correlation coefficient: Correlation measure the relationship between two variables.
It measure the direction and level of interdependencies between two inter related variables.
Zero coefficient value indicate that series are not related to each other while 1 value indicate
that data are fully related to each other. For instance, 10 percentage increase in one series will
increase other series data by 10 percentage. On contrary, negative correlation indicate that
rising in one series will reduce other series data. For example, cost and profits are inversely
related to each other. In the present business scenario, Sygneta's line manger provided sales,
cost and profit data of Amistar in Japanese market. From the above presented data, it can be
seen that rising in sales will lead to improve Amistar's profit. However, any declined in sales
will contributed to reduce its profit margin. In other words, there is a positive or direct
relationship between the sales and profits. But still in order to determine the level of
relationship between both the data, correlation coefficient will be very helpful for line
manager. It has been computed here as under:
Year Sales (In £'m) Cost (In £'m)
2005 270 70
2006 310 90
2007 320 100
2008 400 150
2009 380 130
2010 350 110
2011 330 110
2012 330 100
2013 340 110
10 | P a g e
⊘ This is a preview!⊘
Do you want full access?
Subscribe today to unlock all pages.
Trusted by 1+ million students worldwide
1 out of 23
Related Documents


Your All-in-One AI-Powered Toolkit for Academic Success.
+13062052269
info@desklib.com
Available 24*7 on WhatsApp / Email
![[object Object]](/_next/static/media/star-bottom.7253800d.svg)
Unlock your academic potential
Copyright © 2020–2026 A2Z Services. All Rights Reserved. Developed and managed by ZUCOL.