Syngenta's Amistar: Sales, Cost, and Profitability Analysis in Japan
VerifiedAdded on 2023/04/22
|13
|865
|259
Presentation
AI Summary
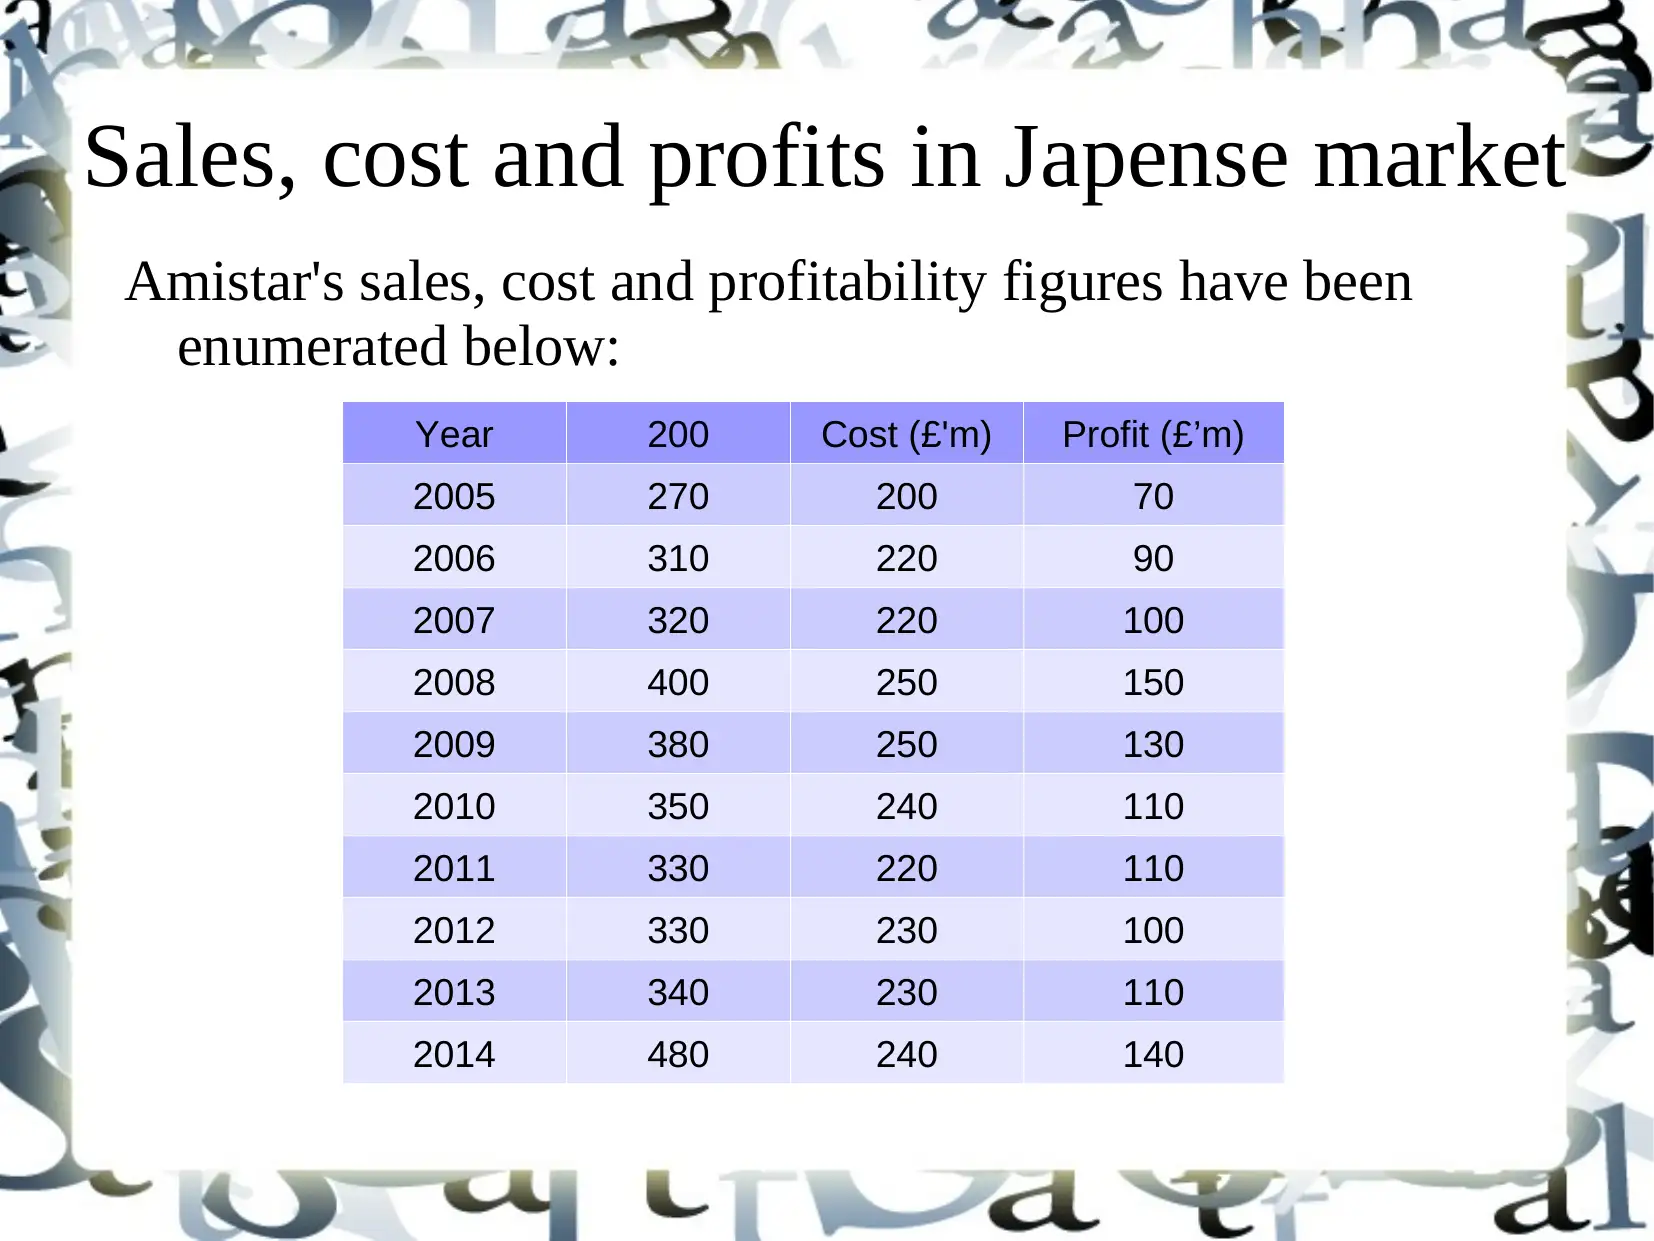
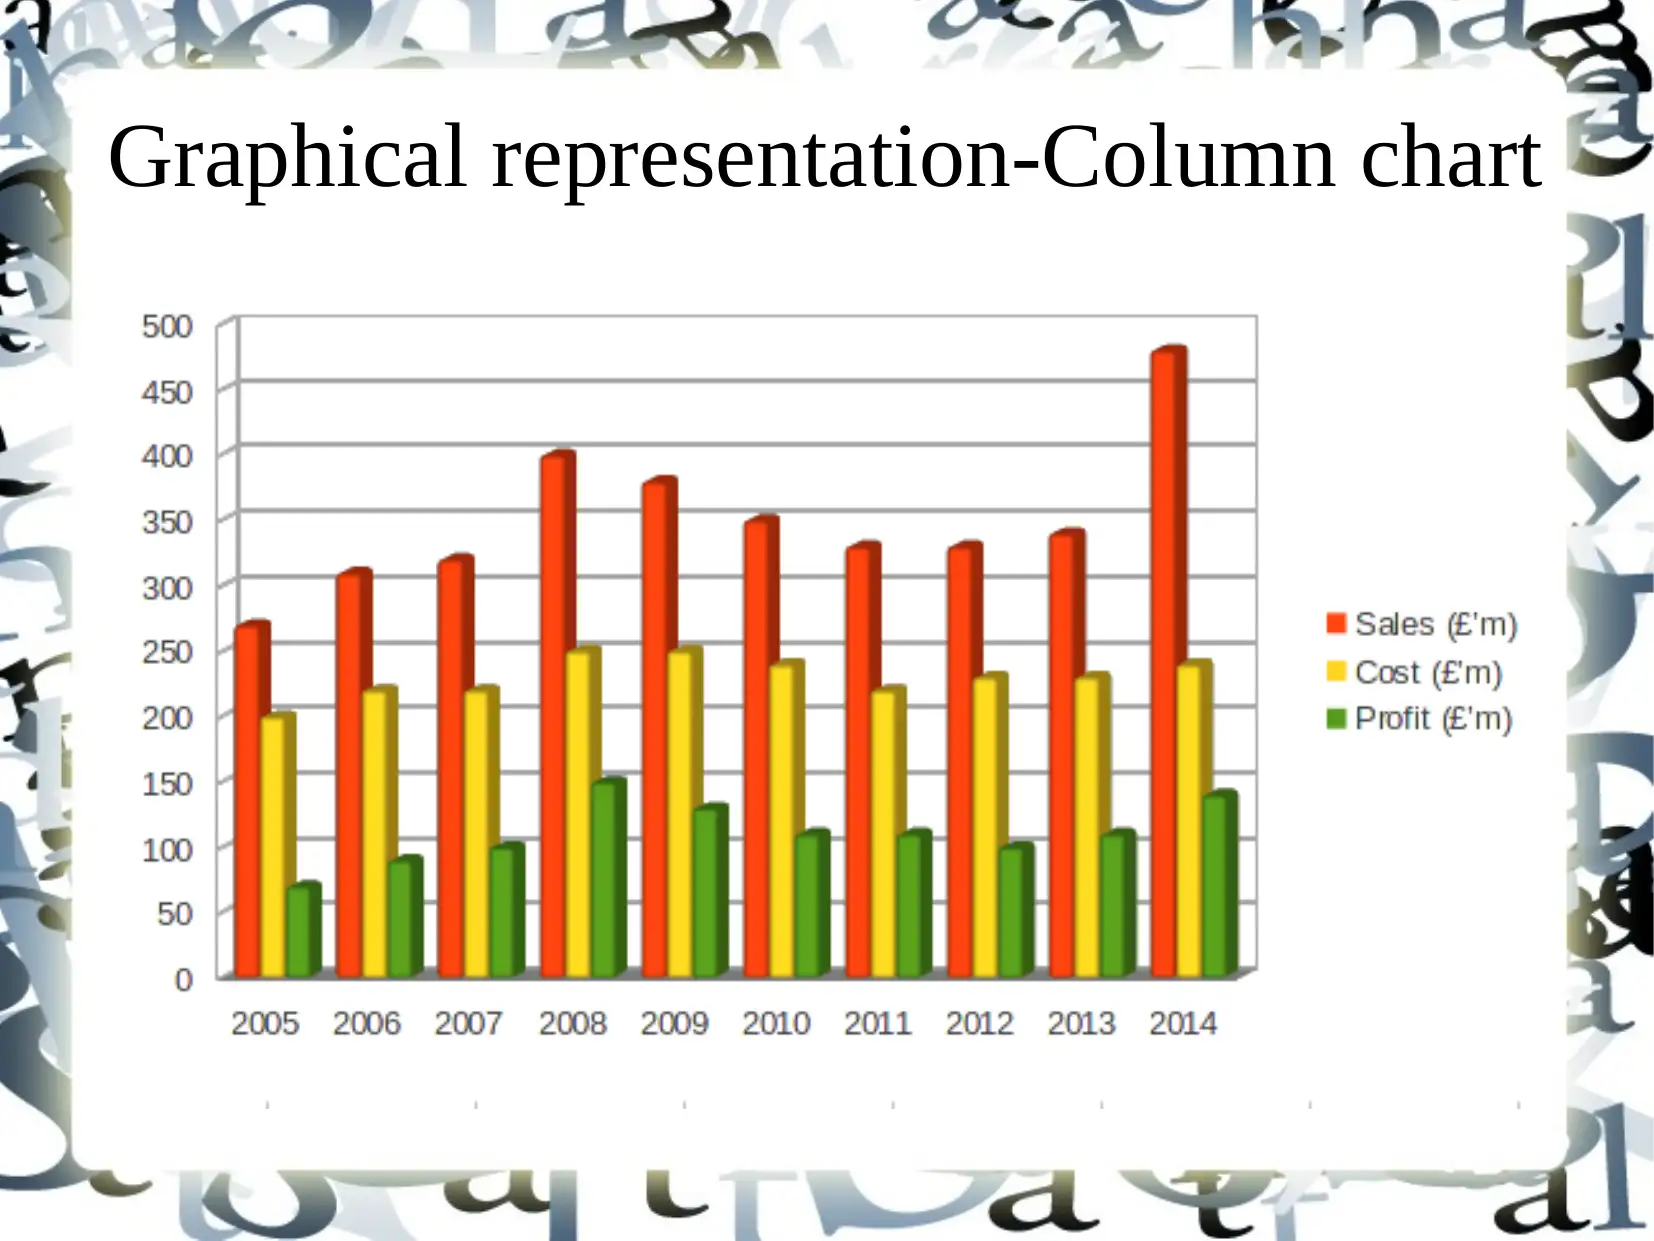
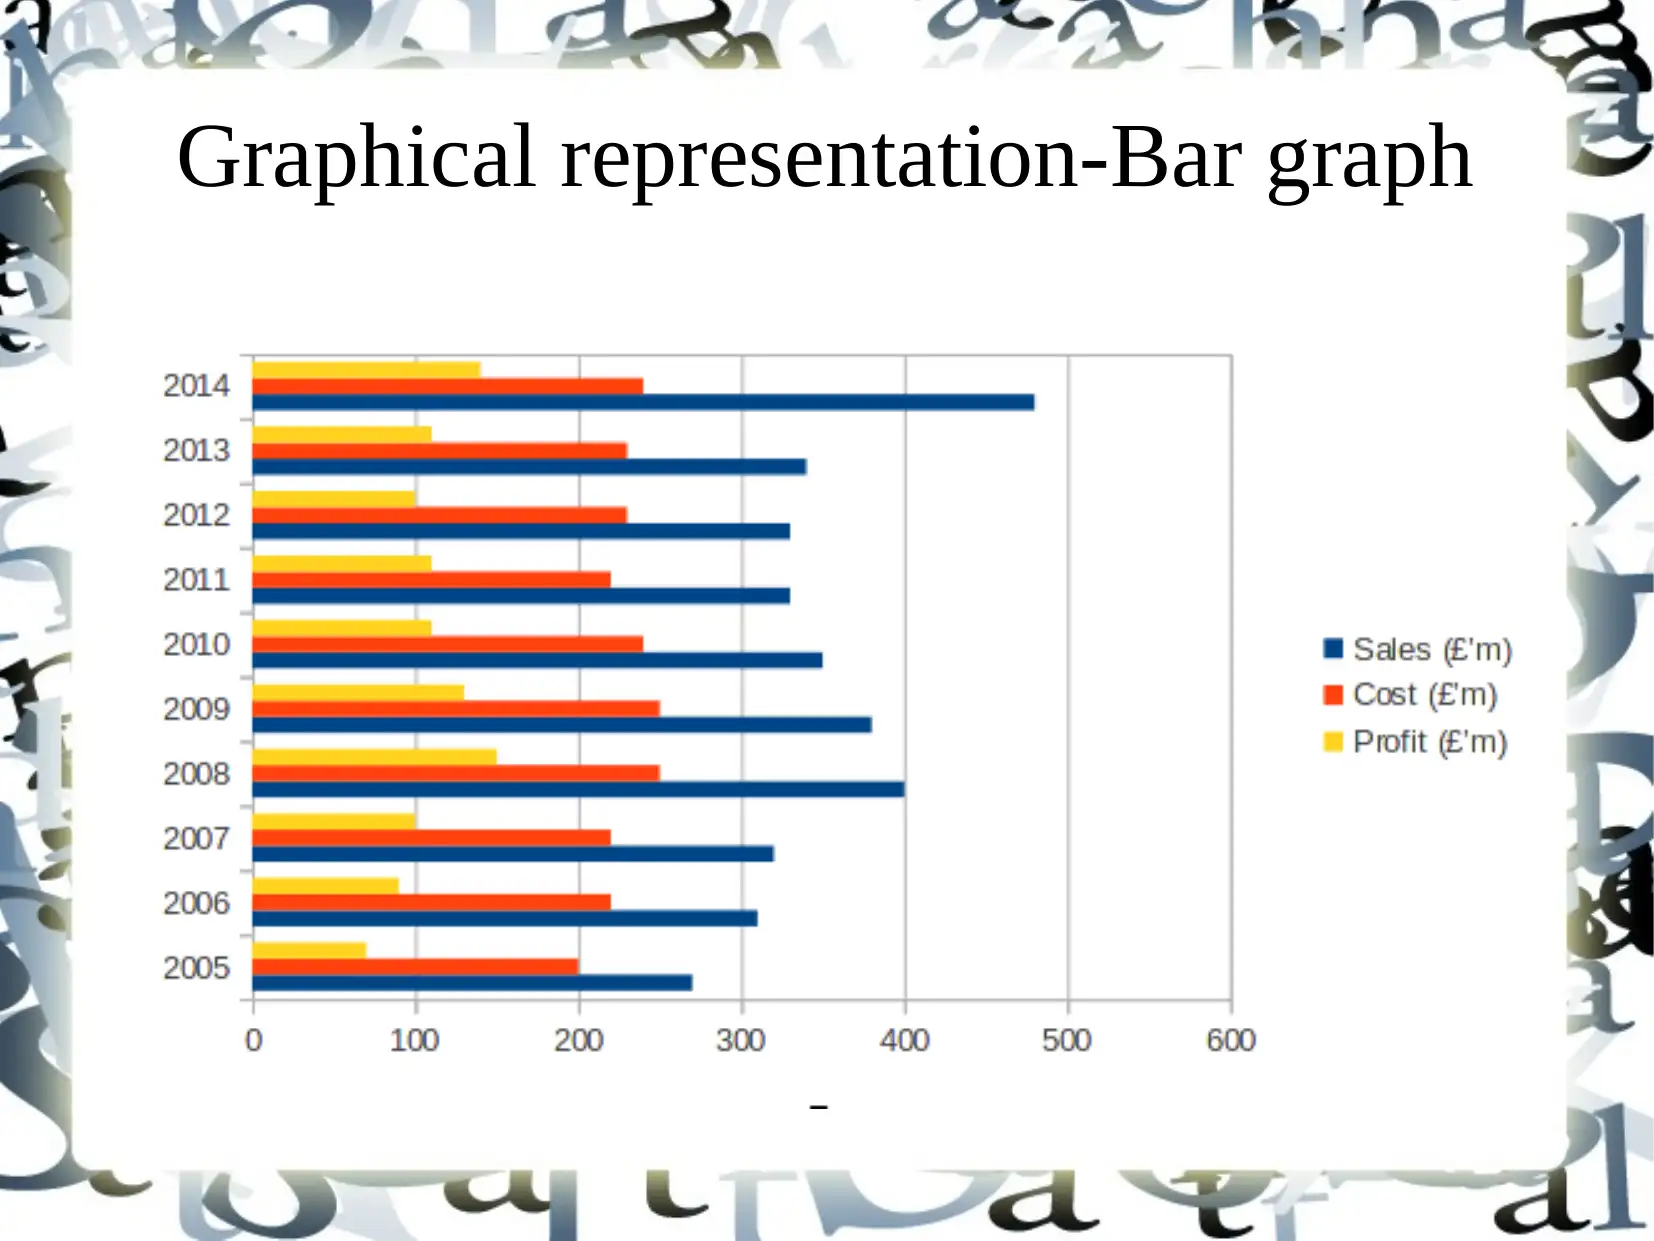
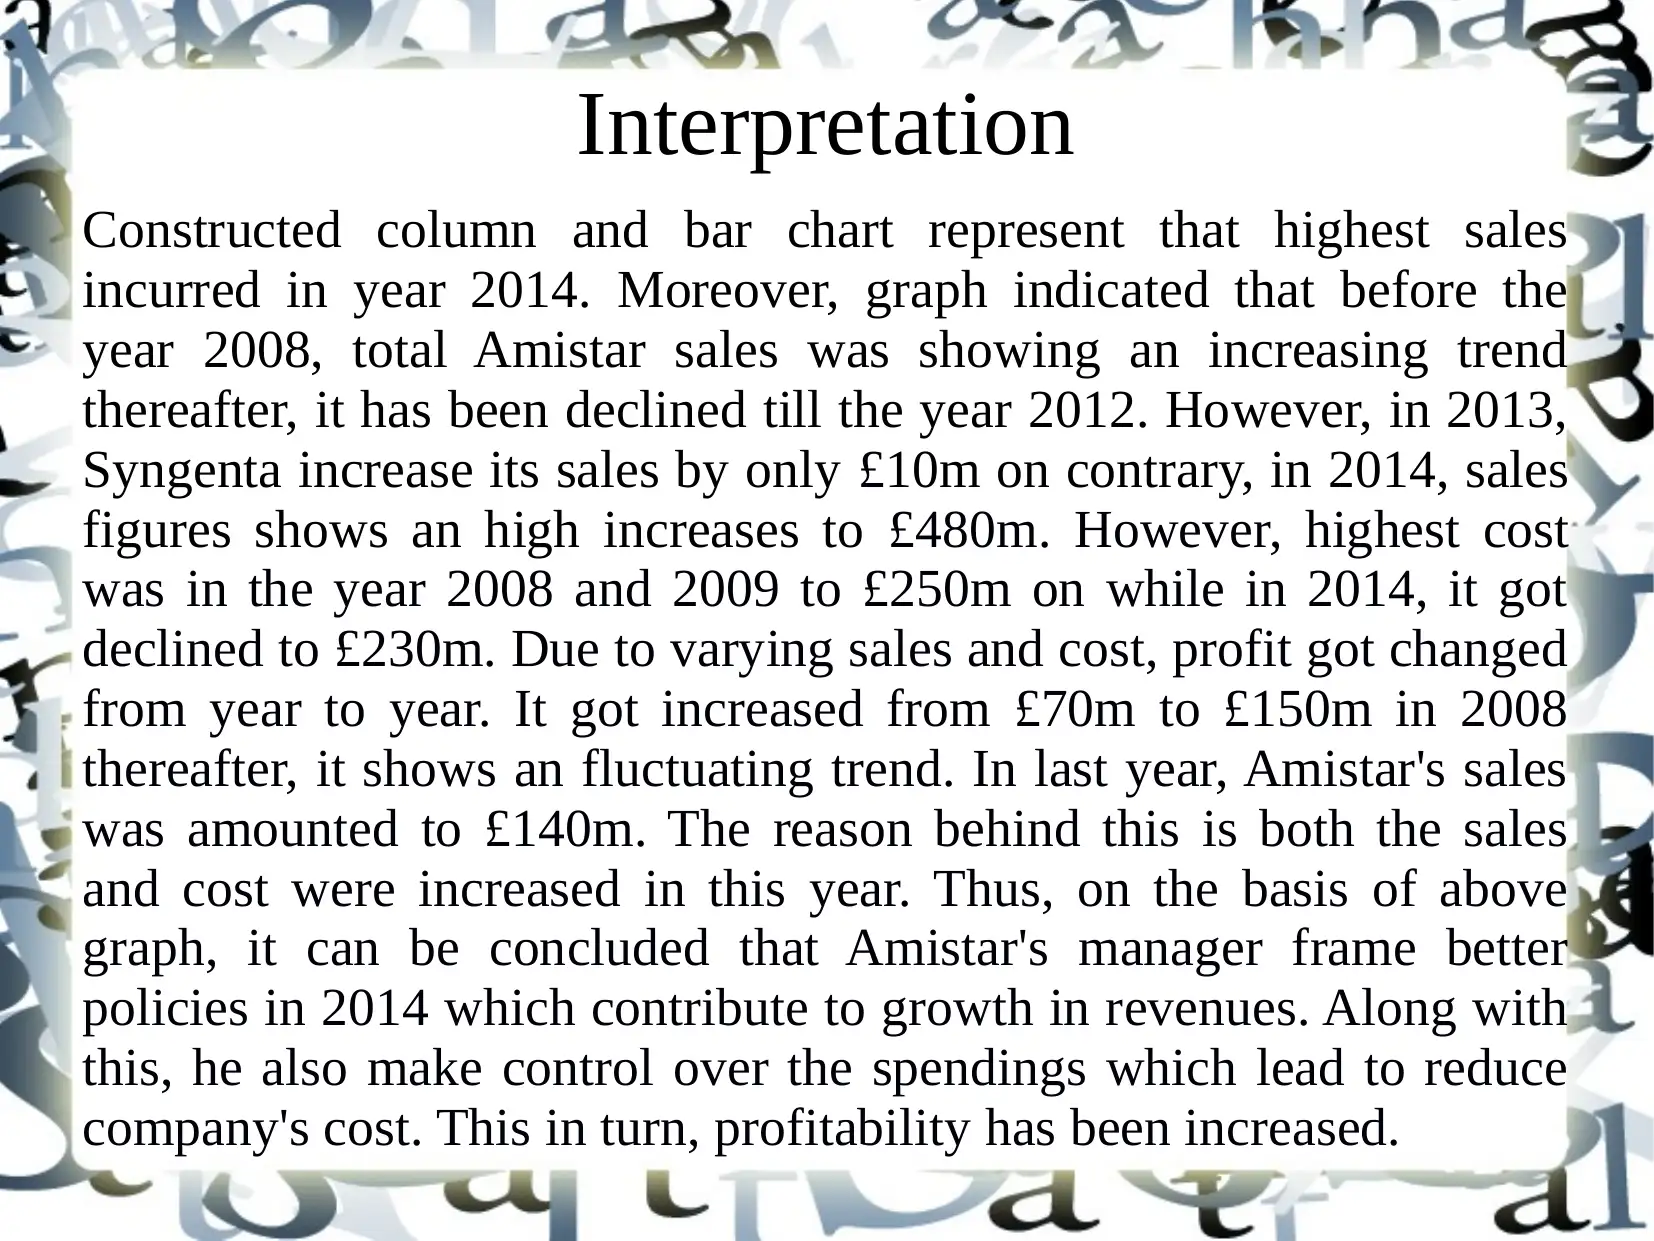
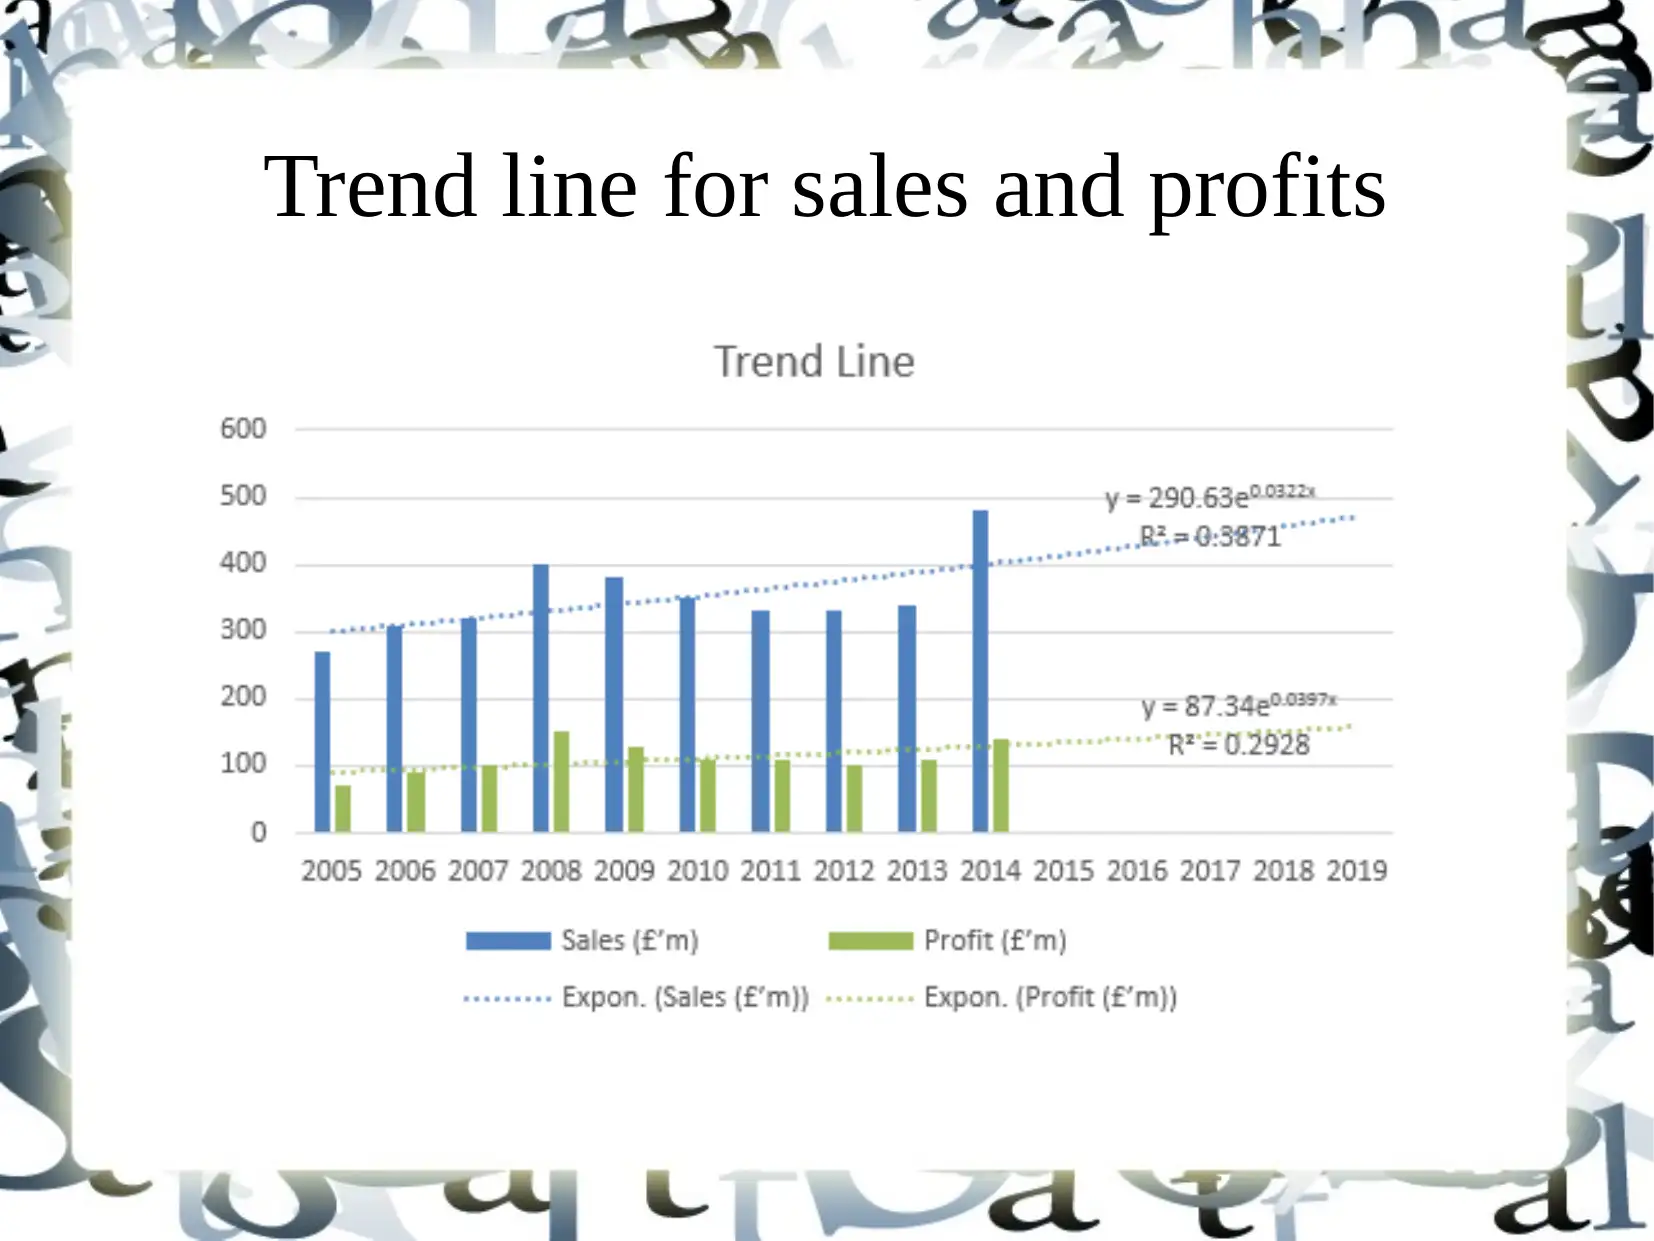
This presentation provides a detailed analysis of Syngenta's Amistar sales, cost, and profitability in the Japanese market from 2005 to 2014. It includes graphical representations using column and bar charts to illustrate historical performance, highlighting fluctuations in sales and profits. The analysis identifies key trends, such as the peak sales in 2014 and the fluctuating profitability over the years. Trend lines are constructed to predict future sales and profitability, suggesting potential upward movement. The presentation concludes that while historical trends have been variable, recent performance indicates a positive trajectory for Amistar in the Japanese market, promising long-term growth for Syngenta. Desklib offers similar solved assignments and past papers for students.

Task 3 (Q.3.)
Business decision making
Paraphrase This Document
Need a fresh take? Get an instant paraphrase of this document with our AI Paraphraser

Introduction
Syngenta is a global leading organization operartes in
more than 90 countries across the world. It was
established with the purpose of “Bringing plant
potential to life”. It provides variety of fungicide
produts to large number of users and Amistar is its
one of the popular brand. The presentation depicts
about the graphical presentation of Amistar's sales,
cost and profitability in the Japanese market to assess
its historical performance. However, trend lines have
been constructed for determining potential sales and
profitability.

Sales, cost and profits in Japense market
Amistar's sales, cost and profitability figures have been
enumerated below:
Year 200 Cost (£'m) Profit (£’m)
2005 270 200 70
2006 310 220 90
2007 320 220 100
2008 400 250 150
2009 380 250 130
2010 350 240 110
2011 330 220 110
2012 330 230 100
2013 340 230 110
2014 480 240 140
Amistar's sales, cost and profitability figures have been
enumerated below:
Year 200 Cost (£'m) Profit (£’m)
2005 270 200 70
2006 310 220 90
2007 320 220 100
2008 400 250 150
2009 380 250 130
2010 350 240 110
2011 330 220 110
2012 330 230 100
2013 340 230 110
2014 480 240 140
⊘ This is a preview!⊘
Do you want full access?
Subscribe today to unlock all pages.

Trusted by 1+ million students worldwide

Graphical representation-Column chart
Paraphrase This Document
Need a fresh take? Get an instant paraphrase of this document with our AI Paraphraser

Graphical representation-Bar graph

Interpretation
Constructed column and bar chart represent that highest sales
incurred in year 2014. Moreover, graph indicated that before the
year 2008, total Amistar sales was showing an increasing trend
thereafter, it has been declined till the year 2012. However, in 2013,
Syngenta increase its sales by only £10m on contrary, in 2014, sales
figures shows an high increases to £480m. However, highest cost
was in the year 2008 and 2009 to £250m on while in 2014, it got
declined to £230m. Due to varying sales and cost, profit got changed
from year to year. It got increased from £70m to £150m in 2008
thereafter, it shows an fluctuating trend. In last year, Amistar's sales
was amounted to £140m. The reason behind this is both the sales
and cost were increased in this year. Thus, on the basis of above
graph, it can be concluded that Amistar's manager frame better
policies in 2014 which contribute to growth in revenues. Along with
this, he also make control over the spendings which lead to reduce
company's cost. This in turn, profitability has been increased.
⊘ This is a preview!⊘
Do you want full access?
Subscribe today to unlock all pages.

Trusted by 1+ million students worldwide

Trend lines
It is very important statistical tool that helps to determine
future occurence on the basis of historical performance.
Syngenta's manger can construct trend line for sales and profits
to anticipate future performance of its product Amistar. It gives
an idea about potential business performance through
estimating its sales and profitability for the upcoming period.
For the present business scenario, trend line has been prepared
here:
Paraphrase This Document
Need a fresh take? Get an instant paraphrase of this document with our AI Paraphraser

Trend line for sales and profits

Interpretation for sales trend line
Constructed sales trend line indicated that from the year 2005
to 2014, Amistar's sales shows an fluctuating trend. It got
inclined upto £400m in 2008. There after, it got reduced to
£330m in 2012 but in the year 2013 and 2014, Amistar sales
has been inclined to £340m and £480m respectively. Thus,
overall sales in Japanese market is fluctuating because it got
reduced or improved over the period. However, trend line
predicted that in upcoming period, Syngenta will generate
higher revenues through Amistar sales. This will maximize
compnay's revenues to a great extent.
⊘ This is a preview!⊘
Do you want full access?
Subscribe today to unlock all pages.

Trusted by 1+ million students worldwide

Interpretation for profit trend line
Along with the sales, profitability also shows an fluctuating
trend. In the year 2005, it was £70m went up to £140m in
2014. Although, the highest profit incurred in the year 2008 to
£150m. However, trend line concluded that there is a greter
chance for increasing profitability in upcoming year. Upward
movement of profit trend line indicated that in future period,
Syngenta will generate higher profits from selling its popular
product Amistar.
Paraphrase This Document
Need a fresh take? Get an instant paraphrase of this document with our AI Paraphraser

Conclusion
Thus, on the basis of above presentation, it can be
concluded that historical trends of sales, cost and
profits were fluctuating. But still, in the ending two
years, it shows an favourable trend because of sales
and profitability rises. Therefore, the trend line
indicated that there will be a upward movement in
potential sales and profits in future period. This in
turn, Syngenta can achieve its targets and ensure
long term growth.

Refrences
Schwabish, J.A., 2014. An Economist's Guide to Visualizing
Data. The Journal of Economic Perspectives. 28(1). pp. 209-
233.
Ermilov, I. and et.al., 2013. Linked open data statistics:
Collection and exploitation. In Knowledge Engineering and the
Semantic Web. Springer Berlin Heidelberg. pp. 242-249.
Deochand, N., Costello, M.S. and Fuqua, R.W., 2015. Phase‐
change lines, scale breaks, and trend lines using Excel 2013.
Journal of applied behavior analysis. 48(2). pp. 478-493.
⊘ This is a preview!⊘
Do you want full access?
Subscribe today to unlock all pages.

Trusted by 1+ million students worldwide
1 out of 13
Related Documents
Your All-in-One AI-Powered Toolkit for Academic Success.
+13062052269
info@desklib.com
Available 24*7 on WhatsApp / Email
Unlock your academic potential
Copyright © 2020–2025 A2Z Services. All Rights Reserved. Developed and managed by ZUCOL.


