Kingston University: AML Treatment with Autophagy Modulators Project
VerifiedAdded on 2022/09/09
|33
|7874
|59
Project
AI Summary
This project investigates the effect of autophagy modulators, specifically chloroquine and rapamycin, on STAG2 mutated cells in the context of Acute Myeloid Leukemia (AML). The research explores the use of these modulators as potential therapeutic approaches for AML, focusing on their impact on cell viability and DNA repair mechanisms. The study examines the effects of these drugs, along with cisplatin, on cell death and autophagy modulation in STAG2 mutated cell lines (UMUC-3) and a control cell line (ASPC-1). The project aims to determine if autophagy modulation can enhance drug sensitivity towards platinum-based chemotherapy, providing a potential targeted therapy for AML. The methods include cell culturing, drug preparation, cell viability assays (Alamar Blue), and statistical analysis. The study tests hypotheses regarding the increased cellular death in STAG2 mutated cells, the differential effects of chloroquine and rapamycin, and the enhanced drug sensitivity with autophagy modulation. The results section presents data on cell counts and cell viability, with a discussion of the findings in the context of existing literature and the implications for future research on AML treatment strategies.
Running head: MEDICAL
BIOMEDICAL SCIENCE
Name of the Student
Name of the University
Author Note
BIOMEDICAL SCIENCE
Name of the Student
Name of the University
Author Note
Paraphrase This Document
Need a fresh take? Get an instant paraphrase of this document with our AI Paraphraser
1Running head: MEDICAL
Abstract
Aggressive leukemia (AML) has occurred with the incidence of one lakh cases and has been
observed to increase with age. The identification of genetic and molecular groups have been
increasingly studied for the treatment of AML. This disease has been characterized by
various chromosomal translocations and mutations associated with the gene differentiations
as FLT3, NPM1, CEBPA ASXL. Autophagy is the sequential process involving cell death
regulation and damaged cellular debris recycling is initiated by external and cellular cures to
maintain proper homeostasis and metabolism. This process is important for the regulation of
double-stranded DNA repair.
Table of Content
2Running head: MEDICAL
s
Introduction................................................................................................................................4
AML (Acute Myeloid Leukaemia):.......................................................................................4
Treatment strategies:..............................................................................................................4
STAG2- Cohesin Complex:...................................................................................................5
DNA repair:............................................................................................................................5
Autophagy:.............................................................................................................................6
Chloroquine............................................................................................................................6
Rapamycin..............................................................................................................................6
Aims and Objectives..................................................................................................................7
Materials and Methods...............................................................................................................7
Reagents.................................................................................................................................7
Cell culturing and lines..........................................................................................................8
Cell subculture.......................................................................................................................8
Counting of cells....................................................................................................................8
Calculation of cell counting...................................................................................................9
Preparation of drug and addiction of drugs..........................................................................10
Alamar Blue Assay (Cell Viability).....................................................................................13
Cisplatin (Alkylating agent) - Combined drug therapy........................................................13
Statistical Analysis...............................................................................................................14
Results......................................................................................................................................14
Counting of cells:.................................................................................................................14
⊘ This is a preview!⊘
Do you want full access?
Subscribe today to unlock all pages.
Trusted by 1+ million students worldwide
3Running head: MEDICAL
Alamar Blue Assay: Cell Viability......................................................................................19
Discussion................................................................................................................................24
Conclusion................................................................................................................................29
References................................................................................................................................30
Paraphrase This Document
Need a fresh take? Get an instant paraphrase of this document with our AI Paraphraser
4Running head: MEDICAL
Introduction
AML (Acute Myeloid Leukaemia):
According to various research studies, AML is a part of leukemia that occurs in
adults. The majority of the leukemia cases occurring in adults consists of AML as the root
cause (Li et al. 2019). This form of leukemia has been characterized by mutation
(translocation) in the gene differentiation and hematopoietic proliferation. This condition
farther leads to the accumulation of cells in the peripheral blood and bone marrow due to the
absence of an apoptotic mechanism. Thus, it is an important decision to choose an
appropriate method for the experiment. One of the best future methods for the conduction of
this experiment is the ((3-(4,5-dimethylthiazol-2-yl)-2–5-diphenyltetrazolium bromide) assay
(MTT) which is a colorimetric assay used for the access to cell viability and cellular toxicity
(Darwish et al. 2016). This procedure includes the use of succinate which is used to
determine the cellular viability. While MTT was added to the cells, NADH will work by
reducing it to a purple formazan that can be quantified by the use of light absorbance.
According to the statistical records, 12 people per 100,000 people over 65 years have more
chance of the disease than 1 individual per 100,000 people under 65 years (Saultz and Garzon
2016). This disease is diagnosed with a prevalence percentage of over 20% blast in peripheral
blood or bone marrow followed by the detection of myeloid progenitor cells in
myeloperoxidase test.
Treatment strategies:
Intensive induction chemotherapy with anthracycline administration for three days
and cytarabine for seven days allows a CR (complete remission) among 80% of the younger
adults. The percentage is 60% for older adults due to the reduced strength of their immune
system. Isocitrate inhibitors (IDH), FLT3 (Fms-like tyrosine kinase 3) and nuclear-exported
5Running head: MEDICAL
inhibitors are some novel therapies devised for the treatment for this disease. Repair of
defective DNA, stabilization of genomic instability and deregulation of transcription are also
the major processes of AML treatment. Thus it can be understood that the treatment can be
induced from the DNA level (Dombret and Gardin 2016). Thus, this research study uses
mutation of STAG2 along with abnormal replication of DNA to induce lethality after using
cisplatin and chloroquine. These two drugs have been observed to modulate autophagy to
involve the replication of DNA. AML treatment options have minimal side effects and are
also associated with higher efficacy.
STAG2- Cohesin Complex:
The gene stag2 encodes the cohesion complex component that participates in the
sister chromatid regulation of separation required during mitosis. After the activation of
stag2, protein acts as a tumour suppressor disrupting the separation of mitotic sister
chromatin. According to various research studies it can be stated that the chromosomal
deletions involving Xq25 as observed in myelodysplasia and AML along with several
mutations in STAG2 hotspots regions known as exon 9,11,12,20 were identified as acute
leukaemia causes (Nishiyama 2019). STAG2 has also been observed to participate in the
inactivation of RUNX1, NPM1, and RB1 or CDKN2A/B (tumour suppressor genes). This
process is named as leukemogenesis.
DNA repair:
The genomic DNA gets damaged due to various factors including radiation,
environmental chemicals, UV light, and other external factors. These factors result in the
generation of reactive oxygen species (ROS) which gives rise to replication errors. Induction
of DSB (double-stranded breaks) occurs by an improper activation of Chk2 and the absence
of Rad21 leading to an increased probability of chromosomal rearrangement (Zatopek et al.
⊘ This is a preview!⊘
Do you want full access?
Subscribe today to unlock all pages.
Trusted by 1+ million students worldwide
6Running head: MEDICAL
2019). One of the most significant repair techniques is BER (Base Excision repair) required
for BRCA mutant cells which cause the ovarian cell death and breast cancers associated with
improper homologous recombination. Normal cells do not get affected.
Autophagy:
The sequential process involving cell death regulation and damaged cellular debris
recycling is initiated by external and cellular cures to maintain proper homeostasis and
metabolism. These conditions protect the cell against the oncogenic development which is
deregulated in a broad range of cancers (Zhang, Shang and Zhou 2015). When a cell is
observed to experience a nutrient deprivation or metabolic stress, the cell undergoes
catabolism to recycle the cellular organelles which are damaged and extract the proteins from
damaged of long-lived organelles.
Chloroquine
Chloroquine is an antimalarial agent, which is used in the treatment of erythematous,
and rheumatoid arthritis. Chloroquine acts by the inhibition of an autophagic flux during a
later stage to prevent the fusion of autophagosomes with lysosomes. This condition causes
the degradation of autolysosome (Verbaanderd et al. 2017).
Rapamycin
Also known as RAPA which is a member of the macrocyclic class of
immunosuppressive drugs that has been used as an immunosuppressive drug. The primary
target for rapamycin (mTOR) acts as an amino acid and ATP sensor involved in the balance
of nutrient availability. The majority of cancers show hyperactivity during the switching on
of mTOR by an oncogenic signaling pathway. Rapamycin inhibits the mTORC1 activity
which can also inhibit the actions of mTORC2 (Li, Kim and Blenis, 2014).
Paraphrase This Document
Need a fresh take? Get an instant paraphrase of this document with our AI Paraphraser
7Running head: MEDICAL
Aims and Objectives
The main aim of this project is to check the effect of autophagy in STAG2 mutated cells with
a defect in DNA repair by using autophagy inducer rapamycin for the inhibition of mTOR
(mammalian TOR) in order to invoke a defect in DNA repair for the destruction of mutated
cells. Another autophagy inhibitor known as chloroquine is also used here which prevents the
fusion of lysosome and phagosome. Both these functions will be studies to provide a targeted
therapy required for the treatment of AML. This experiment will also aim to provide a sub
stratum for future research studies involving a more efficient treatment strategy.
The following three hypotheses will be tested:
1. STAG2 mutated cells will have their cellular deaths increased to a higher level than the
non-mutated cell line.
2. The cells, which are incubated with chloroquine, are expected to have an increased death
as compared to the cells treated with rapamycin.
3. The modulation of autophagy is expected to increase the drug sensitivity towards platinum.
Thus, cells which are incubated with a platinum-based chemotherapy drug (Cisplatin)
and autophagy modulators are expected to have the most amount of cell death.
Materials and Methods
Reagents: DMEM (Dulbecco’s modified eagle medium) with high concentration of glucose
(4500 mg/L), FBS (Fetal bovine serum), antibiotic- Streptomycin-Penicillin, PBS
(Dulbecco’s phosphate buffer saline), Trypsin-EDTA solution, Trypan Blue, DMSO
(Dimethyl sulfoxide), RAP (Drugs- autophagy inducer Rapamycin) [3150055-EMD
Millipore), CHL (Chloroquine diphosphate salt) [C6628-25G-25G –SIGMA-autophagy
8Running head: MEDICAL
inhibitor). AlamarBlue cell viability reagent (Thermofisher Scientific, UK) and 100mM
Cisplatin (Sigma).
Cell culturing and lines: ASPC-1 and UMUC-3 were frozen and thawed inside a 37-
degree centigrade water bath. UMUC3 (cells obtained from the cell line of the human urinary
bladder associated with a STAG2 mutation). APSC1 (adenocarcinoma pancreas cell line
without the absence of STAG2 mutation will be used as a control). The thawed samples were
then transferred into falcon tubes and then washed with a 10mL media. This apparatus was
then centrifuged at 1000 rpm for 5 minutes. Following this centrifugation, the tubes were
taken out and the supernatant was discarded. Then the pellet was farther re-suspended into a
10mL media which was prepared by the addition of 50 mL of 10% FBS. Penicillin-
Streptomycin (5 mL) 1% was added to 500 mL DMEM and mixed with the previous solution.
The complete mixture was then transferred to a flask and incubated with 5% CO2 required
for cell growth and 37-degree centigrade. The cells were isolated from the mixture and then
sub-cultured to use in the project. Tissue culture hood was the chamber used to perform all
the cell culturing and subculturing after using 70% alcohol spray to sterilize the chamber.
Cell subculture: The cells were allowed to grow up to a 75% confluency level after every
two days. The T75 flasks were removed from the incubator and the media from one flask is
then transferred equally to two falcon tubes. Then 5 mL PBS was added to the mixture and
incubated for 5 minutes. These were then transferred to both the falcon tubes and incubated
for 5 minutes with 5% CO2 at 37-degree centigrade. Then the supernatant was discarded
followed by the pellet with cells suspended in DMEM 20 mL media. The final solution is
then transferred to 2 separate T75 flasks and then placed into the incubator again with 5%
CO2 and 37-degree centigrade.
⊘ This is a preview!⊘
Do you want full access?
Subscribe today to unlock all pages.
Trusted by 1+ million students worldwide
9Running head: MEDICAL
Counting of cells: The assay used in this experiment to count the viable cells is named as
Trypan blue exclusion assay. The viable cells are differentiated from the dead cells in terms
of their cell membranes. The cell membrane of viable cells is intact which prevents the entry
of Trypan blue into the cells and thus does not have a blue colour. The dead cells have a blue
colour and the viable cells have a clear cytoplasm. 50 microlitre of cells were then suspended
in the media which is then placed in an Eppendorf, followed by an addition of 50 micro liter
of Trypan blue. The whole apparatus was then incubated at 25-degree centigrade (room
temperature) for three minutes. The cells were then counted using a FastRead-102 10-
chamber grid for counting cells (haemocytometer). Twenty micro liter of the sample was
added into the chamber present at the sample application area and then a 4X4 grid was
counted under a light microscope fixed at a magnification of 10x.
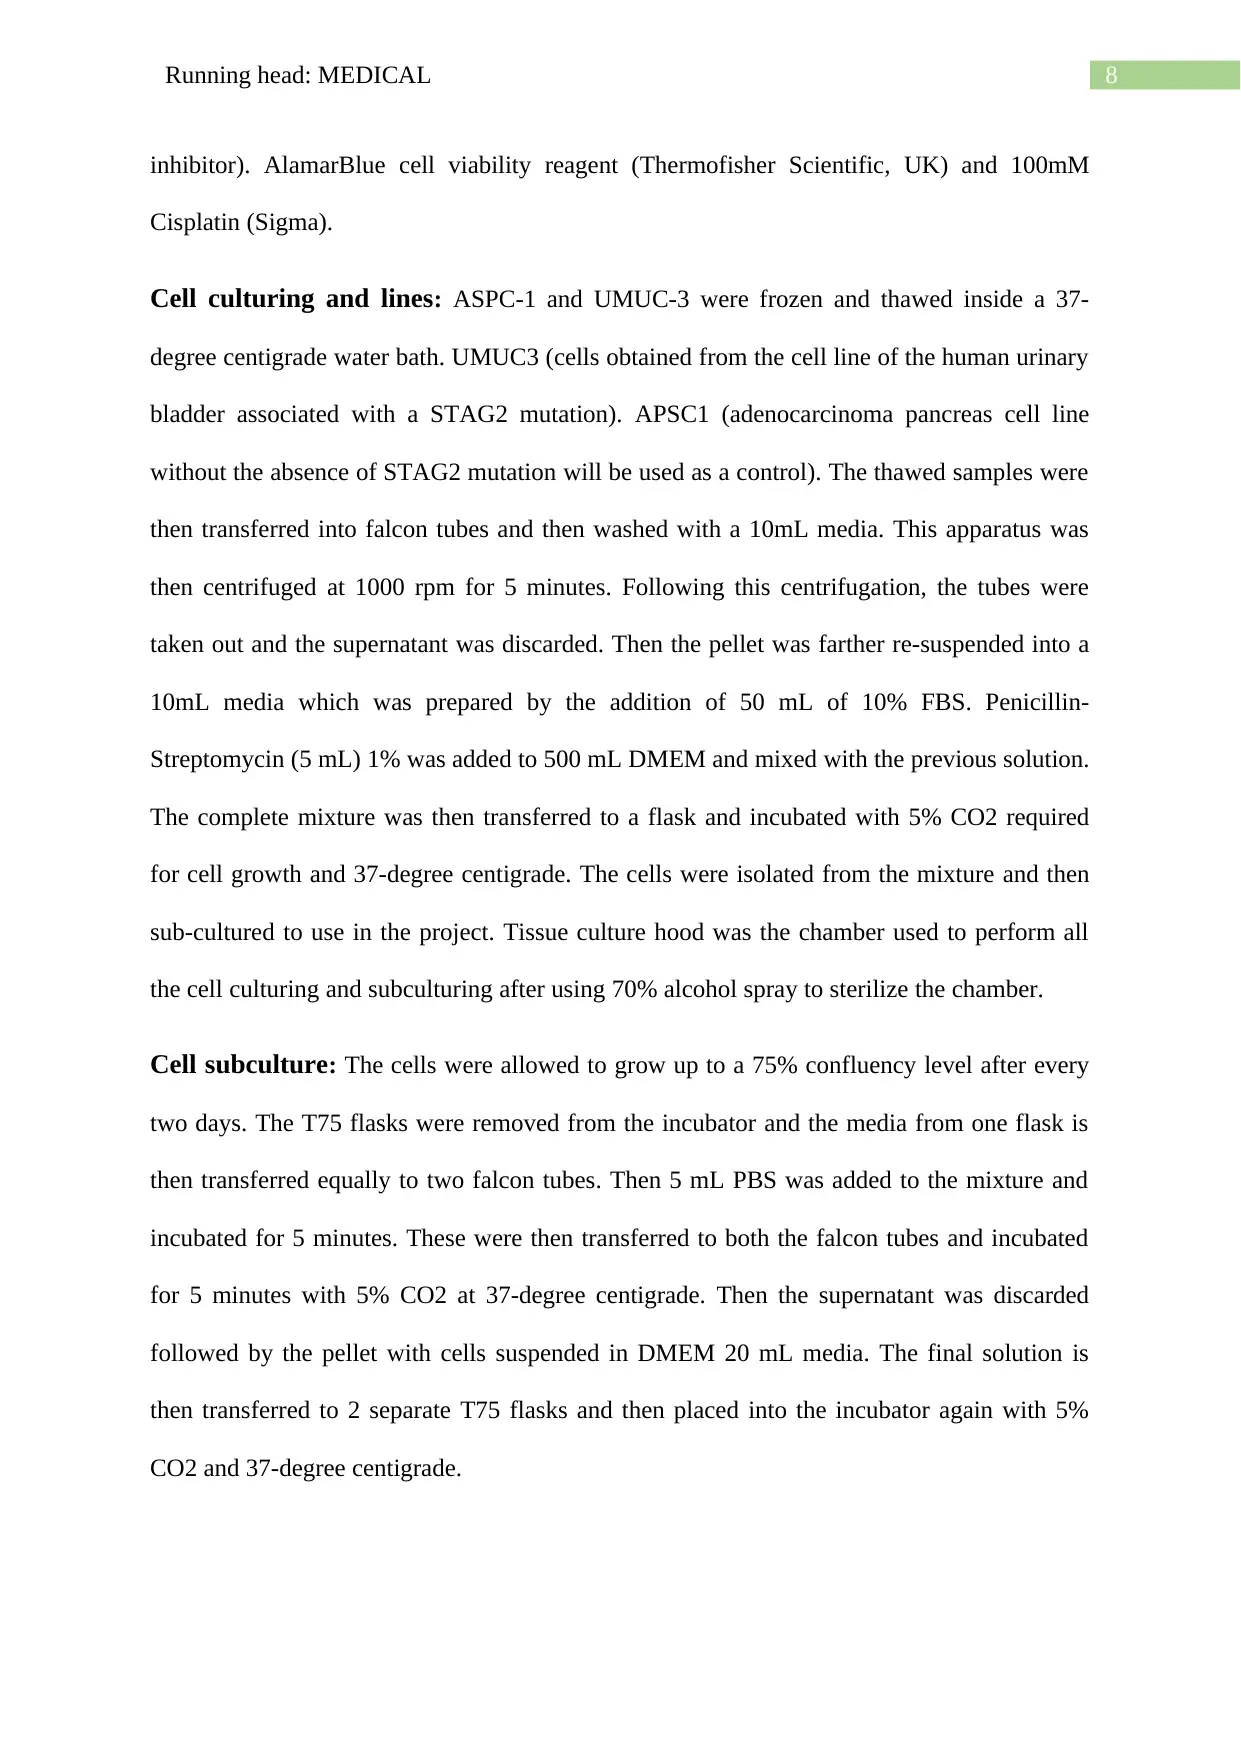
Calculation of cell counting: The chambers of the haemocytometer has 10, 4X4 grids (Fig
1),
Counts/mL= total counts
number of complete 4 X 4 grids counted X 104 X dilution of the sample
As an example, the figure below shows that five chambers having 67 live cells is counted if
the dilution of the sample was 3 mL. According to the formula stated,
Cell count= 67
5 x 104 x 3 = 402, 000
Counting of cells: The assay used in this experiment to count the viable cells is named as
Trypan blue exclusion assay. The viable cells are differentiated from the dead cells in terms
of their cell membranes. The cell membrane of viable cells is intact which prevents the entry
of Trypan blue into the cells and thus does not have a blue colour. The dead cells have a blue
colour and the viable cells have a clear cytoplasm. 50 microlitre of cells were then suspended
in the media which is then placed in an Eppendorf, followed by an addition of 50 micro liter
of Trypan blue. The whole apparatus was then incubated at 25-degree centigrade (room
temperature) for three minutes. The cells were then counted using a FastRead-102 10-
chamber grid for counting cells (haemocytometer). Twenty micro liter of the sample was
added into the chamber present at the sample application area and then a 4X4 grid was
counted under a light microscope fixed at a magnification of 10x.
Calculation of cell counting: The chambers of the haemocytometer has 10, 4X4 grids (Fig
1),
Counts/mL= total counts
number of complete 4 X 4 grids counted X 104 X dilution of the sample
As an example, the figure below shows that five chambers having 67 live cells is counted if
the dilution of the sample was 3 mL. According to the formula stated,
Cell count= 67
5 x 104 x 3 = 402, 000
Paraphrase This Document
Need a fresh take? Get an instant paraphrase of this document with our AI Paraphraser
10Running head: MEDICAL
Fig 1: Haemocytometer (10 chambers were counted for live cells)
Source:
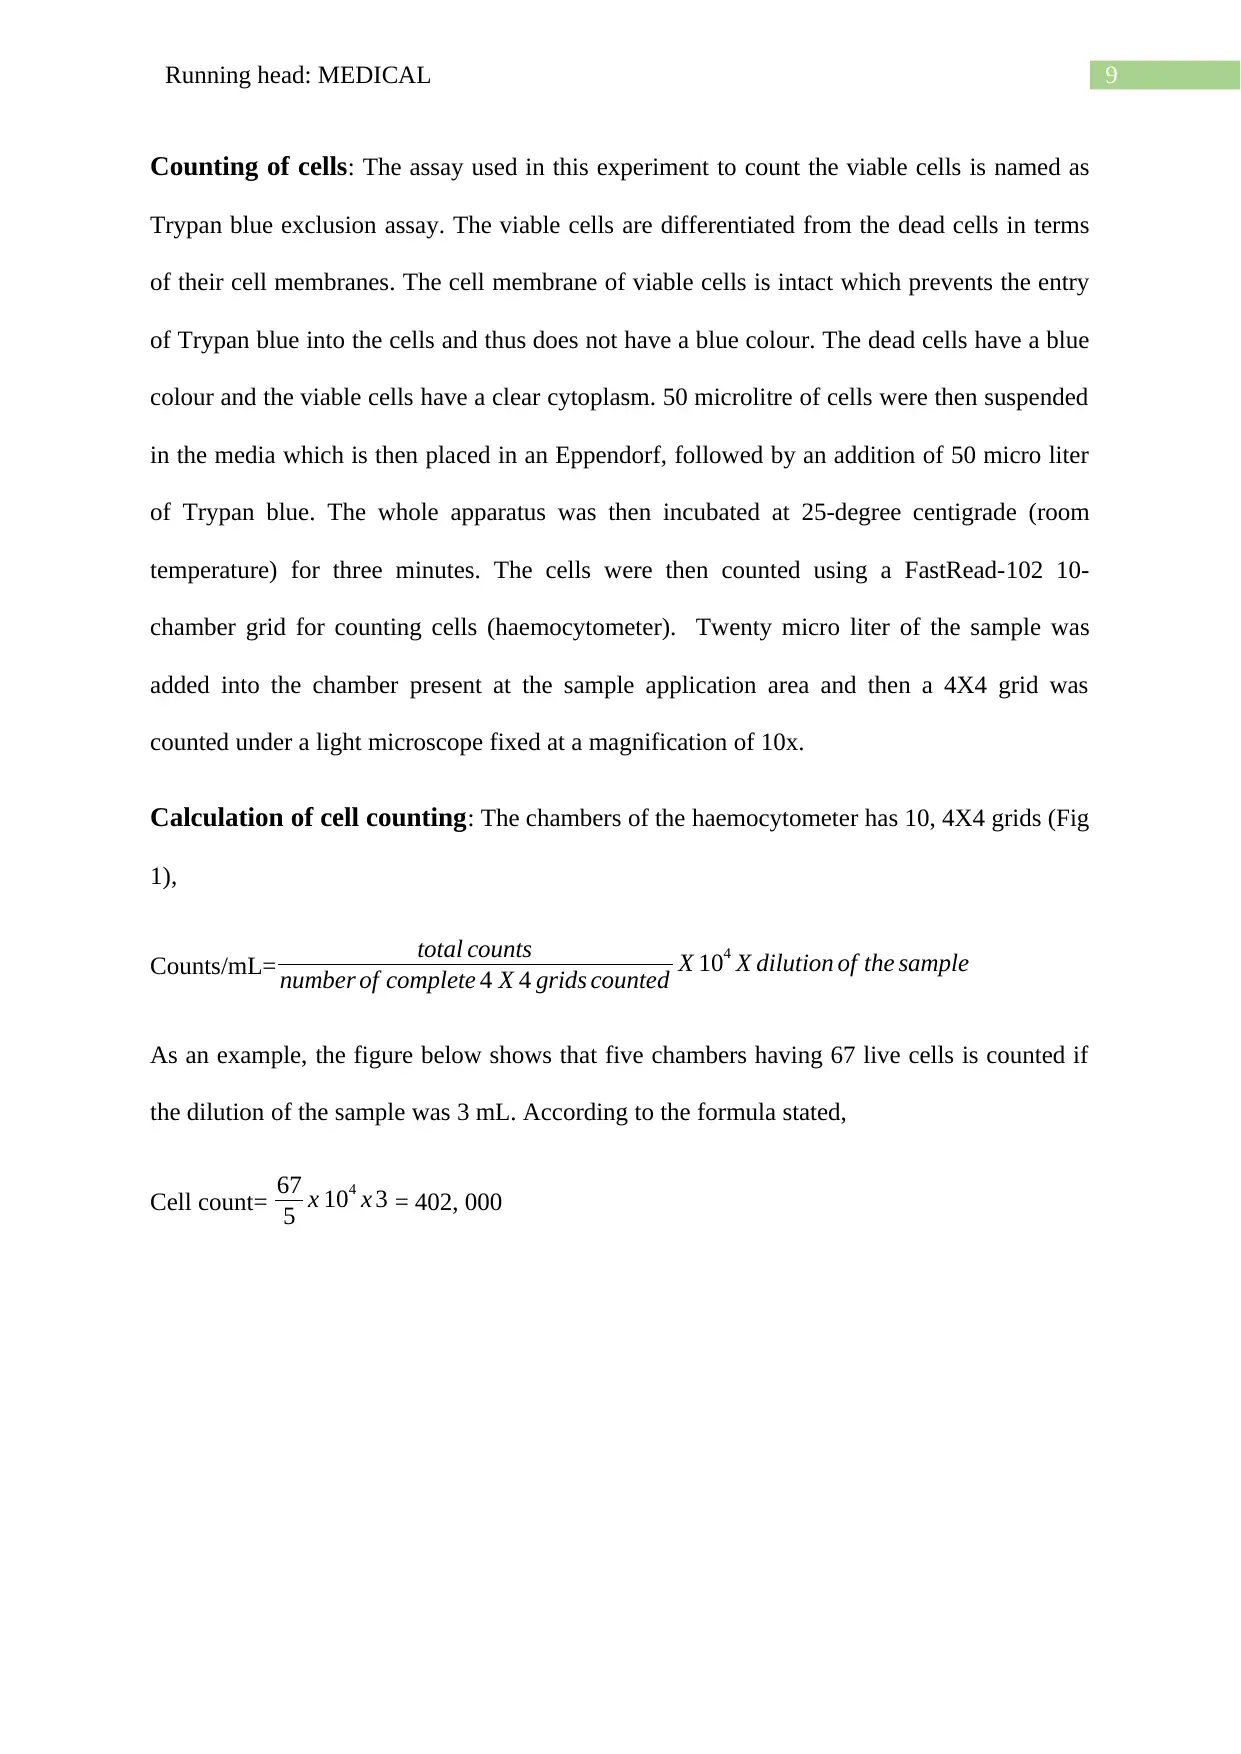
Preparation of drug and addiction of drugs: Determination of the effect of rapamycin
and chloroquine on the cell viability. An approximate value of 500,000 ASPC-1 and UMUC3
cells in the 2.5 mL medial was then divided into eight wells having several concentrations of
drugs being added to each of the wells. None of the drugs were added to the control wells
(A1) (Fig 2).
Fig 2: Plate representation
Fig 1: Haemocytometer (10 chambers were counted for live cells)
Source:
Preparation of drug and addiction of drugs: Determination of the effect of rapamycin
and chloroquine on the cell viability. An approximate value of 500,000 ASPC-1 and UMUC3
cells in the 2.5 mL medial was then divided into eight wells having several concentrations of
drugs being added to each of the wells. None of the drugs were added to the control wells
(A1) (Fig 2).
Fig 2: Plate representation
11Running head: MEDICAL
Source:
Preparation of Chloroquine: Four of the chloroquine stock concentrations were prepared
(10 mM, 10 micromoles, 1 micromole, and 0.1 micromole) as stated below-
Chloroquine (Molecular weight) = 515.86 g/mol
Final volume (Desired) = 10 ml = 0.01 L
Final concentration (Stock) [Desired] = 10 mM = 0.01 mol/L
Using: Mass (g) = Concentration(mol/ L)×Volume (L)× Formula Weight ( g/mol)
= 0.01 mol /L ×0.01 L× 515.86 g / mol
Mass = 0.051586g
Thus, it can be said that chloroquine of 0.0516 g was weighted off and then added to
PBS of 10 mL to prepare the primary stock solution with a concentration of 10 mM [Tube 1].
The secondary stock concentration was 10 micromolar, prepared by transferring 2.5
microlitres from tube 1 to 2.5 mL PBS. This solution was then diluted by 1000 factors to
make the desired concentration to 10 micromoles for tube 2. Ten microlitres were taken from
tube 2 and then transferred to PBS (900 ml) to prepare a final concentration of 1 micromole.
This is for tube 3. Ten microliters from the sample were taken from tube 3 followed by an
addition to 990 ml PBS in order to prepare a 0.1 micromole final concentration for tube 4.
Then, 2.5 microlitres will be taken from each of the chloroquine tubes and then added to B1,
B2, B3, B4 wells to prepare 10 μM, 0.01 μM, 0.001 μM, 0.0001 μM as the final
concentration.
In well B1,
Using the following equation, C1V1= C2V2
⊘ This is a preview!⊘
Do you want full access?
Subscribe today to unlock all pages.
Trusted by 1+ million students worldwide
1 out of 33

Your All-in-One AI-Powered Toolkit for Academic Success.
+13062052269
info@desklib.com
Available 24*7 on WhatsApp / Email
![[object Object]](/_next/static/media/star-bottom.7253800d.svg)
Unlock your academic potential
Copyright © 2020–2026 A2Z Services. All Rights Reserved. Developed and managed by ZUCOL.